Transcription
CHAPTER 3User Guide – Navigating Data DashboardsAuthors & ContributorsDepartmentNameResearch & GrantsCathy CopelandResearch & GrantsGrayson CourtResearch & GrantsSarah ChandlerPeriodic ReviewAnnual or as neededRevision HistoryDepartmentRequiredNameResearch & GrantsGrayson CourtDate9/15/2017Research & GrantsGrayson Court10/27/2017Research & GrantsGrayson Court6/15/2018Research & GrantsSarah Chandler1/14/2020This document is part of Lake Washington Institute of Technology Standard OperatingProcedures Library developed by Research & Grants. The Library provides versionhistory and access to materials and discussions captured during protocol development.1.0 Scope: The purpose of this guide is to help a user navigate within data dashboardsin the Tableau Server.2.0 Materials/Software/Supplies:2.1. Computer with Internet access through browser.2.1.1. Some browsers are more compatible with this software than others. Pleaseuse Chrome, if possible.2.2. Tableau Desktop software2.3. Tableau server login information.2.3.1. You must attend training to obtain a log-in to the server.3.0 Equipment:3.1. Computer with internet accessPage 1 of 10Doc # Tableau 3 v3Navigating Data Dashboards
4.0 Safety:4.1. Remember to take frequent breaks from the computer use to prevent eye strain!5.0 Procedure – Viewing the Dashboard5.1. Please see Chapter 2 for detailed instructions on how to navigate todashboards, including steps needed to access the workbook Enrollment andAcademic Success (Figure 1).Figure 15.2. In the workbook, select the primary dashboard Enrollment and AcademicSuccess. Here you will see enrollment trends and student outcomes, including:number of students enrolled, FTEs (full-time equivalents), withdrawal rates, totalcredit attainment, average credit attainment, percent earned all attempted credit,and earned 2.0 GPA or above. Please see Figure 2 for a sample of what youmight see.2 of 10Doc # Tableau 3 v3Navigating Data Dashboards
Figure 25.3. To learn more about what the data means, hover over the yellow lightbulb in thetop, right-hand corner, highlighted in Figure 2.5.3.1. A pop-out image will show on your screen titled “What does the datamean?” providing additional details of the underlying data that you seeon the dashboard. Please see Figure 3 for an example of what youmight see.5.3.1.1. For example, low-income students are those who received someform of need-based financial assistance.3 of 10Doc # Tableau 3 v3Navigating Data Dashboards
5.3.1.2. Additional details will also include how student FTEs are calculated.For instance, the dashboard calculates FTE enrollment as quarterlyFTEs based on credits registered divided by 15.Figure 35.4. To view more information about the college’s program inventory, select thesecond tab titled “Program Information”. Please see the highlighted tab in Figure4 for an example.4 of 10Doc # Tableau 3 v3Navigating Data Dashboards
Figure 45.5. You will be re-directed to the college’s program inventory titled Enrollment andAcademic Success: Program Information.5.5.1. Please see Figure 5 for an example. This dashboard provides detailedinformation about each academic program offered at the college,including: name of academic program, name of degree or certificatetrack within the program, credits within the program, the date when theprogram underwent curriculum revision and was entered into oursoftware management system (labeled here as ‘Updated’ as it is theearliest record we have in the database), and the educational programcode (EPC) associated with the degree/certificate track.5.5.1.1. Please note: A program may have been updated since the date givenin the dashboard; however, the entry might not have been updated inthe database. If you think the date is incorrect, please let CathyCopeland or Sarah Chandler know. (Please see highlighted area inFigure 5).5 of 10Doc # Tableau 3 v3Navigating Data Dashboards
Figure 55.6. Select the tab “Enrollment and Academic Success” to return to the primarydashboard.6.0 Procedure – Filtering the Dashboard6.1. In order to learn more about a specific program, select the filter “AcademicProgram”. Please see Figure 6 for an example.Figure 66 of 10Doc # Tableau 3 v3Navigating Data Dashboards
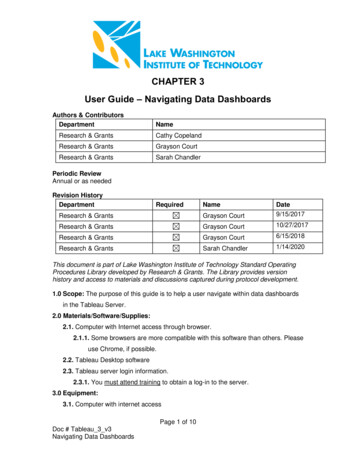
6.2. Once you select the filter, you will see all programs offered at the college. Select“All” to remove all programs, select “Accounting”, then select the button “Apply”(See circled images in Figure 7).6.2.1. Click to the side of the dashboard to collapse the drop-down menu.Figure 76.3. The dashboard will now be updated to reflect students only enrolled within theAccounting program. Please see Figure 8 for an example.7 of 10Doc # Tableau 3 v3Navigating Data Dashboards
Figure 86.4. To refresh the dashboard to its original view, click the back arrow, highlighted inFigure 9 (called “Revert” in Tableau).Figure 96.5. You can select more than one program at a time as shown Figure 10. TheAcademic Program will say “Multiple Values” so that you know more than oneprogram is selected.8 of 10Doc # Tableau 3 v3Navigating Data Dashboards
Figure 106.6. To view only full-time students enrolled within the combination of programs (orsingle program if you choose), click on the filter “Full-time/Part-time” and select“Full-time enrolled (12 credits)” (highlighted in Figure 11). The dashboard willchange again to reflect only full-time students enrolled in the Machining andWelding programs. Please see Figure 11 for an example. You will notice that thedata points for all categories have changed again to reflect the new group ofstudents.9 of 10Doc # Tableau 3 v3Navigating Data Dashboards
Figure 116.7. To interact with the dashboard further, you can hover over graphs and datapoints to learn more about the data you are viewing.6.8. To return to the original view (all programs with no filters selected), click on thebutton “Revert” near the top of the dashboard. The dashboard will completelyrefresh and return to its original view that you first saw.6.8.1. Hint: Selecting “Revert” is a good method to clear your selections andfilters to reset the dashboard.6.9. You are now ready to explore new information as the dashboard is reset.7.0 Contacts for troubleshooting7.1. If you have any trouble with this procedure, please contact Cathy Copeland orSarah Chandler for assistance.7.1.1. Their emails are cathy.copeland@lwtech.edu andsarah.chandler@lwtech.edu.10 of 10Doc # Tableau 3 v3Navigating Data Dashboards
Doc # Tableau_3_v3 Navigating Data Dashboards Figure 8 6.4. To refresh the dashboard to its original view, click the back arrow, highlighted in Figure 9 (called "Revert" in Tableau). Figure 9 6.5. You can select more than one program at a time as shown Figure 10. The Academic Program will say "Multiple Values" so that you know more than one