Transcription
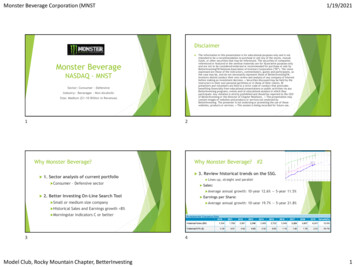
Monster Beverage Corporation (MNST1/19/2021Disclaimer Monster BeverageNASDAQ - MNSTSector: Consumer – DefensiveIndustry: Beverages – Non AlcoholicSize: Medium ( 1–10 Billion in Revenue)The information in this presentation is for educational purposes only and is notintended to be a recommendation to purchase or sell any of the stocks, mutualfunds, or other securities that may be referenced. The securities of companiesreferenced or featured in the seminar materials are for illustrative purposes onlyand are not to be considered endorsed or recommended for purchase or sale byBetterInvestingTM National Association of Investors Corporation (“BI”). The viewsexpressed are those of the instructors, commentators, guests and participants, asthe case may be, and do not necessarily represent those of BetterInvestingTM.Investors should conduct their own review and analysis of any company of interestbefore making an investment decision. Securities discussed may be held by theinstructors in their own personal portfolios or in those of their clients. BIpresenters and volunteers are held to a strict code of conduct that precludesbenefiting financially from educational presentations or public activities via anyBetterInvesting programs, events and/or educational sessions in which theyparticipate. Any violation is strictly prohibited and should be reported to the CEOof BetterInvesting or the Director of Chapter Relations . This presentation maycontain images of websites and products or services not endorsed byBetterInvesting. The presenter is not endorsing or promoting the use of thesewebsites, products or services. This session is being recorded for future use.1122Why Monster Beverage? Why Monster Beverage? #2 1. Sector analysis of current portfolio Consumer3. Review historical trends on the SSG. Lines– Defensive sectorup, straight and parallel Sales: Average 2. Better Investing On-Line Search Tool Small Earningsor medium size company Historicalannual growth: 10-year 12.6% -- 5-year 11.5%per Share: Averageannual growth: 10-uear 19.7% -- 5-year 21.8%Sales and Earnings growth 8% Morningstarindicators C or better33Model Club, Rocky Mountain Chapter, BetterInvesting441
Monster Beverage Corporation (MNST1/19/2021Why Monster Beverage? #3 Who is Monster Beverage?4. Review SSG management indicators. Pre-Taxalternative beveragestrend with an annual average of 34.3%on Equity Upward Debt Industry: Beverages – Non Alcoholic; Subsegment –Profit Margin on Sales Upward Return Sector: Consumer – Defensive Primarilytrend with annual average of 29.9%a brand owner. Develops,markets, sells and distributes allnatural beverages worldwide.to Capital – No Debt Strategic Multiple55relationship with Coca Colamarket channels66More About Monster BeverageExisting Markets:Monster Brand Committed to the safety and well-being of its employees Substantial 2020 philanthropic support 28 consecutive years of increased sales Strong growth in all sectors Innovation pipeline is full77Model Club, Rocky Mountain Chapter, BetterInvesting882
Monster Beverage Corporation (MNST1/19/2021Existing Markets:Strategic BrandsExisting Markets:Reign991010Existing Markets:Affordable EnergySWOT: Strengths and Weaknesses Strengths: Positive brand recognition Route to market efficiencies Product innovation Industry leading net income margins Strong financial position Repurchase 3-4% of shares over past few years - EPS boosterWeaknesses: Has1111Model Club, Rocky Mountain Chapter, BetterInvestingnever paid a dividend12123
Monster Beverage Corporation (MNST1/19/2021SWOT: Opportunities and Threats Opportunities 5-Year historical growth annual average – 11.5% Increased 10 Year historical growth annual average – 12.6% 3rd Quarter year over year – 9.9% BI 2-Year Analysist Consensus Estimate (ACE) – 10% Value Line’s 2-4 year estimate - 7.5% Other analysist estimates range from 9-12% Robust Sales Projection – Some Data Pointsmarket share.demandThreats Competition Shipment Tradingdisruptionsat all time highsPoll choices:9% 10% 11% 12%13131414Earnings Projection – Some Data PointsHigh Price Estimate – Projecting High P/E5-Year historical growth annual average – 21.8% 5-year average high P/E – 44.310-Year historical growth annual average – 19.7% 2-year (2018/2019) average high P/E – 36.3Poll Choices:3rd Quarter year over year – 18.2% Current P/E – 41.135 37 39 41 BI Long-Term Analysist Consensus Estimate (ACE) – 12.8% Average P/E – 37 Value Line’s 2-4 year estimate – 12.5% BI recommended high P/E - 30 Other analysist estimates range from 12% to 17%. Poll Choices: 35 37 39 41 Poll choices:11% 13% 15% 17%15Model Club, Rocky Mountain Chapter, BetterInvesting1516164
Monster Beverage Corporation (MNST1/19/2021Low Price Estimate – Projecting Low P/E 5-year average low P/E - 29.8 2-year (2018/2019) average low P/E – 25.35Poll Choices: P/E that represents 52 week low price ( 50.1) – 24.720 25 30 35 5 Year average P/E - 37 BI recommended maximum low P/E – 20Thank you!Any questions?1717Model Club, Rocky Mountain Chapter, BetterInvesting18185
Strategic relationship with Coca Cola Multiple market channels 6 More About Monster Beverage Committed to the safety and well-being of its employees Substantial 2020 philanthropic support 28 consecutive years of increased sales Strong growth in all sectors Innovation pipeline is full 7 Existing Markets: Monster Brand 8 5 6 7 8
