Transcription
Network Capacity MethodologyNetwork capacity is the volume of individual application transactions (simultaneous) that anetwork is able to support within pre defined response time service levels. This document willdescribe many of the key elements that effect network capacity and network performance.In many ways, network performance is the gauge that quantifies network capacity. Networkperformance is measured primarily by four factors, network speed (bandwidth), throughput,reliability, and latency. From the user’s perspective, network performance is best measured inresponse time – or the time required for individual application transactions to complete. This isnot always an accurate reading on merely network performance as response time can bedramatically affected by back-end system response.Looking strictly at the network, a capacity methodology must look at network resourceavailability, application requirements, and historical usage trends and evaluate the overallperformance impact of these trends based on the available capacity. It must also provide abaseline for evaluating the impact of network changes (new applications, new technology,network change, etc.).To predict the capacity of the network you must begin by documenting the following keyelements regarding network resources: Network architecture – Identify every subnet on the network and how it connects to allthe other subnets in the Enterprise. This includes:o Topology diagramo LAN mediao User density on each LANo Router locations (logical in the network)o WAN design (frame relay, leased line, ISDN, etc.)o Circuit speedso Routing protocolso Route tables (paths actually used by routers to send/receive data) Clients – Information regarding client location, platform, and applications used:o Where are the clients located?o How many at each location?o What client OS is used?o How many clients use each application?o How often do the clients use each application?o Number of clients for simultaneous application access from each location? Network Baseline – Historical information regarding network performance on specificnetwork links including:o Utilizationo Latency across specific linkso End-to-end latencyJim HudsonHttp://www.hudson-family.com/jim-techPage 1
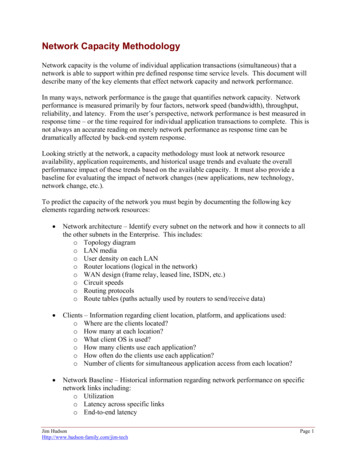
Application Servers – What type of servers and gateways are used in the network foreach application (Windows PDC and BDCs, DNS, Exchange, Notes, midrange systems,proxy, special applications). Application network baseline – A functional description of application software, how itis/will be used on the network, and the transmission characteristics of the application.Critical information will include the following:o Application server platformo Server location(s)o Client locations (number on each LAN)o Application data transmission detail for discrete application transactions. Application response time requirements – predefined requirements for applicationtransactions to complete.The science of network capacity is the way in which the above criteria are defined, collected,verified, and documented. The art of capacity planning is the way in which an experiencednetwork planner uses this information to predict the network resources required to maintainnetwork performance expectations.Once the network capacity data described above has been accumulated, the easiest way to beginis with logical network and application diagrams. The following is an example of a simpleWAN diagram:Jim HudsonHttp://www.hudson-family.com/jim-techPage 2
On an application diagram each application server must be placed in its logical position asrelated to network clients, routers and circuits between the routers. An example of an applicationdiagram for a manufacturing company Sales Application follows:Application Network ConnectivityJASnifferNetwork MonitorClient PC.22.34Client PC.61.218I10Mb Eth.HubB100Mb Eth.128Kbps (port)64Kbps (CIR)Admin Building3Com SwitchHCSnifferNetwork MonitorLisleRouterSaddlebrookRouter128Kbps (port)64Kbps (CIR)Computer Room3Com SwitchFG1Backbone3Com SwitchEG2SQL Server.20.99Frame RelayWAND384Kbps (port)192Kbps (CIR)768Kbps (port)384Kbps (CIR)CatawbaRouterExchange Server.21.220CharlotteRouter768Kbps (port)384Kbps ? (CIR)384Kbps (port)192Kbps (CIR)Greenville, SCRouterBenton HarborRouterThis diagram shows application connectivity from two client locations – one local and oneremote. The data transmission routing is visually straight forward, however, should always beverified with a trace route or from the routing tables. The bandwidth of each WAN circuit andLAN subnet has been identified.The next step in capacity planning is to document the average and sustained peak utilization,latency, and round-trip-time for each link in the application data flow - referring to the abovediagram, segments B, C, D, F, G, and H.Many commercial tools are available to model the network and evaluate capacity – both currentcapacity used as well as the capacity and performance impact of network changes and newapplications. These tools require detailed and precise network topology background andutilization information. Network changes can then be modeled and reports generated to indicatethe impact of the changes.Jim HudsonHttp://www.hudson-family.com/jim-techPage 3
Short of using a commercial network modeling product, the most simple and straightforwardmethod to document capacity change is to build a table (spreadsheet or database) where eachconnection point to be evaluated is identified along with the current capacity and the anticipatedcapacity changes. The following table represents a simple version of this type of table:The source for the existing network infrastructure data must be based on measured networkutilization. Once the current network environment and capacity is documented. Changes in theinfrastructure, resources, or applications can be overlaid on this information. Capacity changefigures can be derived from a mixture of real and estimated values based on a number of factorsincluding: Vendor information Actual circuit speed changes Lab testing Client changes – location and number Server changes – location, subnet, distributionNot all application vendors provide the detail required to evaluate their software against networkcapacity. VeriSign offers an Application Network Review (ANR) process in which we evaluatethe above factors in conjunction with existing network infrastructure to predict the impact newapplications or technology changes will have on various points in the network. A new feature inthe ANR is the ability to incorporate network baseline information to predict capacity andresponse time limits.The following table is a single segment sample of the ANR worksheet:Jim HudsonHttp://www.hudson-family.com/jim-techPage 4
In the end, a network capacity methodology requires an ongoing process incorporating networkmonitoring, application distribution and usage management, network change management,application performance monitoring, and service level verification. With this information,network planners can monitor the performance of the existing network, evaluate the impact ofnetwork change, and make appropriate adjustments based on performance trends.Jim HudsonHttp://www.hudson-family.com/jim-techPage 5
Network Analysis GlossaryThe following glossary provides a description of network performance terms used in deliverablesalong with a description of the various graphs and charts, and “best practices” used in theanalysis.Application ResponseThis report provides a breakdown of the most used IP protocols (SNMP, HTTP, DNS,etc.) typically based on volume (total transactions) and average response time (latency).The Applications report is useful for spotting trends, usage statistics and spotting unusualnetwork delay issues.The measured application network response time is the roundtrip elapsed time between apacket leaving a device, reaching the destination device where it is processed andreturning to the source device. Response times will vary based upon bandwidthavailability, application requirements, routing protocols, topology, destination deviceresponse/performance, etc.DLCI (CIR) UtilizationFrame Relay circuit utilization broken out by Data-Link Connection Identifiers (DLCIs).A DLCI Utilization report is useful for locating overused Frame Relay connections. Itdisplays the percentage of the Committed Information Rate (CIR) used or the amount oftime the CIR was exceeded (on the y-axis) for each DLCI (on the x-axis). Each PVC ona frame relay network should be able to sustain 100% CIR utilization without affectingthroughput or response time. As a rule, the frame relay network should be designed tosupport 100% CIR utilization on all PVCs simultaneously. This is not to therecommended starting point for customers, however, it is the starting “commitment” fromthe carrier. 100% CIR utilization means that the customer is maximizing the use of theirinvestment. Beyond this, burst capacity should be designed into each physical port toaccommodate occasional traffic spikes. Sometimes it is necessary to oversubscribe agiven circuit. This can happen in many ways. Basically this is when the total inbound oroutbound CIR on all PVCs exceeds the capacity of the physical port. While this is notrecommended, it can be a useful design option depending on the way the carrier bills forthe circuit, with low overall utilization and bursty traffic. The balance between thenumber of PVCs on a single circuit, the total CIR, network over subscription, burstcapacity and performance must be constantly monitored to ensure quality of service.The graphs used in the WAN Performance Analysis are a mixture of DLCI utilizationbased on CIR and DLCI utilization based on total port speed. The preference is to reportDLCI utilization based on percent of CIR. This provides a simple way to gauge how wellthe CIR value is provisioned.When viewing utilization graphs, an apparent “ceiling” may be observed. Regardless ofthe utilization level at which this ceiling appears, it can indicate a bottleneck somewhereJim HudsonHttp://www.hudson-family.com/jim-techPage 6
in the network. If this ceiling is at a low utilization level, it probably indicates abottleneck in the carrier network or at the destination end of a lower bandwidth framerelay PVC. In a Frame Relay network, these ceiling’s are usually accompanied byincreased congestion reporting.DLCI CongestionThe DLCI congestion report identifies Backwards Explicit Congestion Notifications(BECN) and Forward Explicit Congestion Notifications (FECN) that occurred duringperiod of analysis. FECNs and BECNs are indicated by a bit in the frame relay headerthat indicates that congestion may be present in the network for traffic traveling in thedirection opposite to the direction of the frame in which the bit is set.While congestion notification alone does not cause or indicate retransmissions or dataloss, persistent congestion does indicate constraints in the network to support the volumeof traffic being transmitted. Persistent congestion can also cause data to be buffered inthe routers and in the carrier network thus adding to transmission delay (latency).IP ProtocolsIP (Internet Protocol) is a network protocol used to uniquely identify hosts and transportdata across an internetwork. Higher layer protocols are used to exchange data between IPand applications. Using the OSI model, higher layer protocols include TCP, UDP,NetBIOS, SMTP, SNMP, etc. At the top of the OSI model, IP applications are used inconjunction with other applications or stand-alone to exchange data between devices.The following table lists many of the most common IP based 3SMTPSNMPTCPTelnetTFTPUDPLine UtilizationLine Utilization is the amount of used throughput capacity on a given network medium.On a WAN circuit, sustained utilization of more than 40 percent of the theoretical limit isnot recommended. Greater than 60 percent utilization can result in a rapidly increasingnumber of dropped packets, retransmissions, and slow response times. Utilization above80% is possible for short periods of time, however, due to windowing andacknowledgements, the TCP protocol is unable to sustain utilization in excess of 80% formore than a few minutes at a time. UDP is capable of sustaining utilization over 80%,however, this only further reduces TCP throughput.Jim HudsonHttp://www.hudson-family.com/jim-techPage 7
Depending on the sampling period, sustained utilization over 40 percent usually indicatesspikes at double that rate. The shorter the sampling period the more accurate the results.A period of 5 minutes or less typically relates true utilization spikes. Periods of 15minutes and longer tend to reflect trends averaged through the period and hide trafficspikes.When viewing utilization graphs, an apparent “ceiling” may be observed. Regardless ofthe utilization level at which this ceiling appears, it can indicate a bottleneck somewherein the network. If this ceiling is at a low utilization level, it probably indicates abottleneck in the carrier network or at the destination end of a lower bandwidth framerelay PVC. In a Frame Relay network, these ceiling’s are usually accompanied byincreased congestion reporting.Network PerformanceNetwork performance is primarily measured by four factors, network speed (bandwidth),throughput, reliability, and latency. From the user’s perspective, network performance isbest measured in the time required for a particular application task to complete. Strictlyfrom the network, performance is best measured in throughput and latency.The following list identifies many of the terms and factors that contribute to networkperformance. Client Performance and resource availability (CPU, disk, memory, etc.).Server Performance and resource availability (CPU, disk, memory).Application Protocol – Beyond TCP, UPD, IPX, DecNet, etc., higher layer protocolsare used to transfer data to/from applications. Examples of these are SNMP, FTP, SMTP,NetBIOS, etc. Some protocols require more client overhead than others. Someapplications communicate directly through core protocols (e.g. browser software accessesHTTP directly) while other applications “wrap” application data with multiple protocols(e.g. Microsoft - NetBIOS wrapped with TCP/IP) for network transmission.Application performance - how well an application is written, data interface, resourceusage, etc.Network Transmission Protocol – TCP, UDP, SPX, SNA, NetBIOS, etc. Thetransmission protocol can make a significant difference in the performance of networktransactions. For example, UDP can sustain higher network throughput but leavestransmission reliability up to the application, thus potentially slowing the application oroverall response for large data retransmissions (transmissions more than 2x TCP windowsize). By contrast, TCP (Transmission Control Protocol) supports out of sequencereassembly, windowing, transmission acknowledgements and session control, however,TCP throughput is limited by the windowing technique used.Protocol stack – host settings for buffers, simultaneous sessions, number of activeconnections, etc. all affect overall performance.Network topology –Performance factors include connectivity between devices, numberor routers, routing policies, route tables, route definitions, switch connectivity.Bandwidth – bit-rate capacity to transmit/receive data at a given location on the network.Note LAN media can be half or full duplex, WAN circuits are full duplex.Jim HudsonHttp://www.hudson-family.com/jim-techPage 8
Throughput – the actual (measured) end-to-end connection bit-rate capacity for a givenconnection across the network. Typically includes time to set up connection, datatransmission, acknowledgements, protocol and application overhead, end-station latency,etc.Reliability – A measure of network availability and quality of data transmission.Propagation Delay – The time required to transmit (or pass a frame) through a distinctpart of the network (first bit to last bit). In other words, how long it takes a giventransmission point (router, frame relay switch, etc) to transmit a frame into the network.Latency – The end-to-end transmission time of a single frame. Can be measured firstout to first-in or first-out to last-in. Sometimes reported in round-trip-time.Round Trip Time – The total time for a frame to be transmitted between two devices and aresponse received by the sender. Depending on the protocol used, round-trip-time may alsoinclude time for the destination to process and “turn-around” or acknowledge the frame.Congestion – Network Congestion can cause forced slow-downs on the network. Onframe relay, FECNs and BECNs are used to request that the transmitting network device(i.e. router) slow down. On shared Ethernet (hubs and coax), high utilization andcongestion will cause data transmission delays.Retransmission – Certain protocols (like TCP) use acknowledgements to confirm thesuccessful delivery of data packets. Retransmissions are duplicate data sent across thenetwork when the original data was not acknowledged within a predefined length of time.If the time-out value for these acknowledgements is set too short, retransmissions canoccur needlessly compounding network utilization and congestion.Broadcasts – broadcasts are frames of data sent to a special address (ex.255.255.255.255 for an IP broadcast) recognized by all devices on the network (orsubnet). Broadcasts are typically forwarded to all devices on the subnet of origin.Routers typically do not forward broadcasts to other subnets. All devices receiving abroadcast frame must accept that frame and evaluate if the data in the broadcast is for anapplication or process running on that device. Excessive broadcasts can degradenetwork, host and application performance by consuming valuable bandwidth, CPUprocessing time and protocol stack resources.Top ConversationsThe Top Conversations report lets you view the most “talkative” host pairs on thenetwork. Alternatively, a set of devices and conversation statistics between those devicesmay also be reported. This report displays network traffic on the y-axis, and the hostsinvolved in the network conversations on the x-axis.Top HostsThe Top Hosts report shows the distribution of traffic to and from hosts on the network.The report displays each of the top hosts on the x-axis and data measurement in totalbytes on the y-axis. This report is useful for examining the busiest hosts on the network.Top IP ProtocolsThe Top IP Protocols report provides a break-down of the most frequently used highlevel IP application protocols (SNMP, HTTP, FTP, ICMP, etc.). The report displays eachJim HudsonHttp://www.hudson-family.com/jim-techPage 9
of the top protocols on the x-axis and data measurement in bytes on the y-axis. The TopProtocols report is useful for spotting trends, usage statistics and identifying unusualnetwork traffic.In the Top IP Protocols report, unidentified protocols appear labeled as “Other”. Theseconsist of IP traffic that do not use standard – well-known ports or is not identified by themonitoring software with an upper layer port. With further analysis, identifyingsource/destination addresses or looking at payload data may deduce these protocols.Top MAC ProtocolsThe Top MAC Protocols report provides a break-down of the most frequently used highlevel application protocols based on the MAC packet type. This report is useful forspotting trends, usage statistics and identifying unusual network traffic and protocols.Jim HudsonHttp://www.hudson-family.com/jim-techPage 10
Network capacity is the volume of individual application transactions (simultaneous) that a network is able to support within pre defined response time service levels. This document will describe many of the key elements that effect network capacity and network performance. In many ways, network performance is the gauge that quantifies network capacity. Network performance is measured .