Transcription
Intelligence 68 (2018) 109–116Contents lists available at ScienceDirectIntelligencejournal homepage: www.elsevier.com/locate/intellA snapshot of g? Binary and polytomous item-response theory investigationsof the last series of the Standard Progressive Matrices (SPM-LS)T⁎Nils Myszkowskia, , Martin StormebabDepartment of Psychology, Pace University, USALaboratoire Adaptations Travail-Individu, Université Paris Descartes – Sorbonne Paris Cité, FranceA R T I C LE I N FOA B S T R A C TKeywords:Item-Response TheoryGeneral Mental AbilityIntelligencePsychometrical investigationRaven’s progressive matrices (Raven, 1941) are extremely popular measures of general mental ability. However, theirlength may not suit every researcher’s or practitioner’s needs. Short versions of the Advanced version have resulted inproblematic factor structures and internal consistencies (Arthur, Tubre, Paul, & Sanchez-Ku, 1999; Bors & Stokes,1998): Is the last series of the Standard Progressive Matrices a more viable option? The aim of this research was toinvestigate the structural validity and internal reliability of the last series of the SPM (SPM-LS) as a standalonemeasure. The SPM-LS binary (correct/incorrect) responses of 499 undergraduate students were investigated throughunidimensional Item-Response Theory (IRT) 1–4 Parameter Logistic (PL) models. They were satisfactorily modeledby unidimensional models (CFI3PL 0.974, TLI3PL 0.959, RMSEA3PL 0.059, SRMR3PL 0.056), offering goodempirical reliability (rxx′,3PL 0.843), and outperforming the short Advanced Progressive Matrices’ previously reported qualities. Full nominal responses – recovering information from the distractor responses – were further examined with recently introduced 2–4 Parameter Logistic Nested (PLN) models (Suh & Bolt, 2010), providing significant reliability gains (Δrxx′ 0.029, Bootstrapped 95% CI [0.019, 0.036], z 6.06, p .001). Uses, limitations,conditional reliability and scoring strategies are further examined and discussed.1. IntroductionRaven’s Standard Progressive Matrices (SPM) test (Raven, 1941) –along with the Advanced Progressive Matrices (APM) test – are certainly among the most heavily used and most easily administeredmeasures of general mental ability (Pind, Gunnarsdóttir, &Jóhannesson, 2003). Because of their non-verbal content, and thus lowculture loading, and because of their correlations with multidimensional measures of intelligence (e.g., Jensen, Saccuzzo, & Larson,1988), they are often considered as central among other measures ofcognitive ability (e.g., Carpenter, Just, & Shell, 1990). Although theyhave been criticized for not imperfectly reflecting pure g (Gignac,2015), and although the form of analytic intelligence measured byRaven’s matrices may to some extent be multifaceted (Carpenter et al.,1990), Raven’s matrices are often considered as one of the purestmeasures of g or fluid intelligence.A limitation of these tests is their length: The SPM is composed of 60items and the APM is composed of 36 more complex items. Althoughconveniently administered, they may not fit well in one-hour researchprotocols that aim to administer other measures (Arthur, Tubre, Paul, &Sanchez-Ku, 1999). Accounting for these length issues, the APM have⁎been primarily studied as candidates for two shortened 12-item versions (Arthur et al., 1999; Arthur & Day, 1994; Bors & Stokes, 1998),through two different methods – one selecting items systematicallyfrom all series (Arthur & Day, 1994), the other basing itself on itemtotal correlations (Bors & Stokes, 1998).1.1. The shortcomings of the short APMHowever, there are various limitations to these two APM versions.First, the existing psychometric investigations of these scales haveproduced mixed results, with especially somewhat problematic internalconsistencies – with variable Cronbach’s αs, ranging from 0.58 (Ablard& Mills, 1996) to 0.73 (Bors & Stokes, 1998) – and problematic fit of aunidimensional factor structure – with Comparative Fit Indices around0.90 (Bors & Stokes, 1998), Tucker-Lewis Indices ranging from 0.84 to0.87 (Arthur et al., 1999), and Non-Normed Fit Indices around 0.88(Bors & Stokes, 1998). Because of the short length of these versions,their qualities have been considered acceptable, but the estimates reported are actually typically considered as insufficient (e.g., Hu &Bentler, 1999). In addition, Bors and Stokes (1998) actually report a 2correlated factors solution to fit the data slightly better than a one-Corresponding author.E-mail address: nmyszkowski@pace.edu (N. 03.010Received 17 October 2017; Received in revised form 15 March 2018; Accepted 26 March 20180160-2896/ 2018 Elsevier Inc. All rights reserved.
Intelligence 68 (2018) 109–116N. Myszkowski, M. Stormeslope of the relation between θ and p(θ) is maximized. Two-ParameterLogistic (2PL) models allow items to vary not only by difficulty, but alsoby strength of relation between θ and p(θ), which is represented by a“slope” or “discrimination” parameter. Three-Parameter Logistic (3PL)models further allow items to vary by one of the asymptotes in therelation between θ and p(θ). Habitually, a variable lower asymptote ismodeled, which then represents the probability to succeed an item evenat very low θ levels – in other words the probability of a correct guess.For that reason, that third parameter is often referred to as a “pseudoguessing” parameter. Finally, the 4-Parameter Logistic (4PL) modelfurther allows items to vary by both the asymptotes in the relationbetween θ and p(θ). As the lower asymptote is typically estimated in3PL models, the second asymptote modeled in 4PL models then corresponds to the probability of failing an item in spite of a very high θ.Consequently, this parameter is often called an “inattention” or “slipping” parameter.Because the items of the SPM-LS present test takers with a set ofpossible answers that include the correct one, we hypothesized thatguessing was not negligible – and thus should not be fixed to 0 – norperfectly random – and thus should not be fixed to 1/8th. Therefore, wehypothesized that the 3PL and 4PL models, which estimate a pseudoguessing parameter, would present a better fit of the responses than the1PL and 2PL. We however hypothesized that inattention for a test ofsuch short length would be minimal, and thus hypothesized that the3PL model would actually fit the data better than the 4PL, which estimates an inattention parameter.factor solution, further questioning the tests’ unidimensionality. Theauthors trace back this issue to the original APM test itself, whoseunidimensionality was also questioned (Dillon, Pohlmann, & Lohman,1981).Second, all of the investigations of these short measures have usedClassical Test Theory (CTT) approaches – based on the matrix of correlations between items (“limited information”), not the raw responses(“full information”). CTT is especially pointed out as lacking in thestudy for ability measures of varying difficulty levels (Macdonald &Paunonen, 2002). More generally, CTT is often pointed as deficientcompared with Item-Response Theory (IRT) in the study of psychological measures, for the reason that CTT constrains the study of the relation between the construct and its observations, by essentially fixingobservations to reflect a “true score” with added random noise(Borsboom, 2006). In contrast, IRT allows to model responses as predicted by a non-linear function of the latent ability. In the case of categorical responses, IRT especially allows to model item responses withlogistic functions of the ability. Finally, IRT allows to account for avariety of testing phenomena that CTT cannot account for, such aspseudo-guessing and slipping.Finally, preferring the APM as a candidate for a short version is notthe only available solution. Because of their complexity, the APM mayappear more called for in samples of post-secondary students, but 1)post-secondary students are primarily heavily studied for convenience,and are not representative of the general population in intelligence, and2) even in post-secondary student samples, the observed scores of theSPM are high but still allow to measure interindividual variability (e.g.,Myszkowski, Storme, Zenasni, & Lubart, 2014), up to IQ levels of 134(Jensen et al., 1988), corresponding to the 99th percentile of a normalIQ distribution. In other words, the SPM is of course easier than theAPM, but its coverage is sufficient as a quickly administered IQ proxy inthe normal range, as demonstrated in correlation studies between IQmeasures and the test (Jensen et al., 1988). Thus, while the APM seemsan optimal choice, the SPM can also be considered a good candidate fora short version, which could certainly be more appropriate for thegeneral population, but still appropriate for post-secondary students.1.4. Recovering distractor information with polytomous IRT modelsAlthough the outcomes of the SPM are typically treated as dichotomous (e.g., Lynn, Allik, & Irwing, 2004), there are actually 8 possibleresponses per item, and not only 2. Therefore, in reality, the SPM-LSdoes not directly result in binary responses, but in polytomous ones.Further, incorrect responses may include information about the abilitybeing tested (Vodegel Matzen, van der Molen, & Dudink, 1994), suggesting that the modeling of raw polytomous responses of the SPM-LSitems with polytomous IRT models could recover such information.A heavily used IRT model of polytomous responses is the NominalResponse Model (NRM) introduced by Bock (1972), which estimatestwo parameters – the same parameters of location and slope than in thebinary 2PL model – for each response category of each item. Suh andBolt (2010) recently argued that the NRM model is appropriate for situations where the response to an item can be assumed to result from acomparison of all responses, but less appropriate for situations wherethe distractors are only considered as potential responses for test takersthat are unable to find the correct response – in other words, for suchsituations, if the test taker follows the correct strategy, the correct response is found and the distractors are overlooked, while, if the taker isunable to follow the correct strategy, then and only then the examineeconsiders distractors are potential responses. For these situations, Suhand Bolt (2010) adapted Nested Logit Models (NLM) – which modelnominal outcomes as conditional upon a series of choices – to ItemResponse Theory. IRT NLMs have two levels: Level 1 distinguishescorrect from incorrect responses – for such purposes, a binary 2-4PLmodel is used – while Level 2 models distractor responses with anominal model, conditional upon an incorrect response (Suh & Bolt,2010).In other words, as explained by its original authors (Suh & Bolt,2010), a 3-Parameter Nested Logit (3PNL) model models the probability P(Uij 1 θj) than examinee j chooses the correct response for anitem i as a function of examinee ability θj and item parameters βi (location), αi (slope), and γi (lower asymptote):1.2. Revising the SPMIn this study, we aimed at proposing a way to overcome the limitations of the existing short APM measures and of their investigations,by proposing an investigation of a short SPM version, which consists ofthe full most complex last set to be taken as a standalone. Additionally,since we pointed CTT assumptions to not be appropriate for Raven’smatrices tests, we addressed the shortcomings of the previous investigations with the use of an alternative framework, IRT, which allows to model responses as they relate to examinee-specific latentability and item-specific characteristics.1.3. Studying binary responses with IRTBecause each incomplete matrix has only one correct answer and noanswer considered partially correct, the typical scoring of the SPM is acount of correct answers. In other words, the categorical responses aredichotomized into pass/fail (0/1) binary responses. One of the mostuseful frameworks in analyzing the structure and score reliability ofinstruments that produce such responses is the IRT framework, whichconsists in building latent variable explanatory models of each itemresponses. In other words, IRT models the probability p(θ) of a specificresponse to an item as a function of the latent trait or ability (θ) –assumed constant for each test taker.In binary IRT, responses are typically modeled as logistic functionsof the ability. The resulting logistic models vary upon their number of(free) item-dependent parameters. One-Parameter Logistic (1PL)models, also named “Rasch” models, only allow items to vary by theirdegree of “difficulty” – or “location” – which is the point where theP (Uij 1 θj ) γi 1 γi1 e (βi αi θj )Further, for an item with mi distractor categories (in the case of the110
Intelligence 68 (2018) 109–116N. Myszkowski, M. Stormelogical rule used in the incomplete matrix, and to apply that rule toidentify the missing stimulus. The participants had no time limit toanswer the 12 items, and were encouraged to respond every item, evenwhen they were unsure of their response.SPM-LS, mi 7 for all items), the probability of choosing a distractor v,which is noted P(Uij 0, Dijv 1 θj), is modeled as the product of theprobability of an incorrect response 1 P(Uij 1 θj) and the probability of selecting distractor v conditional upon an incorrect response P(Dijv 1 Uij 0, θj). Similar to a Nominal Response Model (Bock,1972), this conditional probability part is a function of item categoryparameters ζiv (intercept) and λiv (slope) of the considered category v,and of the sum across all mi distractor categories of the propensitiesmtowards each distractor category k i 1 e ζik λik θj .2.3. Data analysis2.3.1. CTT analysesWe noted earlier that the other short versions of Raven’s matrices(Arthur & Day, 1994; Bors & Stokes, 1998) have relied on traditionalCTT methods. Thus, for the sake of comparability between the SPM-LSand the short APM versions, similar CTT-based methods were used onthe SPM-LS.First, to explore the dimensionality of the SPM-LS, based on thetetrachoric correlations between the 12 items, we conducted anExploratory Factor Analysis (EFA) with parallel analysis (Hayton, Allen,& Scarpello, 2004; Horn, 1965), as implemented in the R package‘psych’ (Revelle, 2017).The SPM-LS being theoretically unidimensional, we also usedConfirmatory Factor Analysis (CFA) to examine the fit of a unidimensional model. The CFA was performed with the R package ‘lavaan’(Rosseel, 2012), with Weighted Least Squares Means and Varianceadjusted (WLSMV) estimation. As typically recommended (Hu &Bentler, 1999; Yu, 2002), we used the Comparative Fit Index (CFI) andTucker-Lewis Index (TLI) with cut-offs of 0.95, the Standardized RootMean Square Residual (SRMR) with a cut-off of 0.08, the Root MeanSquare Error of Approximation (RMSEA) with a cut-off of 0.06, and theWeighted Root Mean Square Residual (WRMR), with a cut-off of 1.0.For reliability, we computed Cronbach’s α, as well as the now recommended unidimensionality index McDonald’s ωh (Revelle &Zinbarg, 2009; Zinbarg, Yovel, Revelle, & McDonald, 2006). McDonald’s ωh was based on the CFA model and computed with the package‘semTools’ (Contributors, 2016). e ζiv λiv θjP (Uij 0, Dijv 1 θj ) [1 P (Uij 1 θj )] mi ζ λ θ ik ik j k 1 e In Raven’s matrices, an examinee is expected to extract a logical rulebased on the observation of the incomplete matrix. The successful extraction of the logical rule then allows the examinee to retrieve thecorrect missing part (Carpenter et al., 1990). Should this strategy fail,then participants may proceed to a guessing strategy, which may still bein part related to their cognitive ability (Vodegel Matzen et al., 1994).Thus, it appears that the responding process of Raven’s matrices corresponds to the description of the processes that are best modeled withNested Logit Models (Suh & Bolt, 2010): Examinees are expected to findthe correct answer through the identification and application of the ruleof the matrix (Level 1). Should the examinee not be able to properlyidentify or apply the rule, then and only then would the distractors beconsidered as potential responses (Level 2).Therefore, we hypothesized that the NLM would better fit the responding process than the NRM, and would thus outperform it here.More specifically, a NLM with a 3PL level 1 model – in other words, a3PNL (for 3-Parameter Nested Logistic) model – was hypothesized to fitthe nominal data the best, for the same reasons (previously explained)that we hypothesized the 3PL model to best fit the dichotomized data.Because binary and polytomous models do not fit the same variables, they cannot be compared with typical IRT model comparisontools – such as Likelihood Ratio Tests. However, the capability ofpolytomous IRT to recover supplementary information from the distractors may help result in slightly different, and potentially more reliable estimates of θ, especially for test takers of low ability (Bock,1972). For this reason, we hypothesized that the best fitting polytomousmodel (hypothetically the 3PNL model) would outperform the bestfitting dichotomous model (hypothetically the 3PL model) in terms oftest reliability.2.3.2. Binary IRT models1-4PL models were fitted using the R package ‘mirt’ (Chalmers,2012). The models were compared using various methods, includingthe corrected Akaike Information Criterion (AICc) – a lower statisticrepresenting a better fit – Likelihood Ratio Tests, and M2–based indicators of Goodness-of-Fit (Maydeu-Olivares, 2013). These indicatorsincluded the Comparative Fit Index (CFI) and Tucker-Lewis Index (TLI)with cut-offs of 0.95, the Standardized Root Mean Square Residual(SRMR) with a cut-off of 0.08, and the Root Mean Square Error ofApproximation (RMSEA) with a cut-off of 0.06.In addition, we computed the estimates of empirical reliability fromthe IRT test information functions (Raju, Price, Oshima, & Nering,2007). Empirical reliability corresponds to the expected reliability inthe sample distribution of the θ scores, as estimated through the IRTmodels. We also computed marginal reliability estimates, which aretypically used in conjunction with empirical reliability estimates (e.g.,Myszkowski & Storme, 2017), and correspond to the expected reliability in an (assumed) normal prior density of θ.2. Method2.1. ParticipantsThe sample was composed of a total of 499 undergraduate studentsof a French business school. All participants – 214 males and 285 females, aged between 19 and 24 (M 20.7, SD 0.93) – were Frenchspeakers. They responded the SPM-LS individually and on a voluntarybasis. The SPM-LS and basic demographic questions were all presentedon computer. The participants received no compensation for participation, and had received no previous introduction to or training inintelligence research or psychometrics.2.3.3. Polytomous IRT modelsPolytomous models of the correct responses and the distractor responses have the disadvantage of being considerably more parametrized than binary models – for the reason that they model here 8probabilities per item, while binary IRT models only model two.Therefore, although a unique convergent solution was still found for thenominal models, M2 –based indicators of Goodness-of-Fit failed to becomputed because of the lack of degrees of freedom. However, thenominal models could still be compared with one another using thecorrected Akaike Information Criterion (AICc), and, for the nestedmodels, with Likelihood Ratio Tests (LRT). Additionally, we comparedthe 3PNL models with their binary counterparts (3PL). Because they donot fit the same manifest variables, their fit could not be compared, but2.2. InstrumentThe SPM-LS is composed of the last series of the StandardProgressive Matrices (Raven, 1941). This last series is the series of thetest has the expected highest overall difficulty of the SPM, and it iscomposed of 12 items of increasing difficulty. Each item is an incomplete 3 3 matrix of non-verbal stimuli, which are related by logical rules. The last of the 9 stimuli is left blank, and the examinee is toidentify the missing stimulus among 8 possible answers – 1 correct and7 distractors. To do so, the participant has to be able to identify the111
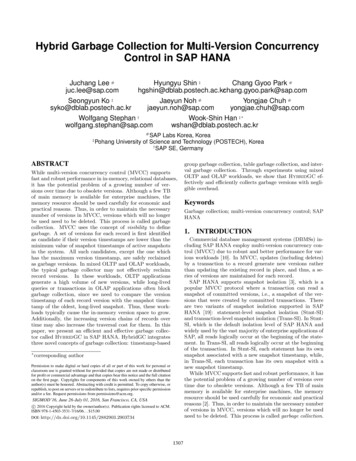
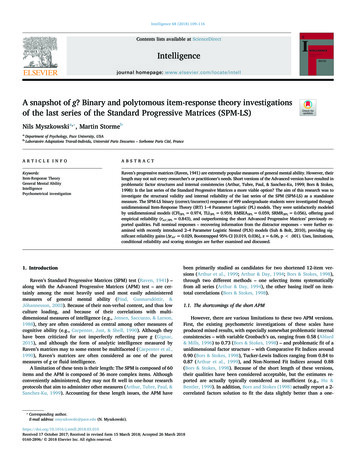
Intelligence 68 (2018) 109–116N. Myszkowski, M. Storme65Eigenvalue43Observed Factors2Simulated Factors (Parallel Analysis)10123456789101112FactorFig. 1. Scree plot of the exploratory factor analysis (with parallel analysis).and the 2PL (χ2 69.979, df 12, p .001) models. The LikelihoodRatio Test suggested that the 4PL fit only marginally better than the 3PL(χ2 20.909, df 12, p .052). A lower AIC for the 3PL led us tofurther use the 3PL as the best fitting model, but it should be noted thatoverall, the differences in goodness of fit between the 3PL and 4PL werevery minimal.As hypothesized, the SPM-LS with showed satisfactory empiricalreliability (empirical rxx′,3PL 0.843, Bootstrapped 95% CI [0.828,0.861]). The marginal reliability estimate for the 3PL model indicatesthat observations from an assumed normal prior distribution produceoverall reliable estimates (marginal rxx′,3PL 0.829, Bootstrapped 95%CI [0.812, 0.841]).their estimates of empirical and marginal reliability can be (Bock,1972). To infer on reliability gains, in the absence of a prescribed test,we computed basic bootstrapped confidence intervals – based on caseresampling – and bootstrapped Wald’s z tests of the reliability gains.Finally, to compare the scoring strategies resulting from the differentmodels, we inspected scatterplots of the relations between sum scores,CFA factor scores, and the factor scores of all IRT models using JASP(JASP Team, 2018).3. Results3.1. CTT analysesThe EFA produced mixed results in terms of dimensionality: TheParallel Analysis indicated to retain 5 factors, while only the first factorhad an eigenvalue above 1. Further, as can be seen on the scree plotpresented in Fig. 1, a drop in eigenvalues was observed between thefirst factor (with an eigenvalue of 5.92) and the other factors (eigenvalues of 0.97 and below). Finally, the loadings on factors 2 to 5 did notappear interpretable. The unidimensional model tested through CFAindicated a borderline acceptable structural validity (CFI 0.945,TLI 0.933, RMSEA 0.079, SRMR 0.108, WRMR 1.50).Moreover, the SPM-LS had satisfactory reliability estimates, with aCronbach’s α of 0.92, and a McDonald’s unidimensionality estimate ofωh of 0.86. Overall, although not meeting every expectation, these indices compare advantageously to the indices that have been reportedfor the short APM (Arthur & Day, 1994; Bors & Stokes, 1998). Further,these results lead us to proceed to IRT analyzes assuming the structureof the SPM-LS to be essentially unidimensional.3.3. Polytomous IRT analysesThe tested polytomous models being too heavily parametrized, theirM2 goodness of fit indices could not be computed. They could howeverbe compared with each other through Likelihood Ratio Tests. As hypothesized, the 3PNL model appeared to fit the best the nominal data,with a significantly better fit than the Nominal Response Model(χ2 142.333, df 12, p .001) and the 2PNL model (χ2 65.295,df 12, p .001). The 4PNL model did not fit the data significantlybetter than the 3PNL model (χ2 19.410, df 12, p .08). Thecomparison of AICc for the different models also supported this conclusion. The Item Characteristic Curves of the 3PNL model are presented on Fig. 2.The 3PL and the 3PNL models being the best fitting models for respectively the dichotomous and the nominal responses, we comparedtheir reliability estimates to compare the two approaches. As hypothesized, the information from distractors recovered by the 3PNLmodel allows to obtain more reliable θ estimates in the low abilitydomain, with an empirical reliability of 0.864 (Bootstrapped 95% CI[0.851, 0.889]), and a marginal reliability of 0.853 (Bootstrapped 95%CI [0.843, 0.873]). A significant gain in reliability – both empirical(Δrxx′ 0.029, Bootstrapped 95% CI [0.019, 0.036], z 6.06,p .001) and marginal (Δrxx′ 0.024, Bootstrapped 95% CI [0.020,0.041], z 5.63, p .001) – was achieved through the use of the3PNL model. The plot presented in Fig. 3 presents the reliability3.2. Binary IRT analysesThe absolute fit indices for the IRT binary models, as well as theirestimates of empirical and marginal reliability, are reported in Table 1.As hypothesized, the 3PL and 4PL had an satisfactory fit to the data.Further, the 3PL model had the best fit, in both the goodness-of-fit indices and the Likelihood Ratio Tests – the 3PL model presenting asignificantly better fit that the 1PL (χ2 182.653, df 23, p .001)112
Intelligence 68 (2018) 109–116N. Myszkowski, M. StormeTable 1Dichotomous IRT fit indices and empirical reliability of the SPM-LS.Modelχ2dfCFITLISRMRRMSEAAICcEmpirical reliabilityMarginal reliability1PL . CFI, Comparative Fit Index; TLI, Tucker-Lewis Index; SRMR, Standardized Root Mean Square Residual; RMSEA, Root Mean Square Error of Approximation;AICc, Akaike Information Criterion (corrected).differences of the two approaches as a function of θ. It shows that thegain in reliability is essentially found in low to average ability – inreference to our sample.Related to this point, we can observe on Fig. 4, which presents thecorrelations between the various scoring strategies, that, in spite ofnearly perfect correlations between the scores of the different scoringmethods, the Nested Logit Models provide different estimations that theother methods in the low ability levels.the Advanced Progressive Matrices (Arthur et al., 1999; Bors & Stokes,1998).IRT modeling advances offer interesting possibilities in the investigation and scoring of ability measures. An important advance forthe modeling of responses to multiple-choice items – which the SPMand APM are composed of – is the possibility to recover informationfrom distractor responses through the modeling of the full polytomousresponses (Bock, 1972), rather than the dichotomized pass-fail responses. The literature highlights two modeling approaches corresponding to different problem solving processes: Nominal ResponseModels (Bock, 1972) – in which distractors responses and the correctresponse are modeled on the same level, and thus considered as allcompeting in the solving process – and Nested Logit Models (Suh & Bolt,2010) – in which responses of distractors are modeled separately fromthe correct response, representing situations where the distractors areconsidered only when the initial problem-solving strategy failed.In the case of Raven’s matrices, both are certainly conceivable: Arespondent could either compare all potential responses directly, basedon their “fit” with the matrix – a process for which the NRM would beappropriate – or start by trying to extract a rule in the matrix and applyit to find the correct response, and, should this fail, proceed to acomparison strategy – a process for which the Nested Logit Models4. DiscussionFirst investigated with CTT-based methods for the sake of comparability, the reliability indices and fit indices of a unidimensional CFAcompared advantageously to the indices that have been previously reported for the short APM (Arthur & Day, 1994; Bors & Stokes, 1998).While we argue that these investigations are not appropriate models forthe responses at the SPM-LS, they still suggest that the SPM-LS presentsbetter psychometrical qualities in than the short APMs, regardless of thepsychometrical framework used.Investigated through IRT models, the SPM-LS presented adequatestructural validity, and a strong reliability – outperforming reliabilityand structural validity estimates previously reported for short forms ofFig. 2. Item characteristic curves of the best fitting (3PNL) model.113
Intelligence 68 (2018) 109–116N. Myszkowski, M. Storme1.00Conditional Reliability0.750.500.250.00 4 20θ243 Parameter Logistic Model (Dichotomous responses)3 Parameter Nested Logistic Model (Polytomous responses)Fig. 3. Gain in reliability from recovering distractor response information.Furthermore, the estimates presented in this study are dependent uponthe sample, and the psychometric qualities observed in this sample needfurther replication. For these reasons, we recommend that this study bereplicated on a variety of samples, using other sampling strategies –especially random sampling from the general population.In addition, this research suggests that the dimensionality of theSPM-LS should be further investigated (or strengthened). Indeed, although the results of the EFA and CFA indicated mixed results, andsuggest that the SPM-LS may not be a purely unidimensional measure.We recommend that the SPM-LS be investigated in larger samples tofurther the investigation of its dimensionality.Also, it is important to point out that only internal reliability andfactor structure were investigated in this study. We thus suggest thatfurther studies investigate other important psychometrical qualitiessuch as test-retest reliability and concurrent validity – which was donefor the short APMs. So far, the concurrent validity and test-retest reliability of the SPM-LS can only be inferred from those of the originalSPM, which is obviously insufficient. Related to this point, a limitationof this study is the lack of a comparison between the full length SPMand the SPM-LS. The SPM-LS was here investigated as a standalone test,which prevents the SPM-LS responses analyzed from being potentiallycontaminated by responding the first 4 series of the SPM, but alsoprevents an actual comparison between the two tests. Thus, it is impossible from this study to
1.3. Studying binary responses with IRT Because each incomplete matrix has only one correct answer and no answer considered partially correct, the typical scoring of the SPM is a count of correct answers. In other words, the categorical responses are dichotomized into pass/fail (0/1) binary responses. One of the most