Transcription
machine learning with scikit-learn1Machine Learning and scikit-learnlearning from dataabout scikit-learn2Working with datasetsclusteringdimension reductionnearest neighborsregression and cross validationfeature selectionMCS 507 Lecture 26Mathematical, Statistical and Scientific SoftwareJan Verschelde, 11 March 2022Scientific Software (MCS 507)machine learning with scikit-learnL-2611 March 20221 / 33
machine learning with scikit-learn1Machine Learning and scikit-learnlearning from dataabout scikit-learn2Working with datasetsclusteringdimension reductionnearest neighborsregression and cross validationfeature selectionScientific Software (MCS 507)machine learning with scikit-learnL-2611 March 20222 / 33
learning from experienceA popular quote from computer scientist Tom Mitchell:DefinitionA program can be said to learn from experience Ewith respect to some class of tasks T and performance measure P,if its performance at tasks in T , as measured by P,improves with experience E.Example: classifying pictures of dogs and cats.The quote above is taken from the following book:Gavin Hackeling: Mastering Machine Learning with scikit-learn. Applyeffective learning algorithms to real-world problems using scikit-learn.Packt publishing, 2014.Scientific Software (MCS 507)machine learning with scikit-learnL-2611 March 20223 / 33
supervised and unsupervised learningWe distinguish between two types of machine learning:Supervised learning:given are labeled inputs and outputs,the program learns from examples of the right answers.Unsupervised learning:the program does not learn from labeled data.Two most common supervised machine learning tasksare classification and regression.Examples of unsupervised learningare clustering and dimensionality reduction.Scientific Software (MCS 507)machine learning with scikit-learnL-2611 March 20224 / 33
machine learning with scikit-learn1Machine Learning and scikit-learnlearning from dataabout scikit-learn2Working with datasetsclusteringdimension reductionnearest neighborsregression and cross validationfeature selectionScientific Software (MCS 507)machine learning with scikit-learnL-2611 March 20225 / 33
about scikit-learn import sklearn help(sklearn)Machine learning module for Python sklearn is a Python module integrating classical machinelearning algorithms in the tightly-knit world of scientificPython packages (numpy, scipy, matplotlib).It aims to provide simple and efficient solutions to learningproblems that are accessible to everybody and reusable invarious contexts: machine-learning as a versatile tool forscience and engineering.See http://scikit-learn.org for complete documentation.Scientific Software (MCS 507)machine learning with scikit-learnL-2611 March 20226 / 33
history of the projectFrom the scikit-learn-docs pdf (2,503 pages):This project was started in 2007 as a Google Summer of Codeproject by David Cournapeau. Later that year, Matthieu Brucherstarted work on this project as part of his thesis.In 2010 Fabian Pedregosa, Gael Varoquaux, Alexandre Gramfortand Vincent Michel of INRIA took leadership of the project andmade the first public release, February the 1st 2010.F. Pedregosa, G. Varoquaux, A. Gramfort, V. Michel, B. Thirion,O. Grisel, M. Blondel, P. Prettenhofer, R. Weiss, V. Dubourg,J. Vanderplas, A. Passos, D. Cournapeau, M. Brucher, M. Perrot, andE. Duchesnay Scikit-learn: Machine Learning in Python.Journal of Machine Learning Research 12: 2825-2830, 2011.Scientific Software (MCS 507)machine learning with scikit-learnL-2611 March 20227 / 33
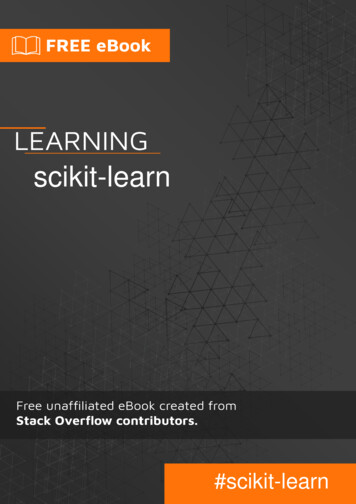
the stack (as of 2015)picture from the slides of Jake VanderPlasScientific Software (MCS 507)machine learning with scikit-learnL-2611 March 20228 / 33
machine learning with scikit-learn1Machine Learning and scikit-learnlearning from dataabout scikit-learn2Working with datasetsclusteringdimension reductionnearest neighborsregression and cross validationfeature selectionScientific Software (MCS 507)machine learning with scikit-learnL-2611 March 20229 / 33
the iris dataset from sklearn import datasets iris datasets.load iris() type(iris) class ’sklearn.utils.Bunch’ print(iris.DESCR). iris dataset:Iris plants dataset-------------------The data set comes from 1936 paper of Fisher on the iris plant.The iris is a classic in the field of pattern recognition.Scientific Software (MCS 507)machine learning with scikit-learnL-2611 March 202210 / 33
examining the data data iris.data type(data) class ’numpy.ndarray’ data.shape(150, 4) ydata iris.target type(ydata) class ’numpy.ndarray’ ydata.shape(150,) import numpy as np np.unique(ydata)array([0, 1, 2])Scientific Software (MCS 507)machine learning with scikit-learnL-2611 March 202211 / 33
three clusterscopied from the scikit-learn-docsScientific Software (MCS 507)machine learning with scikit-learnL-2611 March 202212 / 33
application of the k-means algorithm from sklearn import cluster k means cluster.KMeans(n clusters 3) k means.fit(data)KMeans(algorithm ’auto’, copy x True,init ’k-means ’, max iter 300,n clusters 3, n init 10, n jobs None,precompute distances ’auto’,random state None, tol 0.0001,verbose 0) print(k means.labels [::10])[1 1 1 1 1 2 2 2 2 2 0 0 0 0 0] print(ydata[::10])[0 0 0 0 0 1 1 1 1 1 2 2 2 2 2]Scientific Software (MCS 507)machine learning with scikit-learnL-2611 March 202213 / 33
on the number of clustersGetting the number of clusters is a different problem.The exercise below asks you to examine the sensitivityof the output to different number of clusters.Exercise 1:Apply the k-means algorithm to the iris data setfor n clusters equal to 2 and 4.Compare the outcome with n clusters 3.Assuming no prior knowledge of the data set, how would youconclude that 3 is the correct number of clusters?Scientific Software (MCS 507)machine learning with scikit-learnL-2611 March 202214 / 33
machine learning with scikit-learn1Machine Learning and scikit-learnlearning from dataabout scikit-learn2Working with datasetsclusteringdimension reductionnearest neighborsregression and cross validationfeature selectionScientific Software (MCS 507)machine learning with scikit-learnL-2611 March 202215 / 33
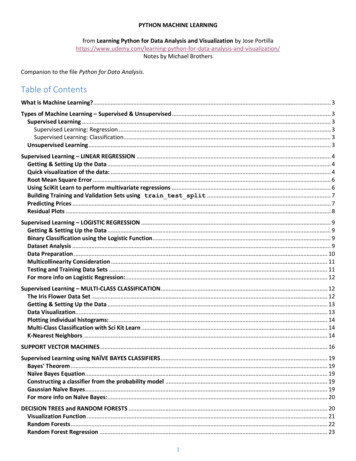
dimension reductionTo plot the 4-dimensional data of the iris data set,we can use PCA (Principal Component Analysis).The code comes from page 149 on the book by Hackeling.from sklearn.decomposition import PCAfrom sklearn.datasets import load irisdata load iris()y data.targetX data.data# dimension reductionpca PCA(n components 2)reduced X pca.fit transform(X)Scientific Software (MCS 507)machine learning with scikit-learnL-2611 March 202216 / 33
assemble and plot the reduced datared x, red y [], []blue x, blue y [], []green x, green y [], []for i in range(len(reduced X)):if y[i] 0:red x.append(reduced X[i][0])red y.append(reduced X[i][1])elif y[i] 1:blue x.append(reduced X[i][0])blue y.append(reduced X[i][1])else:green x.append(reduced X[i][0])green y.append(reduced X[i][1])Scientific Software (MCS 507)machine learning with scikit-learnL-2611 March 202217 / 33
plotting with matplotlibimport matplotlib.pyplot as pltplt.scatter(red x, red y, c ’r’, marker ’x’)plt.scatter(blue x, blue y, c ’b’, marker ’D’)plt.scatter(green x, green y, c ’g’, marker ’.’)plt.show()Scientific Software (MCS 507)machine learning with scikit-learnL-2611 March 202218 / 33
the two dimensional plotSuch a plot may help at determining the number of clusters.Scientific Software (MCS 507)machine learning with scikit-learnL-2611 March 202219 / 33
machine learning with scikit-learn1Machine Learning and scikit-learnlearning from dataabout scikit-learn2Working with datasetsclusteringdimension reductionnearest neighborsregression and cross validationfeature selectionScientific Software (MCS 507)machine learning with scikit-learnL-2611 March 202220 / 33
the setup from sklearn import datasetsimport numpy as npiris datasets.load iris()iris X iris.datairis y iris.targetnp.random.seed(0)indices np.random.permutation(len(iris X))iris X train iris X[indices[:-10]]iris y train iris y[indices[:-10]]iris X test iris X[indices[-10:]]iris y test iris y[indices[-10:]]Scientific Software (MCS 507)machine learning with scikit-learnL-2611 March 202221 / 33
running the classification algorithm from sklearn.neighbors import KNeighborsClassifier knn KNeighborsClassifier() knn.fit(iris X train, iris y train)KNeighborsClassifier(algorithm ’auto’, leaf size 30,metric ’minkowski’, metric params None,n jobs None, n neighbors 5, p 2,weights ’uniform’)Scientific Software (MCS 507)machine learning with scikit-learnL-2611 March 202222 / 33
predicting and verification knn.predict(iris X test)array([1, 2, 1, 0, 0, 0, 2, 1, 2, 0]) iris y testarray([1, 1, 1, 0, 0, 0, 2, 1, 2, 0]) Scientific Software (MCS 507)machine learning with scikit-learnL-2611 March 202223 / 33
machine learning with scikit-learn1Machine Learning and scikit-learnlearning from dataabout scikit-learn2Working with datasetsclusteringdimension reductionnearest neighborsregression and cross validationfeature selectionScientific Software (MCS 507)machine learning with scikit-learnL-2611 March 202224 / 33
the Boston house prices dataset from sklearn import datasets boston datasets.load boston() print(boston.DESCR)There are 506 instances with 13 attributes.The medial house value is usually the target.The data of D. Harrison and D.L. Rubinfeld of 1978 has been used inmany machine learning papers that address regression problems.Scientific Software (MCS 507)machine learning with scikit-learnL-2611 March 202225 / 33
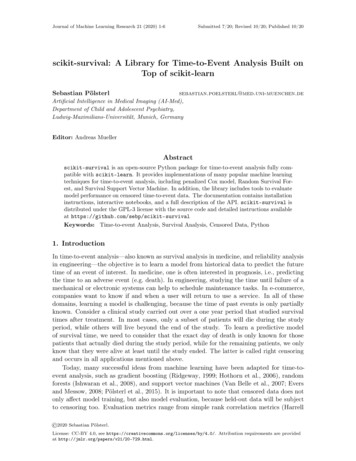
linear regressionFrom the scikit-learn-docs, section 5.21.1.from sklearn import datasetsfrom sklearn.model selection import cross val predictfrom sklearn import linear modelimport matplotlib.pyplot as pltlr linear model.LinearRegression()boston datasets.load boston()y boston.target# cross val predict returns an array of the same# size as ‘y‘ where each entry is a prediction# obtained by cross validationpredicted cross val predict(lr, boston.data, y, \cv 10)Scientific Software (MCS 507)machine learning with scikit-learnL-2611 March 202226 / 33
the plotting instructionsfig, ax plt.subplots()ax.scatter(y, predicted, edgecolors (0, 0, 0))ax.plot([y.min(), y.max()], [y.min(), y.max()], \’k--’, lw 4)ax.set xlabel(’Measured’)ax.set ylabel(’Predicted’)plt.show()Scientific Software (MCS 507)machine learning with scikit-learnL-2611 March 202227 / 33
visualization of predicted errorsScientific Software (MCS 507)machine learning with scikit-learnL-2611 March 202228 / 33
machine learning with scikit-learn1Machine Learning and scikit-learnlearning from dataabout scikit-learn2Working with datasetsclusteringdimension reductionnearest neighborsregression and cross validationfeature selectionScientific Software (MCS 507)machine learning with scikit-learnL-2611 March 202229 / 33
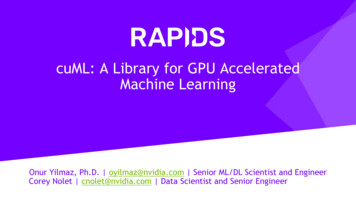
considering the boston dataset againFrom the scikit-learn-docs, by Manoj Kumar mks542@nyu.edu import matplotlib.pyplot as pltimport numpy as npfrom sklearn.datasets import load bostonfrom sklearn.feature selection import SelectFromModelfrom sklearn.linear model import LassoCV# Load the boston dataset.boston load boston()X, y boston[’data’], boston[’target’]Scientific Software (MCS 507)machine learning with scikit-learnL-2611 March 202230 / 33
feature selection# We use the base estimator LassoCV since# the L1 norm promotes sparsity of features.clf LassoCV(cv 5)# Set a minimum threshold of 0.25sfm SelectFromModel(clf, threshold 0.25)sfm.fit(X, y)n features sfm.transform(X).shape[1]# Reset the threshold till the number of features# equals two. Note that the attribute can be set# directly instead of repeatedly fitting# the metatransformer.while n features 2:sfm.threshold 0.1X transform sfm.transform(X)n features X transform.shape[1]Scientific Software (MCS 507)machine learning with scikit-learnL-2611 March 202231 / 33
plotting the selected two featuresplt.title("Features selected from Boston using SelectFromModel ""with threshold %0.3f." % sfm.threshold)feature1 X transform[:, 0]feature2 X transform[:, 1]plt.plot(feature1, feature2, ’r.’)plt.xlabel("Feature number 1")plt.ylabel("Feature number 2")plt.ylim([np.min(feature2), np.max(feature2)])plt.show()Scientific Software (MCS 507)machine learning with scikit-learnL-2611 March 202232 / 33
visualization of selected featuresScientific Software (MCS 507)machine learning with scikit-learnL-2611 March 202233 / 33
Machine learning module for Python sklearn is a Python module integrating classical machine learning algorithms in the tightly-knit world of scientific Python packages (numpy, scipy, matplotlib). It aims to provide simple and efficient solutions to learning problems that are accessible to everybody and reusable in various contexts: machine-learning as a versatile tool for science and .