Transcription
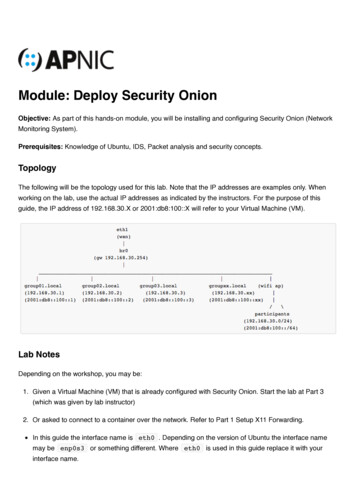
Module: Deploy Security OnionObjective: As part of this hands-on module, you will be installing and configuring Security Onion (NetworkMonitoring System).Prerequisites: Knowledge of Ubuntu, IDS, Packet analysis and security concepts.TopologyThe following will be the topology used for this lab. Note that the IP addresses are examples only. Whenworking on the lab, use the actual IP addresses as indicated by the instructors. For the purpose of thisguide, the IP address of 192.168.30.X or 2001:db8:100::X will refer to your Virtual Machine (VM).Lab NotesDepending on the workshop, you may be:1. Given a Virtual Machine (VM) that is already configured with Security Onion. Start the lab at Part 3(which was given by lab instructor)2. Or asked to connect to a container over the network. Refer to Part 1 Setup X11 Forwarding.In this guide the interface name is eth0 . Depending on the version of Ubuntu the interface namemay be enp0s3 or something different. Where eth0 is used in this guide replace it with yourinterface name.
Container detailsUbuntu 16.04 LTS/LXCHostname groupXX.apnictraining.netDomain name apnictraining.netIPv4 Address 192.168.30.xxIPv6 Address 2001:db8:100::xxxx group ID as allocated by the instructorLab Exercise - Security Onion setup and configurationPart 1. Setup X11 Forwarding for clientWindows 101. On the Windows machine. Download putty and y.org2. On the Windows machine. Download Xming and installhttps://sourceforge.net/projects/xming/3. Open Xming and allow firewall rules if prompted.4. Connect to the containerputty -ssh -X apnic@192.168.30.xx-X X11 forwarding .xx group number5. Confirm X11Forwarding is set to Yes in the /etc/ssh/sshd config file.cat /etc/ssh/sshd config grep X116. Confirm X11 forwarding is working.firefox https://www.apnic.netorchromium-browser https://www.apnic.net
MacOS1. On the MacOS machine. Download XQuartz and installhttps://support.apple.com/en-au/HT2013412. Connect to the containerssh -v -X apnic@192.168.30.xx-X X11 forwarding -v verbose .xx group number3. Confirm X11Forwarding is set to Yes in the /etc/ssh/sshd config file.cat /etc/ssh/sshd config grep X114. Confirm display settings.echo DISPLAY5. If display output is blank. Type the following:export DISPLAY "localhost:10.0"6. Confirm X11 forwarding is working.firefox https://www.apnic.netorchromium-browser https://www.apnic.netUbuntu1. Connect to the containerssh -v -X apnic@192.168.30.xx-X X11 forwarding -v verbose .xx group number2. Confirm X11Forwarding is set to Yes in the /etc/ssh/sshd config file.cat /etc/ssh/sshd config grep X113. Confirm X11 forwarding is working.
firefox https://www.apnic.netorchromium-browser https://www.apnic.netPart 2. Installation of Security Onion1. To install Security Onion via a package manager type the following commands:echo "debconf debconf/frontend select noninteractive" sudo debconf-set-selectionssudo apt-get updatesudo apt-get -y install software-properties-commonsudo add-apt-repository -y ppa:securityonion/stablesudo apt-get updatesudo apt-get -y install securityonion-all syslog-ng-coreNOTE: This should have already been completed on the container or Virtual Machine (VM).2. Run setup wizard, type the following:sudo sosetupNOTE: Do not complete these steps on the Virtual Machine (VM) as it has already been done. Insteadcheck the status of the Security Onion by typing sudo sostatus3. Click on Yes, Continue4. Click on Yes, configure /etc/network/interfaces5. Select static and click on Ok6. The next few screens will ask for details about the network:IP Address 192.168.30.XX (XX is group number)Subnet Mask 255.255.255.0Gateway IP 192.168.30.254 (Confirm with Instructor)DNS IP 1.1.1.1 192.168.30.249(Confirm with Instructor)Domain name apnictraining.net7. Click on Yes, make changes!8. Click on Yes, reboot!NOTE: May need to ask the instructor to stop and start the container9. After the reboot, reconnect to the container.
ssh -X apnic@192.168.30.XXorputty -ssh -X apnic@192.168.30.XX-X X11 forwarding -v verbose .xx group number10. restart the setup wizard. Type the following:sudo sosetup11. Click on Yes, Continue12. Click on Yes, skip network configuration!13. Evaluation mode will install all the tools onto the one virtual machine or container. Click onEvaluation Mode , then click on OK .14. Create a user account that will be used to log into Kibana, Squert and Sguil.username: apnicpassword: trainingNOTE: In a production environment, this should be a different account to what is used to log intoUbuntu15. Click on Yes, proceed with the changes! . This will take some time to complete as itdownloads and configures docker.16. Once installed, check the status of the Security Onion services by typing the following:sudo sostatus17. Test you can open Squert in a browser.chromium-browser https://localhost/squertorfirefox https://localhost/squertPart 3. Import Packet Capture File1. To view the list of sample packet captures that are available:cd /opt/samplesls
2. Import the fake av.pcap file:sudo so-replay fake av.pcapThis will import the pcap file as new traffic with the current date and time.After importing the packet capture file, we will have a look at the alerts that were generated by SNORT, byutilising a tool called SQUERT.1. To see a summary of the fake av.pcap file, type the following:capinfos fake av.pcap
Part 4. Investigate an Indicator of Compromise (IoC) using SQUERT1. To start the investigation, open SQUERT:firefox https://localhost/squertor double-click on the SQUERT icon on the desktop.
EVENTS page, shows a list of events that have occured.SUMMARY page, shows a list of the top signatures and the top source and destinations via IPaddress and countries.VIEWS page, uses a Sankey diagram to show the relationships between IP addresses, sourcecountry and destination country.2. Click on the SUMMARY pageLooking at the summary, we can see there may be a Command and Control Trojan (CnC) activityin the packet capture file.A lot of traffic is originating from an IP address of 172.16.150.20A lot of traffic is going to an IP address of 58.64.132.1413. Click on the VIEWS page.From this Sankey diagram, you can see that the IP address of 172.16.150.20 is indeed mainly
talking to the IP address of 58.64.132.141. But there is also a red line showing a relationship withan IP address of 66.32.119.384. Click on the EVENTS page. Apply a filter for the IP address of 66.32.119.38 to see if any events havebeen logged about this activity.From the output it certainly does look like an Indicator of Compromise (IoC) because a suspiciousfile was downloaded from the IP address of 66.32.119.38.Part 5. Investigate an Indicator of Compromise (IoC) using SGUIL1. To investigate further open sguil database to view the original logs and filter by the IP address of66.32.119.38 to get an idea of the time it occurred.2. To start the investigation, open SGUIL:sguil.tkor double-click on the SGUIL icon on the desktop.Make sure you select the interface ens33 before starting Squil as shown below:
3. Click on Query Query by IP , and type in the IP address of 66.32.119.38 , then click onSubmit to apply the filter.Select the Show Packet Data to view the raw data and Show Rule to look at the Snortrule that triggered the alert.
4. To view more details about the potential malicious file, do a ctrl right mouse click on the firstPE EXE or DLL event's Alert ID and click on Transcript :5. From this transcript you can see a document file name and can indeed see that there was anexecutable file that has potentially two file extensions ( .EXE and .DOC ) to try and fool the enduser into thinking it is a word document extension.
At this point you can extract the file for further analysis. NOTE: this file could be malicious and shouldonly be extracted on an isolated system.6. The file can be extracted by using WireShark or NetworkMiner. To use WireShark do actrl right mouse click on the first PE EXE or DLL event's Alert ID and click onWireShark .
7. After opening WireShark, right-mouse click on the first packet, scroll down to follow and click on TCPstream.This will piece all the packets together and display the ASCII contents in the packet.8. To extract the file, change the data type to RAW and click on Save as .
9. Once the file is extracted it is a matter of using your favourite tools to analyse for malware. A quick wayis to generate a hash of the extracted file and upload to tracker sites like Virus Total to see if the hashhas been seen before.
NOTE: This is a public service, do not upload files that may contain company sensitive material.Part 6. Review an Indicator of Compromise (IoC) using KibanaAnother tool, that comes with Security Onion worth a mention is Kibana. Kibana is an open source tool youcan use to query the Elasticsearch database and display the results visually in a dashboard.1. To open Kibana:firefox https://localhost/app/kibanaor double-click on the Kibana icon on the desktop.The malicious activity that was discovered above occurred around 3:43 GMT time. With thisinformation, we can now focus on this time.2. After opening Kibana, click on dashboard, restrict the time and date, and view events related to files.
And you can see that a file was downloaded during that time period.ConclusionSo in a short amount of time, using Security Onion you were able to analysis a packet capture for anIndicator of Compromise or malicious activity, extract a suspicious file and determine that the file wasindeed malicious.With more practice, you should find that Security Onion is a valuable resource when it comes to networkforensics and analysing packet captures, SNORT alerts and other ecurity-onion/wiki/IntroductionWalkthrough
Objective: As part of this hands-on module, you will be installing and configuring Security Onion (Network Monitoring System). Prerequisites: Knowledge of Ubuntu, IDS, Packet analysis and security concepts. The following will be the topology used for this lab. Note that the IP addresses are examples only. When


