Transcription
2019 CUPA- HRADMINISTR ATORS IN HIGHER EDUC ATION ANNUAL REPORTOverview2019 Administrators in HigherEducation Annual ReportCITATION FOR THIS REPORT:Pritchard, Adam; Li, Jingyun; McChesney, Jasper; and Bichsel, Jacqueline;(April 2019). Administrators in Higher Education Annual Report: Key Findings,Trends, and Comprehensive Tables for the 2018-19 Academic Year (ResearchReport). CUPA-HR. Available from https://www.cupahr.org/surveys/results/.i
2019 CUPA- HRADMINISTR ATORS IN HIGHER EDUC ATION ANNUAL REPORTAbout CUPA-HRCUPA-HR is higher ed HR. We serve higher education by providing theknowledge, resources, advocacy and connections to achieve organizationaland workforce excellence. Headquartered in Knoxville, Tennessee, andserving more than 31,000 HR professionals and other campus leaders atmore than 2,000 institutions, the association offers learning and professionaldevelopment programs, higher education workforce data, extensive onlineresources and just-in-time regulatory and legislative information.AuthorsAdam Pritchard, Ph.D., Senior Survey ResearcherJingyun Li, M.S., Survey ResearcherJasper McChesney, M.S., Data Visualization ResearcherJacqueline Bichsel, Ph.D., Director of ResearchCITATION FOR THIS REPORT:Pritchard, Adam; Li, Jingyun; McChesney, Jasper; and Bichsel, Jacqueline;(April 2019). Administrators in Higher Education Annual Report: Key Findings,Trends, and Comprehensive Tables for the 2018-19 Academic Year (ResearchReport). CUPA-HR. Available from https://www.cupahr.org/surveys/results/.2
2019 CUPA- HRADMINISTR ATORS IN HIGHER EDUC ATION ANNUAL REPORTCUPA-HR Data Use Agreement All survey results are copyrighted by the College and University Professional Associationfor Human Resources (CUPA-HR). No data contained in a survey report or obtained throughDataOnDemand (DOD) may be reproduced in any form for any purpose without the writtenconsent of CUPA-HR. Report findings and conclusions may be appropriately cited/referencedin other reporting if there is proper acknowledgment of the source and the referenced materialdoes not involve reproduction of data tables or graphics. DOD can be purchased only by higher education institutions. Due to the sensitive andconfidential nature of the data we collect, we reserve the right to confirm an individual’sauthorization to purchase DOD with his or her HR department, and to confirm with HR thateach user listed on the order is authorized to view employee data. Individuals outside ofthe HR department seeking access will need written approval from the head of HR — theseinclude faculty, unions, other administrators, etc. CUPA-HR accepts no responsibility for anyemployee who misrepresents his or her authorization. Annual survey reports contain comprehensive tables of aggregated data and may bepurchased by anyone. However, all points of this agreement apply to the use of this tabulardata. Survey results may not be changed or modified. Results may not be misrepresented as to theirsource or intent. Survey results may not be used to solicit or conduct business. The sole exception is the useof consultants who are currently engaged in a project with a higher ed institution that hasgranted access to that institution’s purchase of DOD. Consultants may use the obtained datain their business dealings with the purchasing institution only. Consultants cannot order DODdirectly. They should ask the appropriate representative of the institution for which they areworking to contact us — via research@cupahr.org — to request consultant access to DOD.The institution representative should furnish: (a) the consultant’s name, company, address,e-mail, and phone number; (b) a statement that indicates the consultant has been hired toperform work requiring the use of CUPA-HR data; (c) authorization for the consultant to see theinstitution’s data; and (d) the names of the surveys to which the consultant should be grantedaccess. Survey results may not be uploaded to a separate system or placed on the web without theexplicit permission of CUPA-HR. Access to survey reports and DOD is limited to the users purchasing the report or subscription.Sharing report information, log-in credentials, output from DOD analyses, or DOD accesswith other institutions or organizations will result in immediate cancellation of access and willpreclude future access. The system tracks and monitors purchases, use, and users. An institution is defined as an entity which has as its sole purpose the provision ofpostsecondary education and reports to the Integrated Postsecondary Education DataSystem (IPEDS) hosted by the National Center for Education Statistics (NCES). Results mustbe purchased for each institution in which CUPA-HR data is used and may only be used forthe institution for which the subscription was purchased. Results may not be shared with — orused for — institutions within a multi-institution system for which a DOD subscription or annualreport has not been purchased. System offices, defined as any entity that oversees two ormore institutions, may share or use data only with institutions in their system for which the datahas been purchased.3
2019 CUPA- HR4ADMINISTR ATORS IN HIGHER EDUC ATION ANNUAL REPORTContentsAbout CUPA-HR 2Authors 2Citation for This Report 2CUPA-HR Data Use Agreement 3Contents 4Highlights 5Introduction 6Positions Surveyed 6Participating Institution Characteristics 7Trends in Salary IncreasesA LL SE C TI O N SAcademic DeansDeansAVAI L AB LE INAssociate/Assistant DeansThe Demographic Makeup of Higher EdAdministratorsThe Representation and Pay of Women and Racial/Ethnic MinoritiesRepresentation and Pay of Women and Racial/Ethnic Minoritiesin Top-Level Administrative PositionsRepresentation and Pay of Women and Racial/Ethnic Minoritiesin Dean PositionsAge and Years in PositionExecutive BenefitsMethodology 8Survey 8Administrator Positions 8Institutional Characteristics 8Respondents 9Acknowledgments 10Appendix A. Comprehensive Tables 11Appendix B. Participating Institutions 14F U LL R E P O R T
2019 CUPA- HRADMINISTR ATORS IN HIGHER EDUC ATION ANNUAL REPORTHighlightsThe following are highlighted results from the CUPA-HR 2019Administrators in Higher Education Annual Report: Administrator salaries increased by 2.7% for the 2018-19 academic year.The highest raises went to senior institutional officers (2.8%), and thelowest went to top executives (2.0%) and associate/assistant deans (2.0%).Women continue to make up about half (51%) of all administrators,the same as last year, and the percentage of racial/ethnic minorityadministrators has risen slightly to 16% this year, up from 15% last year.Women make up nearly half (47%) of the five lowest-paid dean positionscombined (each earning a median of 125K or less) and make up onlyone-fifth (20%) of the top five highest-paid dean positions combined(each earning a median of 249K or more).About two-thirds (65%) of associate/assistant deans also have facultystatus, earning higher salaries than those without faculty status in all butseven disciplines.Some top administrative roles, such as Chief Diversity Officer, employa large proportion of Black and Hispanic women (52%), whereas otherpositions, such as Chief Facilities Officer, are overwhelmingly occupiedby White men (83%).Among academic deans, women of color are sometimes compensatedmuch less than or much more than their White male counterparts,depending on their discipline.The median age for higher education administrators is 54 years old, andnearly 9 in 10 administrators are between the ages of 40 and 70.The number of institutions offering performance-based incentivesincreased this year, and fewer institutions are now offering deferredcompensation as an executive benefit.5
2019 CUPA- HRADMINISTR ATORS IN HIGHER EDUC ATION ANNUAL REPORTIntroductionThis marks CUPA-HR’s 52nd year of data collection on higher educationadministrators, the longest-running of CUPA-HR’s surveys. Theadministrators survey collects data on salaries and demographics, andsince 2016-17 has done so for each individual incumbent instead of inaggregate, allowing for more in-depth analysis and allowing more precisebenchmarking than ever before. Data collected includes: salary, sex, race/ethnicity, age, years in position, and faculty status (for associate/assistantdeans). Highlights of this salary and demographic data are included in thisreport.Positions SurveyedA total of 50,880 administrators were reported for this year’s survey.1 The 200positions surveyed are grouped into six administrative categories:2 Top Executive Officers Includes Chief Executive Officer (Campus or System) and ExecutiveVice President/Vice Chancellor.Senior Institutional Officers Persons in these positions direct a major functional area withinstitution-wide scope/impact as well as the work of other professionalemployees.Academic Deans Persons with faculty status who serve as the principal administrator/head of an academic program, which may be a school, college, ordepartment.Institutional Administrators Persons in these positions direct a major functional area withinstitution-wide scope/impact as well as the work of other professionalemployees. They serve as the senior content expert in a recognizedprofessional realm.Heads of Divisions, Departments, and Centers Persons in these positions direct an institutionally recognizeddivision, department, or center and the work of other professionalemployees.Academic Associate/Assistant Deans Persons with or without faculty status who report to and support thedean in the administration of an institutional program, which may bea school, college, or department.1See the Methodology section of this report for more specific information on the sample and thedata collected.2See the Administrators Survey Participation and Information Template (SPIT) for descriptions of allpositions surveyed.6
2019 CUPA- HR7ADMINISTR ATORS IN HIGHER EDUC ATION ANNUAL REPORTParticipating Institution CharacteristicsThe information in Figure 1 summarizes the institutional characteristicsof respondents to this year’s Administrators in Higher Education Survey.A total of 1,174 institutions provided incumbent-level data for 50,880administrators.3 Institutions are well represented in this year’s data byclassification, affiliation, and region.2 0 1 9 A D M I N I S T R AT O R S I N H I G H E R E D U C AT I O NAdministrators Survey 8339108Master'sDoctoralBaccalaureateAssociate’s Special Focus/OtherA FFI LI AT I O NPrivateIndependent264329SystemOfficeR EG I O st261345South 1 International InstitutionFigure 13See Appendix B for a list of all participating institutions. System offices provided data for systemlevel positions, which are integrated into the analysis for this report. For-profit institutions, highered affiliates, and international institutions were excluded from the analysis. See the Methodologysection for more detail on these exclusions.Specia
2019 CUPA- HRADMINISTR ATORS IN HIGHER EDUC ATION ANNUAL REPORTMethodologySURVEYThe data collection period for CUPA-HR’s Administrators in HigherEducation Survey ran from November 1, 2018 through January 18, 2019. Thesurvey was conducted through Surveys Online.4Administrator PositionsThis year’s survey includes data for 50,880 administrators.5 For eachadministrator incumbent, the following data were collected: Annualized base salary (effective date November 1, 2018)Sex (optional)Race/ethnicity (optional)Year entered current position (optional)Birth year (optional)Whether the administrator has faculty status (for associate/assistant deanpositions only)Participants could either enter this data manually online for each incumbentor upload a file containing this data.Institutional CharacteristicsIn addition, data on institutional characteristics were collected from allparticipants:6 Total expenses reported to IPEDS in 2017-18Student enrollment (effective date approximately October 15, 2018)Faculty size (effective date November 1, 2018) and number of separationsin the past yearStaff size (effective date November 1, 2018) and number of separations inthe past yearHuman resources staff size and number of separations in the past yearCHRO reporting relationshipWhether collective bargaining exists for the following groups: Full-time faculty Part-time or adjunct faculty Full-time staff Graduate students4Surveys Online is a product of Peerfocus.5This report analyzes data from 50,425 administrators, as data from for-profit institutions, non-U.S.institutions, and higher ed affiliates were excluded.6See the Administrators Survey Participation and Information Template (SPIT) for more specificinformation about the data collected on this year’s survey, as well as the instructions provided toparticipants.8
2019 CUPA- HR9ADMINISTR ATORS IN HIGHER EDUC ATION ANNUAL REPORTBasic information on total expenses as well as student, faculty, and staff sizewere required questions. All other questions were optional.RESPONDENTSRespondents were largely human resources professionals and institutionalresearch professionals from higher education institutions in the U.S.7 Therewere 1,174 institutions that completed the survey (Table 5). All participatinginstitutions are listed in Appendix B.Table 5. Number of Responding Institutions by Classification and ureateAssociate’sSpecial Focus/OtherSystem OfficeTotal ParticipantsTotal N for This it institutions (n 11), higher ed affiliates (n 6), and international institutions (n 1) wereexcluded from the analyses in this report. Although their data were not analyzed for this report, theirdata are available for benchmarking in DataOnDemand, and their names appear in the participantlist in Appendix B. They are included as “Other” institutions in the table above.
2019 CUPA- HRADMINISTR ATORS IN HIGHER EDUC ATION ANNUAL REPORTAcknowledgmentsCUPA-HR’s Administrators in Higher Education Report provides data onsalaries and demographic information for administrators employed in across-section of the nation’s colleges and universities.We are indebted to the human resources professionals and institutionalresearch professionals of the colleges and universities who completed thesurvey.In the CUPA-HR national office, our research department staff coordinatedand reviewed all aspects of survey analysis and report production. Toensure the accuracy of data, the research staff conducted numerousoutlier and validation checks with those responsible for completing thesurvey. Peerfocus, Inc., our partner and collaborator in Surveys Online,provided web-based data collection, automated validation checks, andtable generation. This report was designed, reviewed, edited, and marketedby members of our research, communications, and executive teams,acknowledged below.CUPA-HR RESEARCH STAFFJacqueline Bichsel, Ph.D.Adam Pritchard, Ph.D.Jasper McChesney, M.S.Suzi Bowen, M.A.Director of ResearchSenior Survey ResearcherData Visualization ResearcherResearch Operations ManagerCUPA-HR COMMUNICATIONS STAFFGayle KiserMissy KlineErin RosolinaJeremy LongmireDirector of Communications and MarketingContent ManagerMarketing ManagerSr. Graphic Designer and Website CoordinatorCUPA-HR EXECUTIVE REVIEWERSAndy Brantley President and Chief Executive OfficerRob Shomaker Vice President and Chief Operating Officer10
2019 CUPA- HRADMINISTR ATORS IN HIGHER EDUC ATION ANNUAL REPORTAppendix A. ComprehensiveTablesThe salaries provided in these tables are annualized base salaries. Thetables in this appendix report unweighted median salaries.8 The mediandivides salaries in half: 50% of all reported salaries fall above or below thissalary. The median is a more reliable measure than the mean (average) indistributions that are skewed (containing a few extremely low or — in thecase of most salary data — high numbers).Data are reported only for positions having at least five respondinginstitutions.9To compute the quartiles, the total expense/enrollment numbers reportedby each institution were ranked from low to high, and one quarter of theinstitutions were assigned to each quartile. Quartile ranges are listed in thecolumn headings of each applicable table.Some of the tables also report salary data by percentile rank. To computepercentiles, each institution’s average salary is counted once, ranked fromlow to high and then split at the following points: 20th percentile: 20% of all reported salaries are equal to or fall below thisvalue40th percentile: 40% of all reported salaries are equal to or fall below thisvalue50th percentile: 50% of all reported salaries are equal to or fall below thisvalue60th percentile: 60% of all reported salaries are equal to or fall below thisvalue80th percentile: 80% of all reported salaries are equal to or fall below thisvalue8The tables in Appendix A provide a large-scope picture of administrator salaries. To benchmarksalaries using custom comparison groups, or to view salaries by sex, race/ethnicity, age, or years inposition, higher ed institutions should subscribe to DataOnDemand.9Both annual reports and DataOnDemand follow Department of Justice safe harbor guidelines forantitrust regulations. An explanation of these guidelines can be found here:http://compforce.typepad.com/compensation force/2007/02/antitrust regul.html.11
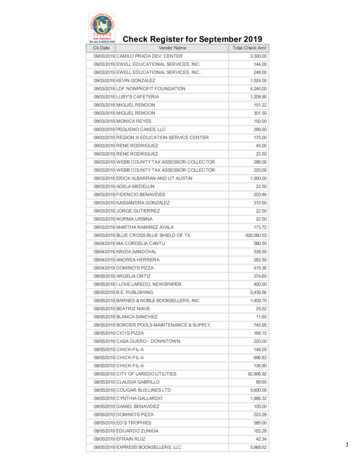
2019 CUPA- HRADMINISTRATORSIN HIGHEREDUCATIONADMINISTR ATORSIN HIGHER EDUC ATIONANNUALREPORT ANNUAL REPORTComprehensive Tables Median SalariesGENER ALBY E XPENSE QUAR TILEBY ENROLLMENT QUAR TILEInstitutional VariablesAffiliationClassificationCensus RegionDemographic VariablesSexMinority StatusOverallAll InstitutionsAffiliationPublicAll PrivatePrivate IndependentPrivate eAssociate'sOverallAll InstitutionsAffiliationPublicPrivate IndependentPrivate 60A64A68A72TA B LE SAVAI L AB LE INF U LL R E P O R TA212
20192019 CUPACUPA-HRHR ADMINISTR ATORSIN HIGHER EDUC INATIONANNUALREPORTANNUAL REPORTADMINISTRATORSHIGHEREDUCATIONComprehensive Tables Salary PercentilesBY INS TITUTION T Y PEBY E XPENSE QUAR TILEBY ENROLLMENT QUAR TILEOverallAll InstitutionsAffiliationPublicAll PrivatePrivate IndependentPrivate teAssociate'sA96A100A104A108QuartileQ1: 47.3MQ2: 47.3M– 96.7MQ3: 96.7M– 255.9MQ4: 255.9MA112A116A120A124QuartileQ1: 1,756Q2: 1,756–3,417Q3: 3,417–9,800Q4: 9,800A128A132A136A140A76A80A84A88A92TA B LE SAVAI L AB LE INF U LL R E P O R T13A3
2019 CUPA- HRADMINISTR ATORS IN HIGHER EDUC ATION ANNUAL REPORTAppendix B. ParticipatingInstitutions14
InstitutionA. T. Still University of Health SciencesAbilene Christian UniversityAdams State UniversityAdelphi UniversityAims Community CollegeAlbany Law SchoolAlbert Einstein College of MedicineAlbertus Magnus CollegeAlbion CollegeAlbright CollegeAlexandria Technical & Community CollegeAlfred UniversityAlice Lloyd CollegeAllegheny CollegeAllen CollegeAlliant International University President's OfficeAlma CollegeAlvernia UniversityAlverno CollegeAmerican Jewish UniversityAmerican Public University System (APUS)American UniversityAmherst CollegeAndrews UniversityAnne Arundel Community CollegeAnoka Technical CollegeAnoka-Ramsey Community CollegeAntioch University Central AdministrationAppalachian State UniversityArapahoe Community CollegeArcadia UniversityArizona State UniversityArkansas State University-JonesboroArkansas Tech UniversityArt Academy of CincinnatiAsbury UniversityAshford UniversityAshland Community and Technical CollegeAshland UniversityAssumption CollegeAthens State UniversityAuburn UniversityAuburn University at MontgomeryAugsburg UniversityAugusta UniversityAugustana CollegeAugustana UniversityAultman College of Nursing and Health SciencesAurora UniversityAustin CollegeAustin Community College DistrictAustin Peay State UniversityAve Maria School of LawAverett UniversityAvila UniversityAzusa Pacific UniversityBabson CollegeBaker College System OfficeBaker UniversityBall State UniversityBaptist College of Health SciencesBarnard CollegeBarry UniversityBates CollegeBay Path UniversityBaylor College of Medicine 2019 ureateSpecialSystem ciate'sAssociate'sSystem r'sDoctoralSpecialSystem BaccalaureateMaster'sSpecialAffiliationPrivate IndependentPrivate ReligiousPublicPrivate IndependentPublicPrivate IndependentPrivate IndependentPrivate IndependentPrivate ReligiousPrivate ReligiousPublicPrivate IndependentPrivate IndependentPrivate IndependentPrivate IndependentPrivate for-ProfitPrivate IndependentPrivate ReligiousPrivate IndependentPrivate IndependentPrivate for-ProfitPrivate ReligiousPrivate IndependentPrivate ReligiousPublicPublicPublicPrivate IndependentPublicPublicPrivate IndependentPublicPublicPublicPrivate IndependentPrivate IndependentPrivate for-ProfitPublicPrivate ReligiousPrivate ReligiousPublicPublicPublicPrivate ReligiousPublicPrivate ReligiousPrivate ReligiousPrivate IndependentPrivate IndependentPrivate ReligiousPublicPublicPrivate ReligiousPrivate IndependentPrivate ReligiousPrivate IndependentPrivate IndependentPrivate IndependentPrivate ReligiousPublicPrivate IndependentPrivate IndependentPrivate ReligiousPrivate IndependentPrivate IndependentPrivate IndependentAdministrators in Higher Education ParticipantsEntity TypeSingle Unit InstitutionSingle Unit InstitutionSingle Unit InstitutionSingle Unit InstitutionSingle Unit InstitutionSingle Unit InstitutionSingle Unit InstitutionSingle Unit InstitutionSingle Unit InstitutionSingle Unit InstitutionInstitution Within a SystemSingle Unit InstitutionSingle Unit InstitutionSingle Unit InstitutionSingle Unit InstitutionSingle Unit InstitutionSingle Unit InstitutionSingle Unit InstitutionSingle Unit InstitutionSingle Unit InstitutionSingle Unit InstitutionSingle Unit InstitutionSingle Unit InstitutionSingle Unit InstitutionSingle Unit InstitutionInstitution Within a SystemInstitution Within a SystemSystem OfficeInstitution Within a SystemInstitution Within a SystemSingle Unit InstitutionInstitution Within a SystemInstitution Within a SystemInstitution Within a SystemSingle Unit InstitutionSingle Unit InstitutionSingle Unit InstitutionInstitution Within a SystemSingle Unit InstitutionSingle Unit InstitutionSingle Unit InstitutionInstitution Within a SystemInstitution Within a SystemSingle Unit InstitutionInstitution Within a SystemSingle Unit InstitutionSingle Unit InstitutionSingle Unit InstitutionSingle Unit InstitutionSingle Unit InstitutionSingle Unit InstitutionInstitution Within a SystemSingle Unit InstitutionSingle Unit InstitutionSingle Unit InstitutionSingle Unit InstitutionSingle Unit InstitutionSystem OfficeSingle Unit InstitutionSingle Unit InstitutionSingle Unit InstitutionInstitution Within a SystemSingle Unit InstitutionSingle Unit InstitutionSingle Unit InstitutionSingle Unit InstitutionCensus heastSouthNortheastNortheastSouthB1
Baylor UniversityBeacon CollegeBellarmine UniversityBellevue CollegeBellin CollegeBelmont UniversityBemidji State UniversityBenedictine UniversityBennington CollegeBentley UniversityBerea CollegeBerry CollegeBethel CollegeBethel UniversityBethel UniversityBethlehem College & SeminaryBig Sandy Community and Technical CollegeBiola UniversityBismarck State CollegeBlack Hills State UniversityBlack River Technical CollegeBlessing-Rieman College of Nursing & Health ScienceBloomfield CollegeBloomsburg University of PennsylvaniaBluefield State CollegeBluegrass Community and Technical CollegeBluffton UniversityBoise State UniversityBossier Parish Community CollegeBoston CollegeBowdoin CollegeBowie State UniversityBowling Green State UniversityBrandeis UniversityBrandman UniversityBriar Cliff UniversityBridgepoint EducationBridgewater CollegeBridgewater State UniversityBrigham Young UniversityBrigham Young University-IdahoBrookdale Community CollegeBrookhaven CollegeBroward CollegeBrown UniversityBryant UniversityBryn Mawr CollegeBucknell UniversityBucks County Community CollegeBunker Hill Community CollegeBurrell College of Osteopathic MedicineButler County Community CollegeButler UniversityCabrini UniversityCaldwell UniversityCalifornia College of the ArtsCalifornia Health Sciences UniversityCalifornia Institute of the ArtsCalifornia State University-FullertonCalifornia University of PennsylvaniaCalifornia Western School of LawCalumet College of Saint JosephCalvin CollegeCameron UniversityCanisius CollegeCape Fear Community CollegeCapital University 2019 System ateMaster'sMaster'sAssociate'sMaster'sPrivate ReligiousPrivate IndependentPrivate IndependentPublicPrivate IndependentPrivate ReligiousPublicPrivate ReligiousPrivate IndependentPrivate IndependentPrivate IndependentPrivate IndependentPrivate ReligiousPrivate ReligiousPrivate ReligiousPrivate ReligiousPublicPrivate IndependentPublicPublicPublicPrivate IndependentPrivate ReligiousPublicPublicPublicPrivate ReligiousPublicPublicPrivate ReligiousPrivate IndependentPublicPublicPrivate IndependentPrivate IndependentPrivate ReligiousPrivate for-ProfitPrivate ReligiousPublicPrivate ReligiousPrivate ReligiousPublicPublicPublicPrivate IndependentPrivate IndependentPrivate IndependentPrivate IndependentPublicPublicPrivate IndependentPublicPrivate IndependentPrivate ReligiousPrivate ReligiousPrivate IndependentPrivate IndependentPrivate IndependentPublicPublicPrivate IndependentPrivate ReligiousPrivate ReligiousPublicPrivate ReligiousPublicPrivate ReligiousAdministrators in Higher Education ParticipantsSingle Unit InstitutionSingle Unit InstitutionSingle Unit InstitutionInstitution Within a SystemSingle Unit InstitutionSingle Unit InstitutionInstitution Within a SystemSingle Unit InstitutionSingle Unit InstitutionSingle Unit InstitutionSingle Unit InstitutionSingle Unit InstitutionSingle Unit InstitutionSingle Unit InstitutionSingle Unit InstitutionSingle Unit InstitutionInstitution Within a SystemSingle Unit InstitutionInstitution Within a SystemInstitution Within a SystemSingle Unit InstitutionSingle Unit InstitutionSingle Unit InstitutionInstitution Within a SystemInstitution Within a SystemInstitution Within a SystemSingle Unit InstitutionSingle Unit InstitutionInstitution Within a SystemSingle Unit InstitutionSingle Unit InstitutionInstitution Within a SystemInstitution Within a SystemSingle Unit InstitutionInstitution Within a SystemSingle Unit InstitutionSystem OfficeSingle Unit InstitutionInstitution Within a SystemSingle Unit Instituti
ed affiliates, and international institutions were excluded from the analysis. See the Methodology section for more detail on these exclusions. Doctoral Masters Baccalaureate Associates Special ocusOther 252 368 224 183 Special ocus/ Other 108 System Office 39 2019 ADMINISTRATORS IN HIGHER EDUCATION A S P CLASSIFICATION AFFILIATION REGION 329 .

