Transcription
Status of Implementation of SHRP2 Specifications to theAASHTO LRFD: Recommendations from Service Limit StateDesign for BridgesThis brief report summarizes the service limit states investigated in the second Strategic HighwayResearch Program (SHRP2) project, Service Limit State Design for Bridges (R19B), and theirimplementation status as of March 2017. The agenda items attached to this report show theproposed revisions as they appeared in the annual meeting agenda of the 2015 and 2016American Association of State Highway and Transportation Officials (AASHTO) Subcommittee onBridges and Structures (SCOBS). The meetings were held on April 20 to 23, 2015, in SaratogaSprings, New York, and on June 27 to 30, 2016, in Minneapolis, Minnesota, respectively. The finalrevisions may be slightly different due to minor changes that may have been approved duringthe meeting. In order to ensure that any revisions be understood and considered forimplementation beyond the initial states engaged in implementing Service Limit State Design, itis recommended that additional training for the broader bridge engineering community beconsidered. This training would best be accomplished via multiple webinars covering the topicsof Live-Load Calibration, Service Limit States and Geotechnical/Foundations.Service III Load Combination: Cracking of Prestressed ConcreteService Limit State Design for Bridges and the National Cooperative Highway ResearchProgram (NCHRP) 12-83 project recommended revisions to the load factor for live load for theService III load combination. Instead of using a 0.8 load factor for all cases, the recommendedload factor is dependent on the method used to estimate prestressing losses. The recommendedload factors are 1.0 or 0.8. See Attachment 1 for the agenda item.Status: The proposed revisions were adopted during the 2015 SCOBS annual meeting.Future implementation work suggested: Training is recommended for the broader bridgeengineering community regarding the background and history of the limit state.Fatigue Limit StateAn agenda item, including several revisions related to the fatigue limit state in the AASHTO loadand resistance factor design (LRFD), was included in the agenda for the 2015 SCOBS annualmeeting. Following are the AASHTO LRFD proposed revisions in the agenda item: An increase in the live load factor for Fatigue I from 1.5 to 2.0 and for Fatigue II from 0.75 to0.8.1
Some revisions associated with the increase in load factor (e.g., the table for average dailytruck traffic [ADTT] beyond which infinite fatigue life should be considered). Revisions to the table for number of load cycles per truck passage. Revisions to the equations for fatigue of reinforcement in reinforced concrete.The original recommendations of Service Limit State Design also included revisions to the fatigueS-N curves for some fatigue categories for structural steel details. These recommendations werenot included in the agenda item due to the desire of the AASHTO SCOBS Technical Committee onStructural Steel Design (T14) to keep the existing curves that match those used by the AmericanInstitute of Steel (AISC).Please see Attachment 2 for the 2015 agenda item. The agenda item was withdrawn during themeeting due to concerns that the 2.0 load factor for live load for Fatigue I is too high. Morespecifically, the concern is that the higher factor will cause some fatigue categories to control thedesign where they previously did not control the design.Additional research was performed and resulted in recommending the load factor for Fatigue Ito be 1.75 (instead of 1.5 currently in the specifications and 2.0 originally recommended byService Limit State Design).Status: An agenda item has been included for the 2016 SCOBS annual meeting that is similar tothe 2015 item except that the proposed load factor for live load for Fatigue I is 1.75. The agendaitem was balloted and it will be incorporated in the AASHTO LRFD.See Attachment 3 for the proposed 2016 agenda item covering the revisions to the Fatigue LimitState.Future implementation work suggested: Training for the broader bridge engineering communityis recommended for the following areas: Background of the revisions to the fatigue provisions. Background of the original recommendation for changing the S-N curves for some structuralsteel fatigue categories to produce uniform reliability. Background of the recommendation to revise the equations for fatigue of reinforcement inreinforced concrete to produce uniform reliability.Service I: Control of Cracking of Reinforced Concrete Components through theDistribution of ReinforcementThe research indicated that the current specification provisions produce uniform reliability. Inthe absence of reasons to increase or decrease the level of reliability index produced by these2
provisions, it was concluded that revisions to these provisions are not needed at this time. Norevisions to the specifications were recommended.Future implementation work suggested: Training for the broader bridge engineering communityis recommended regarding the background of the specification requirements to allow futurerevisions when further research determines whether the current level of reliability is the correctone or whether changing the level of reliability is needed.Service I: DeflectionThe research indicated that there were no widely accepted criteria on dynamic response to liveload. The criterion used by the CAN/CSA S6 Canadian Bridge Design Code was investigated. Thiscriterion is based on varying the allowed static deflection based on the first natural frequency ofthe structure—not the span length as in AASHTO LRFD. The research indicated that the deflectionlimits in AASHTO produce the same trend as is produced by the CSA provisions.Status: During the 2015 SCOBS annual meeting, the subcommittee voted to include commentaryto the deflection provisions to indicate that other criteria based on deflection-frequencyperception requirements exist and made a reference to the Service Limit State Design report. SeeAttachment 4 for the 2015 agenda item.Future implementation work suggested: Training for the broader bridge engineering communityis needed regarding the deflection-frequency-perception requirements. This will decrease theconcern regarding changing the long-used deflection criteria for a more rational criteria based onfrequency and accelerations in the future.Service I: Foundations DeformationsThe calibration of foundations deformations is the topic of a paper produced under the ServiceLimit State Design implementation effort. For further details, see Incorporation of es/R19B ServiceLimitStateDesignforBridges.aspx.This work produced new concepts and represents pioneering work. To allow ease of application,the proposed specification revisions were developed such that the general conventionalprocesses used in determining foundation deformations are also used in the proposed revisions.Status: The Agenda item was not presented to the full SCOBS in 2015. Following the 2015 SCOBSmeeting, the agenda item was updated and it was the subject of several discussions between T15, AASHTO SCOBS Technical Committee on Loads (T-5), and the SHRP2 R19B team. Followingthe update, an agenda item was proposed for the 2016 SCOBS annual meeting. The item did notballot and the AASHTO SCOBS Technical Committee on Substructures and Retaining Walls (T-15)3
asked for additional information. The agenda item was revised for discussion at the T-15 2016mid-year committee meeting. See Attachment 5 for the revised agenda item as of November2016. It is unknown if the agenda items will be balloted in 2017 or in a future year.Future implementation work suggested: An additional white paper has been requested todocument the database evaluated in 2016 for the effects that the proposed agenda item wouldhave on the data. This database included data provided by Tony Allen, chair of T-15, based onWSDOT projects. In addition, work with T-15 is needed to finalize the agenda item and thepresentation to SCOBS. Finally, a major training effort for the broader bridge engineeringcommunity is needed regarding the new concepts introduced by the research and the proposedrevisions. This training will ease the concerns that usually surrounds the introduction of newconcepts and will increase the chances of SCOBS voting for the proposed revisions.Service II Load Combination: Premature Yielding of Steel StructuresThe validity of the existing load factor for the Service II load combination was investigated inService Limit State Design. The research suggested that the current load factor is justifiable giventhe limited background of this limit state. The research also suggested that it may be possible touse the distribution factors for a single lane loaded for this limit state except for areas with heavytruck traffic. Discussions with some members of AASHTO technical committees indicated thatusing the distribution factor for one lane will not be desirable particularly with the current driveto increase the legal loads. See Attachment 6 for the agenda item.Status: SCOBS approved an agenda item that included additions to the description of the limitstate and the commentary. See Attachment 6 for the agenda item.Future implementation work suggested: Training for the broader bridge engineering communityis needed regarding the background of the limit state and the research as well as for recognizingthe situations that may require considering site-specific conditions.4
ATTACHMENT 1Service III, Tension in Prestressed Components, Agenda ItemFromthe 2015 SCOBS Annual Meeting Agenda
2015 AASHTO BRIDGE COMMITTEE AGENDA ITEM: 4SUBJECT: LRFD Bridge Design Specifications: Section 3, Articles 3.4.1 and 3.16The Manual for Bridge Evaluation: Section 6, Tables 6A.4.2.2-1 and 6A.4.2.2-2;Appendix B6A, Tables B6A-1 and B6A-2 (WAI 184)TECHNICAL COMMITTEE: T-10 Concrete/ T-5 LoadsREVISIONADDITIONNEW DOCUMENTDESIGN SPECMANUAL FOR BRIDGEEVALUATIONCONSTRUCTION SPECSEISMIC GUIDE SPECOTHERMOVABLE SPECBRIDGE ELEMENT INSP GUIDEDATE PREPARED:DATE REVISED:9/10/143/4/15AGENDA ITEM:Item #1In Table 3.4.1-1, replace the load factor for live load in the Service III Load Combinations with γLL.Item #2In Article 3.4.1, add new Table 3.4.1-4 as follows:Table 3.4.1-4—Load Factors for Live Load for Service III Load Combination, γLLComponentPrestressed concrete components designed using the refined estimates oftime-dependent losses as specified in Article 5.9.5.4 in conjunction withtaking advantage of the elastic gainAll other prestressed concrete componentsγLL1.00.8Item #3In Article C3.4.1, revise the 10th paragraph and add the following paragraph:Prior to 2014, the longitudinal analysis relating to tension in prestressed concrete superstructures was investigated using aload factor for live load of 0.8. The live load specified in these specifications This load factor reflects, among other things,current exclusion weight limits mandated by various jurisdictions at the time of the development of the specifications in 1993.Vehicles permitted under these limits have been in service for many years prior to 1993. It was concluded at that time that,Ffor longitudinal loading, there is no nationwide physical evidence that these vehicles have caused cracking in existingprestressed concrete components. The 0.8 load factor was applied regardless of the method used for determining the loss ofprestressing. The statistical significance of the 0.80 factor on live load is that the event is expected to occur about once a yearfor bridges with two traffic lanes, less often for bridges with a single traffic lane.The calibration of the service limit states for concrete components (Wassef et al., 2014) concluded that typicalcomponents designed using the Refined Estimates of Time-Dependent Losses method incorporated in the specifications in2005, which includes the use of transformed sections and elastic gains, have a lower reliability index against flexural crackingin prestressed components than components designed using the prestress loss calculation method specified prior to 2005based on gross sections and do not include elastic gains. For components designed using the currently-specified methods for49
instantaneous prestressing losses and the currently-specified Refined Estimates of Time-Dependent Losses method, anincrease in the load factor for live load from 0.8 to 1.0 was required to maintain the level of reliability against cracking ofprestressed concrete components inherent in the system.Components which design satisfies all of the following conditions: The time-dependent prestressing losses are determined using either a refined time step method or the lump sum lossspecified in Article 5.9.5.3 The section properties are determined based on the concrete gross section, and The force in prestressing steel is determined without taking advantage of the elastic gain, were not affected by thechanges in the prestressing loss calculation method introduced in 2005. For these components, a load factor for liveload of 0.8 was maintained.Service I should be used for checking tension related to transverse analysis of concrete segmental girders.The principal tensile stress check is introduced in order to verify the adequacy of webs of segmental concrete girder bridgesfor longitudinal shear and torsion.Item #4Add the following reference to Article 3.16:Wassef, W. G., J. M. Kulicki, H. A. Nassif, A. S. Nowak and D. R. Mertz. 2014. Calibration of LRFD Concrete BridgeDesign Specifications for Serviceability, Report on NCHRP 12-83 (in progress), Transportation Research Board, NationalResearch Council, Washington, DC.Item #5In the Manual for Bridge Evaluation (MBE) Article 6A.4.2.2, revise Table 6A.4.2.2-1 as follows:Table 6A.4.2.2-1—Limit States and Load Factors for Load RatingBridge Limit State*Dead LoadγDCDead LoadγDWStrength I1.25Strength IIService IIFatigueDesign LoadInventoryOperatingLegal LoadPermit LoadγLL—γLLTables 6A.4.4.2.3a-1and 6A.4.4.2.3b-1—1.30—Tables 6A.4.4.2.3a-1and 6A.4.4.2.3b-1——Tables 6A.4.4.2.3a-1and 6A.4.4.2.3b-1——1.00———Tables 6A.4.4.2.3a-1and 001.501.000.00—1.300.75—1.00—Strength I1.251.501.751.35Strength IIService I1.251.001.501.00————Strength I1.251.501.751.35Strength II1.251.50Service III1.001.00Service I1.001.00—0.80Table6A.4.2.2-2—Strength I1.251.501.751.35Strength II1.251.50———Table 6A.4.5.4.2a-11.00——Table 6A.4.5.4.2a-11.00—Table 6A.4.5.4.2a-1—Table 6A.4.5.4.2a-150
In the MBE, add new Table 6A.4.2.2-2 as follows:Table 6A.4.2.2-2—Load Factors for Live Load for the Service III Load Combination, γLL, at the Design-Load Inventory LevelγLLComponentPrestressed concrete components rated using the refined estimates of timedependent losses as specified in LRFD Design Article 5.9.5.4 inconjunction with taking advantage of the elastic gainAll other prestressed concrete components1.00.8In MBE Appendix B6A, revise Table B6A-1 as follows:Table B6A-1—Limit States and Load Factors for Load Rating (6A.4.2.2-1)Bridge Design LoadInventoryOperatingγLLγLLStrength I1.251.501.751.35Strength IIService I1.251.001.501.00————Strength I1.251.501.751.35Strength II1.251.50—Legal LoadγLLTables 6A.4.4.2.3a-1and 6A.4.4.2.3b-1—1.30—Tables 6A.4.4.2.3a-1and 6A.4.4.2.3b-1——Tables 6A.4.4.2.3a-1and 6A.4.4.2.3b-1—Service III1.001.00—1.00———Tables 6A.4.4.2.3a-1and 6A.4.4.2.3b-1—1.00Limit State*Dead LoadγDCDead LoadγDWStrength I1.251.501.751.35Strength IIService 0—Service I1.001.00—0.80Table6A.4.2.2-2—Strength I1.251.501.751.35Strength II1.251.50——Permit LoadγLL—Table 6A.4.5.4.2a-11.00——Table 6A.4.5.4.2a-11.00—Table 6A.4.5.4.2a-1—Table 6A.4.5.4.2a-1In MBE Appendix B6A, add new Table B6A-2 as follows:Table B6A-2—Load Factors for Live Load for the Service III Load Combination, γLL, at the Design-Load Inventory Level(6A.4.2.2-2)ComponentPrestressed concrete components rated using the refined estimates of timedependent losses as specified in LRFD Design Article 5.9.5.4 inconjunction with taking advantage of the elastic gainAll other prestressed concrete componentsγLL1.00.8Renumber the remaining tables in MBE Appendix B6A as follows:Table B6A-2 becomes Table B6A-3Table B6A-3 becomes Table B6A-4Table B6A-4 becomes Table B6A-551
OTHER AFFECTED ARTICLES:NoneBACKGROUND:A study of concrete service limit states reported in Wassef et al., 2014, found that there was a difference inreliability indices for prestressed concrete beams designed using loss calculations specified before and after 2005which could be resolved with the proposed revisions.ANTICIPATED EFFECT ON BRIDGES:More consistent reliability when various loss methods are used.REFERENCES:Report on NCHRP 12-83 – in preparationOTHER:None52
ATTACHMENT 2Fatigue Agenda ItemFromthe 2015 SCOBS Annual Meeting Agenda
2015 AASHTO BRIDGE COMMITTEE AGENDA ITEM: 3SUBJECT: LRFD Bridge Design Specifications: Sections 3, 5 and 6, Various ArticlesTECHNICAL COMMITTEE: T-5 Loads / T-10 Concrete / T-14 SteelREVISIONADDITIONNEW DOCUMENTDESIGN SPECMANUAL FOR BRIDGEEVALUATIONCONSTRUCTION SPECSEISMIC GUIDE SPECOTHERMOVABLE SPECBRIDGE ELEMENT INSP GUIDEDATE PREPARED:DATE REVISED:7/30/143/5/15AGENDA ITEM:Item #1Revise load factors for the Fatigue Limit States in Table 3.4.1-1 as follows:LoadCombinationLimit StateStrength I(unlessnoted)Strength IIStrength IIIStrength IVStrength VExtremeEvent IExtremeEvent IIService IService IIService IIIService IVFatigue I—LL, IM & CEonlyFatigue II—LL, IM & CEonlyDCDDDWEHEVESELPSCRSHγpUse One of These at a �43
Item #2Revise the 3rd paragraph of Article C5.5.3.1 as follows:In determining the need to investigate fatigue, Table 3.4.1-1 specifies a load factor of 1.50 on the live load forceeffect resulting from the fatigue truck for the Fatigue I load combination. This factored live load force effect representsthe greatest fatigue stress that the bridge will experience during its life.Item #3Revise Eqs. 5.5.3.2-1 and 5.5.3.2-2 as follows:( F )TH( F )TH 24 20 f min / fy 30 25 f min / fy(5.5.3.2-1)16 0.33 f min( F )TH 20 0.41 f min( F )TH (5.5.3.2-2)Item #4Add the following to the end of the second paragraph of Article C5.5.3.2:Coefficients in Eqs. 5.5.3.2-1 and 5.5.3.2-2 have been updated based on calibration reported in Kulicki et al. (2014).Item #5Revise Table 6.6.1.2.3-2 as follows:Table 6.6.1.2.3-2—75-yr (ADTT)SL Equivalent to Infinite LifeDetailCategoryABB′CC′DEE′75-yrs (ADTT)SL Equivalent to InfiniteLife (trucks per day)530 1030860 16701035 20151290 2510745 14551875 36603530 68906485 12665Item #6Revise Eq. C6.6.1.2.3-1 as shown:75 Year ( ADTT ) SL 75 Year ( ADTT ) SL A ( F )TH ( 365 )( 75 )( n ) 2 3A ( F )TH ( 365 )( 75 )( n ) 2.5 3(C6.6.1.2.3-1)44
Item #7Revise Table 6.6.1.2.5-2 as follows:Table 6.6.1.2.5-2—Cycles per Truck Passage, nLongitudinalMembersSimple SpanGirdersContinuousGirdersSpan Length 40.0 ft 40.0 ft1.02.01) near interiorsupport1.52) elsewhereCantileverGirders1.0OrthotropicDeck PlateConnectionsSubjectedto Wheel Spacing 20.0 ft1.0 20.0 ft2.0Item #8Add the following to the end of the first paragraph in Article C6.6.1.2.5:Values of n for longitudinal members have been revised based on the calibration reported in Kulicki et al., 2014Item #9Add the following reference to Article 6.17:Kulicki, J. M., W. G. Wassef, D. R. Mertz, A. S. Nowak, N. C. Samtani. 2014. Bridges for Service Life Beyond 100Years: Service Limit State Design, Prepublication Draft. SHRP2, Transportation Research Board of the NationalAcademies, Washington, DC.OTHER AFFECTED ARTICLES:NoneBACKGROUND:These proposed revisions are a product of the SHRP2 R19B project identified in Item #9. The revisions to theload factors for the Fatigue I and Fatigue II in Item #1 are a result utilizing WIM data to model live load asdescribed below. The new load factors result directly in the changes shown in Items 1,4,5,6, and throughcalibration result in the changes in Item #3.45
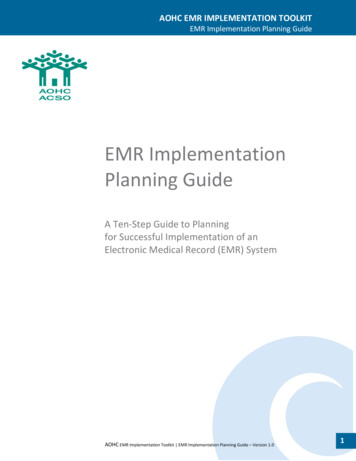
The use of the WIM data can be summarized below. Reference is made to “Probability Paper” throughout thesummary. Normal probability paper is a special scale that facilitates the statistical interpretation of data. Thehorizontal axis represents the variable for which the cumulative distribution function (CDF) is plotted, e.g. grossvehicle weight (GVW), mid-span moment or shear. The vertical axis represents the number of standard deviationsfrom the mean value. This is often referred to as the Standard Normal Variable” or the “Z-Score.” The verticalaxis can also be interpreted as probability of being exceeded and, for example, one standard deviation correspondsto 0.159 probability of being exceeded. The most important property of normal probability paper is that the CDF ofa normal random variable is represented by a straight line. The straighter the plot of data, the more accurately itcan be represented as a normal distribution. In addition, the curve representing the CDF of any other type ofrandom variable can be evaluated and its shape can provide an indication about the statistical parameters such asthe maximum value, type of distribution for the whole CDF or, if needed, only for the upper or lower tail of theCDF. Furthermore, the intersection of the CDF with horizontal axis (zero on vertical scale), corresponds to themean. The slope of CDF determines the standard deviation, σx as shown below. A steeper CDF on probabilitypaper indicates a smaller standard .950Standard normal 00.005-3Figure 0-1 Use of normal probability paper. .Initially 65million data records were obtained from 31 sites. After filtering to eliminate records that seemed tobe erroneous, elimination of a site for which the data we recorded in a unique format and other practicalconsiderations about 35million records remained. For the purpose of the fatigue limit states, the 15 sites reportedby the FHWA were selected for further processing.Vehicles with GVW less than 20 kips were removed since they have been shown to add little to fatigue studiesand add significantly to the work. This practical step has been used in previous studies.46
For Fatigue II:The complete string of vehicles for a given site was run across influence lines for simple spans (midspan) andtwo span continuous spans (moment at 0.4L and support) to produce a time history of moment for several spanlengths.The time history was then processed by commonly used rain-flow counting techniques to produce a series ofevents and the number of each event in the moment history. The number of events was divided by the number oftrucks recorded at site to produce the average number of cycles per truck passage which led to the data in Item #7.The string of events was then processed by the Pelgram-Miner process to produce the equivalent constantamplitude moment for each point considered for each span length considered. This was divided by the momentfrom the fatigue design truck specified in Article 3.6.1.4.1.The resulting ratios were plotted on probability paper using a point from each of the 15 sites to produce a“curve” for each span for each of the moment location considered. The results were regular enough to be fittedwith a straight line representing a normal distribution. The mean and bias of each line could then be read from theprobability paper.The biases were increased by 1.5 standard deviations and representative values were used to produce the loadfactor in Item #1 for Fatigue II, i.e. 0.80. The corresponding COV was 0.07.For Fatigue I:The rule of thumb that events greater than 1 in 10,000 may be ignored in the determination of the constantamplitude fatigue threshold was used in conjunction with the moments calculated from the WIM data by converting0.0001 to a probability of not being exceeded of 0.9999 or 3.9 standard deviations past the mean value.Using a horizontal line at 3.8 standard deviations to intercept the WIM data moments on probability paper foreach span under consideration for each time of moment being considered resulted in a set of 15 point “curves” thatcould be reasonably well fitted with straight lines from which a mean and standard deviation could be determined.Using the mean plus 1.5 standard deviations as the bias it was determined that a load factor of 2.0 wasindicative of the results obtained: the COV was 0.12.Calibration of Steel Details:Reassessment of a set of fatigue test results assembled by Keating et.al. using a modified damage criteriadeveloped for R19B and plotting the results on probability paper enabled the upper tail of the test results for eachcategory to be fitted with a straight line defining the resistance for which the equation could be found.Using the equations for resistance and other statistical data from the original LRFD calibration and the liveload factors, Monte Carlo simulation were run to find the current and proposed reliability indices. It was found thatthe variability in reliability produced by the current provisions could be improved and the reliability of Fatigue Iand II could be made almost equal by using the new load factor and either adding a set of resistance factors thatranged from 0.95 to 1.20 with reliability indices ranging from 0.90 to 1.20, or adjusting the S-N curves. Theproposed changes to the resistance factors were small and applied primarily to the lesser used details. It wasproposed to adjust the S-N curves. T-14 decided to support the changed load factors but decided that it was notadvisable to change the S-N curves as many other specifications use the same curves.Calibration of Reinforced Concrete:Traditionally fatigue design of concrete and reinforcing elements is limited to Fatigue I, and prestressingelements are not designed for fatigue. These characteristics were retained in the R19B project.Resistance data was taken from the literature. The data for reinforcing was reevaluated using the same47
methods as described above for welded details.The load factor and COV for live load was the same as for steel. Other data on uncertainties was taken fromthe original LRFD calibration.Monte Carlo simulations resulted in current reliability indices of about 1.9 for reinforcing and 0.9 for concrete.The target reliability was set at 1.0 for steel elements and 0.9 for concrete which is generally consistent with thatselected for other Service Limit States in the R19B project.Recalibration to these reliability indices resulted in no change for concrete as it was determined that there waslittle sensitivity on the resistance side, and the proposed revisions for reinforcing and welded wire fabric.ANTICIPATED EFFECT ON BRIDGES:Some localized increase in fatigue demand.REFERENCES:SHRP2 R19B project report at ne48
ATTACHMENT 3Fatigue Agenda ItemFromthe 2016 SCOBS Annual Meeting Agenda
2016 AASHTO BRIDGE COMMITTEE AGENDA ITEM: 11SUBJECT: LRFD Bridge Design Specifications: Section 3, Article 3.4.1; Section 5, Article5.5.3.2, and Section 6, Articles 6.6.1.2.3, 6.6.1.2.5 and 6.17TECHNICAL COMMITTEE: T-14 Steel / T-5 Loads / T-10 ConcreteREVISIONADDITIONNEW DOCUMENTDESIGN SPECMANUAL FOR BRIDGEEVALUATIONCONSTRUCTION SPECSEISMIC GUIDE SPECOTHERMOVABLE SPECBRIDGE ELEMENT INSP GUIDEDATE PREPARED:DATE REVISED:8/10/15AGENDA ITEM:Item #1In Column 3, revise Rows 12 and 13 of Table 3.4.1-1 as follows:Fatigue I—LL, IM & CEonlyFatigue II—LL, IM & Item #2Revise the last sentence of the 15th paragraph of Article C3.4.1 as follows:In previous editions of these specifications, and in predecessor AASHTO bridge design specifications, Tthe load factorfor this load combination was chosen on the assumption that the maximum stress range in the random variable spectrumis twice the effective stress range caused by Fatigue II load combination. A reassessment of fatigue live load reported inKulicki et al (2014) indicated that the load factors for Fatigue I and Fatigue II should be upgraded to the values nowshown in Table 3.4.1-1 to reflect current truck traffic. The resulting ratio between the load factor for the two fatigueload combinations is 2.2.Item #3In Article 5.5.3.2, revise Eqs. 5.5.3.2-1 and 5.5.3.2-2 as follows:( F )TH 24 20 f min / f y( F )TH26 22 f minfy(5.5.3.2-1)11-1
( F )TH 16 0.33 f min( F )TH 18 0.36 f min(5.5.3.2-2)Item #4In Article 6.6.1.2.3, revise Table 6.6.1.2.3-2 as follows:Table 6.6.1.2.3-2—75-yr (ADTT)SL Equivalent to Infinite LifeDetailCategoryABB′CC′DEE′75-yrs (ADTT)SL Equivalent to InfiniteLife (trucks per day)530 690860 11201035 13501290 1680745 9751875 24503530 46156485 8485Item #5In Article C6.6.1.2.3, revise Eq. C6.6.1.2.3-1 as follows:A75 Year ( ADTT ) SL ( F )TH ( 365 )( 75 )( n ) 2 A75 Year ( ADTT ) SL 3 0.80 ( F )TH ( 365 )( 75 )( n )1.75 3(C6.6.1.2.3-1)Item #6In Article 6.6.1.2.5, revise Table 6.6.1.2.5-2 as follows:Table 6.6.1.2.5-2—Cycles per Truck Passage, nLongitudinalMembersSimple SpanGirdersContinuousGirders1) nearinteriorsupport2) elsewhereCantileverGirdersOrthotropicSpa
LRFD Bridge Design Specifications: Section 3, Articles 3.4.1 and 3.16 . The Manual for Bridge Evaluation: Section 6, Tables 6A.4.2.2-1 and 6A.4.2.2-2; Appendix B6A, Tables B6A-1 and B6A-2 (WAI 184) TECHNICAL COMMITTEE: T-10 Concrete/ T-5 Loads . REVISION ADDITION NEW DOCUMENT. DESIGN SPEC CONSTRUCTION SPEC MOVABLE SPEC .