Transcription
Lecture 2Color Representationand QuantizationYao WanggPolytechnic Institute of NYU, Brooklyn, NY 11201With contributions from Zhu Liu, AT&T LabsMost figures from Gonzalez/Woods: Digital Image Processing
Lecture Outline Color perception and representation– Human pperceptionpof color– Trichromatic color mixing theory– Different color representations ColorC l iimage didisplayl– True color image– Indexed color images Pseudo color images Quantization Fundamentals– Uniform, non-uniform, dithering Color quantizationYao Wang, NYU-PolyEL5123: color and quantization2
Light is part of the EM waveYao Wang, NYU-PolyEL5123: color and quantization3
Illuminating and Reflecting Light Illuminating sources (primary light):– emit light (e.g. the sun, light bulb, TV monitors)– perceived color depends on the emitted freq.– follow additive rule R G B White Reflecting sources (secondary light):– reflect an incoming light (e.g. the color dye, mattesurface, cloth)– perceived color depends on reflected freq ( emittedfreq-absorbed freq.)– follow subtractive rule R G B BlackYao Wang, NYU-PolyEL5123: color and quantization4
Eye vs. CameraCamera componentsEye componentsLensLens, corneaShutterIris, pupilFilFilmR tiRetinaCable to transfer imagesOptic nerve send the info tothe brainYao Wang, NYU-PolyEL5123: color and quantization5
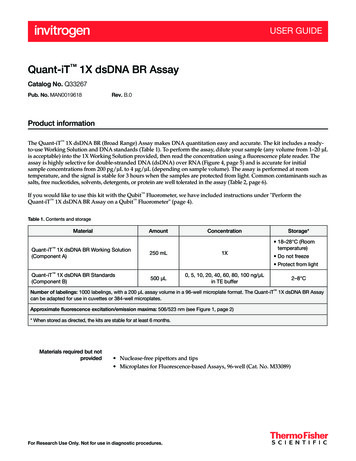
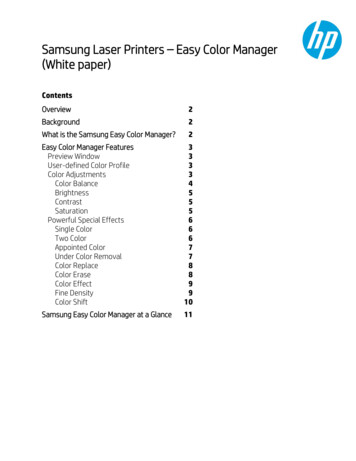
Human Perception of Color Retina contains receptors– Cones Day vision, can perceive color tone Red, green, and blue cones– Rods Night vision, perceive brightness only Color sensation– Luminance (brightness)– Chrominance Hue (color tone) Saturation (color purity)Yao Wang, NYU-PolyEL5123: color and naframe.html6
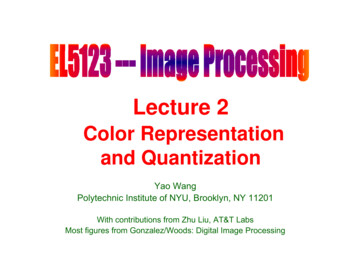
Frequency Responses of Cones and theLuminous Efficiency FunctionCi C ( )ai ( )d , i r , g , b, yYao Wang, NYU-PolyEL5123: color and quantization7
Tri-chromatic Color Mixing Tri-chromatic color mixing theory– Any color can be obtained by mixing three primary colors with aright proportion Primary colors for illuminating sources:– Red, Green, Blue (RGB)– Color monitor works by exciting red, green, blue phosphorsusing separate electronic guns– follow additive rule: R G B White Primary colors for reflecting sources (also known assecondary colors):– Cyan, Magenta, Yellow (CMY)– Color printer works by using cyan, magenta, yellow and black(CMYK) dyes– follow subtractive rule: R G B BlackYao Wang, NYU-PolyEL5123: color and quantization8
RGB vs CMYMagenta Red BlueCyan Blue GreenYellow Green RedYao Wang, NYU-PolyMagenta White - GreenCyan White - RedYellow White - BlueEL5123: color and quantization9
Demo with Photoshop Show the mixing using RGB, CMY colors– Using the “window color”window color tool (in “showshowcolor”, click on right arrow button to choosedifferent color sliders) (can also click F6)– Sample image: RGBadd, CMYsub Use the dropper tool, click on different part of theimage, see the color information in “show color” Select different color coordinatesYao Wang, NYU-PolyEL5123: color and quantization10
A Color ImageRedGreenYao Wang, NYU-PolyEL5123: color and quantizationBlue11
Tristimuls Values Tristimulus value– The amounts of red,red green,green and blue neededto form any particular color are called thetristimulus values, denoted by X, Y, and Z.– Trichromatic coefficientsXx ,X Y ZYZy , z .X Y ZX Y Z– Only two chromaticity coefficients arenecessary to specify the chrominance of alight.x y z 1Yao Wang, NYU-PolyEL5123: color and quantization12
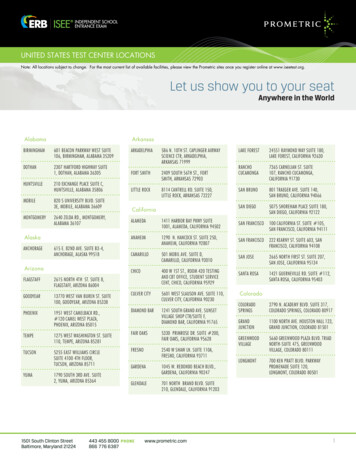
CIE Chromaticity DiagramCIE (CommissionInternationale deL’Eclairage,InternationalCommission onIllumination ) systemof color specificationx axis: redy axis: greene.g.g GREEN:x: 25%, y: 62%, z: 13%.Colors on the boundary:spectrum colors,colors highestsaturationYao Wang, NYU-PolyEL5123: color and quantization13
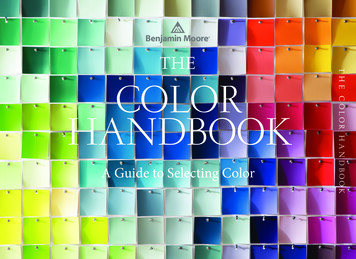
Color GamutA line segment indicates all colors that can be produced by mixing two colors corresponding to the endpoints of the line.E h colorEachl modeld lhhas diffdifferentt colorl range ((or gamut).t) RGB modeld lhhas a llarger gamutt ththan CMYCMY.Therefore, some color that appears on a screen may not be printable and is replaced by the closestcolor in the CMY gamut.Yao Wang, NYU-PolyEL5123: color and quantization14
Demo with Photoshop Using photoshop to show how to replace a out ofgamut color by its closest in-gamutin gamut color. Choose “window- show color”, choose the“CMYK slider” While having “RGBadd” in display, useEyedropper tool to click on “red”, “green” or“blue”, you will see a warning about out of gamutcolor, and the suggested replacement color Also open “gamut” image, click on out of gamutregionYao Wang, NYU-PolyEL5123: color and quantization15
Three Attributes of Color Luminance (brightness)Chrominance– Hue (color tone) and Saturation (color purity) Represented by a “color cone” or “color solid”θYao Wang, NYU-PolyEL5123: color and quantization16
Color Models Specify three primary or secondary colors– Red, Green, Blue.– Cyan, Magenta, Yellow. Specify the luminance and chrominance– HSB or HSI (Hue, saturation, and brightness orintensity)– YIQQ (used(in NTSC color TV))– YCbCr (used in digital color TV) Amplitude specification:– 8 bits per color component, or 24 bits per pixel– Total of 16 million colors– A 1kx1k true RGB color requires 3 MB memoryYao Wang, NYU-PolyEL5123: color and quantization17
RGB Color ModelRGB 24-bit color cubeYao Wang, NYU-PolyEL5123: color and quantization18
CMY and CMYK Color Models Conversion between RGB and CMY (assumingmaximum value is 1) C 1 R M 1 G , Y 1 B R 1 C G 1 M . B 1 Y Equal amounts of Cyan, Magenta, and Yellow producepractice, this pproduce muddy-lookingyg black. Toblack. In pproduce true black, a fourth color, black is added, whichis CMYK color model.Yao Wang, NYU-PolyEL5123: color and quantization19
HSI Color Model Hue represents dominant color asperceived by an observerobserver. It is an attributeassociated with the dominant wavelength. Saturation refers to the relative purity orthe amount of white light mixed with a hue.The pure spectrum colors are fullysaturated. Pink and lavender are lesssaturated.saturated Intensity reflects the brightness.Yao Wang, NYU-PolyEL5123: color and quantization20
Conversion Between RGB and HSI Converting color from RGB to HSI H 360 S 1 if B Gif B G1 ( R G ) ( R B) 1 2with cos ( R G ) 2 ( R B)(G B ) 12 3[min( R, G, B)]( R G B)1I [ R G B]3 Converting color from HSI to RGBRG sector ((0 H 120))GB sector (120 H 240)BR sector (240 H 360)B I (1 S )R I (1 S )G I (1 S ) S cos H R I 1 cos((60 H ) G 1 ( R B) S cos( H 120) G I 1 cos(60 ( H 120)) B 1 (R G) S cos( H 240) B I 1 cos(60 ( H 240)) R 1 (G B)Yao Wang, NYU-PolyEL5123: color and quantization21
YIQ Color Coordinate System YIQ is defined by the National TelevisionSystem Committee (NTSC)– Y describes the luminance, I and Q describesthe chrominancechrominance.– A more compact representation of the color.– YUV plays similar role in PAL and SECAMSECAM. Conversion between RGB and YIQ0.114 R Y 0.299 0.587 I 0.596 0.274 0.322 G , Q 0.211 0.55233 0.3311 B Yao Wang, NYU-Poly0.621 Y R 1.0 0.956 G 1.0 0.272 0.649 I B 1.0 1.10606 1.703 Q EL5123: color and quantization22
YUV/YCbCr Coordinate YUV is the color coordinate used in color TV in PALsystem, somewhat different from YIQ. YCbCr is the digital equivalent of YUV, used for digitalTV, with 8 bit for each component, in range of 0-255Yao Wang, NYU-PolyEL5123: color and quantization23
Demo with Photoshop Show the RGB, CMY, HSI models– Using the “window showwindow show color”color tool (in “showshowcolor”, click on right arrow button to choosedifferent color sliders)– Sample image: RGBadd, CMYsub, fruit Use the dropper tool, click on different part of theimage, see the color information in “show color” Select different color coordinatesYao Wang, NYU-PolyEL5123: color and quantization24
Criteria for Choosing the ColorCoordinates The type of representation depends on theapplications at handhand.– For display or printing, choose primary colorsso that more colors can be producedproduced. EE.g.gRGB for displaying and CMY for printing.– For analytical analysis of color differencesdifferences,HSI is more suitable.– For transmission or storage, choose a lessredundant representation, eg. YIQ or YUV orYCbCrYao Wang, NYU-PolyEL5123: color and quantization25
Comparison of Different ColorSpacesYao Wang, NYU-PolyEL5123: color and quantization26
Pseudo Color Display Intensity slicing: Display different gray levelsas different colors– Can be useful to visualize medical / scientific /vegetation imagery E.g. if one is interested in features with a certain intensityrange or several intensity ranges Frequency slicing: Decomposing an image intodifferent frequency components and representthem using different colors.Yao Wang, NYU-PolyEL5123: color and quantization27
Intensity SlicingColorC4C3C2C1f0 0f1f2f3f4Gray levelPixels with gray-scalegray scale (intensity) value in the range of (f i-1 , fi) are rendered with color CiYao Wang, NYU-PolyEL5123: color and quantization28
ExampleYao Wang, NYU-PolyEL5123: color and quantization29
Another ExampleYao Wang, NYU-PolyEL5123: color and quantization30
Pseudo Color Display of Multiple Images Display multi-sensor images as a single colorimage– Multi-sensor images: e.g. multi-spectral images bysatelliteYao Wang, NYU-PolyEL5123: color and quantization31
An ExampleYao Wang, NYU-PolyEL5123: color and quantization32
ExampleYao Wang, NYU-PolyEL5123: color and quantization33
Three Processes in A/D ConversionSamplingxc(t)QuantizationT x [n]x[n] xc(nT)SamplingP i dPeriodBinaryEncodingQuantizationI tIntervallQc[n]BinarycodebookSampling: take samples at time nT– T: sampling period;– fs 1/T: sampling frequency Quantization: map amplitude values into a set of discrete valueskQ– Q: quantization interval or stepsize Binaryy Encodingg– Convert each quantized value into a binary codewordYao Wang, NYU-PolyEL5123: color and quantization34
Analog to Digital Conversion1T 0.1Q 0.250.50-0.5A2D plot mA2D plot.m-10Yao Wang, NYU-Poly020.2040.4060.6EL5123: color and quantization080.8135
How to determine T and Q? T (or fs) depends on the signal frequency range– A fast varying signal should be sampled more frequently!– Theoretically governed by the Nyquist sampling theorem fs 2 fm (fm is the maximum signal frequency) For speech: fs 8 KHz; For music: fs 44 KHz; Q depends on the dynamic range of the signalamplitude and perceptual sensitivity– Q and the signalgrangeg D determine bits/samplep R 2R D/Q For speech and image: R 8 bits; For music: R 16 bits; One can trade off T ((or fs) and Q ((or R))– lower R - higher fs; higher R - lower fs We discuss quantization in this lecture. We willdiscuss sampling laterlater.Yao Wang, NYU-PolyEL5123: color and quantization36
A QuantizerfQ(f)Q(f)Quantizerr7Decision Levels {tk, k 0, , L}r6Reconstruction Levels {rk, k 0, , L-1}Iff [t k , t k 1 )Then Q(f) rkt1L levels need R log 2 L bits x r0r5r4t2r2returns the smallest integerthat is bigger than or equal to xr1r2r3r4r5r6t3 t4r3r1t5t6t7fQuantizererrorr0r7ft0 - t1t2t3Yao Wang, NYU-Polyt4t5t6t7 t8 EL5123: color and quantization37
Uniform Quantization Equal distances between adjacent decision levels andbetween adjacent reconstruction levels– tl – tl-1 rl – rl-1 q Parameters of Uniform Quantization––––L: levels (L 2R)B: dynamic range B fmax – fminq: quantization interval (step size)q B/L B2-R Quantization function f f min qQ( f ) q f min 2 q Yao Wang, NYU-PolyEL5123: color and quantizationN tNote: x returns the biggestg that is smallerintegerthan or equal to x38
Uniform Quantization:Functional RepresentationQ(f)r7 fmax-q/2r6r5stepsize q (fmax-fmin)/8r4r3r2r1r0 fmin q/2ft0 t1t2t3fminYao Wang, NYU-PolyEL5123: color and quantizationt4t5t6t7t8fmax39
Truncated Uniform Quantization Signal with infinite dynamic range Truncate the lower and higher values tofmin and fmax Parameters– fmin, fmax– L (R) Quantization function f f mini q q f min 2 q Q( f ) f min q / 2 f max q / 2 Yao Wang, NYU-Polyf min f f maxEL5123: color and quantizationf f minf f max40
Truncated Uniform Quantization:Functional RepresentationoverloadregionQ(f)r7 fmax-q/2r6r5r4r3r2r1r0 fmin q/2fmint0 - overloadregionYao Wang, NYU-Polyt1t2t3t4t5EL5123: color and quantizationt6t7 fmaxt8 f41
Example 1 of Uniform Quantizer Input signal is continuous– The output of a Charge-CoupledCharge Coupled Device(CCD) camera is in the range of 0.0 to 5.0volt.– L 256– q 5.05 0 / 256– The output value in the interval (l * q, (l 1) *q] is represented by index l, l 0, , 255.– The reconstruction level rl l * q q/2, l 0, ,, , 255.Yao Wang, NYU-PolyEL5123: color and quantization42
Example 2 of Uniform Quantizer Input signal is discrete– Digital Image of 256 gray levels– Quantize it into 4 levels– fmin 0,0– fmax 256,– q 256 / 4 6464,– q/2 32,– Q( f ) f / 64 * 64 32Yao Wang, NYU-PolyEL5123: color and quantization43
Yao Wang, NYU-Polyq 8, L 32q 644, L 4q 116, L 16Original, L O 256Uniform Quantization on ImagesEL5123: color and quantization44
Quantizer Performance Ideally we want to measure the performance by howclose is the quantized image to the original image -Perceptual Difference But it is very hard to come up with an objective measurethat correlates very well with the perceptual quality Frequently used objective measure – mean square error(MSE) between original and quantized samples or signalto noise ratio (SNR) or Peak SNR (PSNR)Yao Wang, NYU-PolyEL5123: color and quantization45
MSE Mean square error (MSE) of a quantizer for a continuousvalued signalMSE q2 E{(Q( f ) f ) 2 } tLL 1( f Q( f )) p ( f )df 2t0 l 0tl 1tl( f rl ) 2 p ( f )df– WhereWhp(f)(f) isi theth probabilityb bilit ddensityit ffunctionti off f MSE for a specific imageMSEYao Wang, NYU-Poly q21 MNN 1 M 1 ( f (i, j ) Q( f (i, j ))) 2i 0 j 0EL5123: color and quantization46
SNR and PSNR Signal to Noise Ratio (SNR)SNR (dB ) 10 log 2f q21Signal Variance Signal Energy 2f MN N 1 M 1 ( f (i, j ) mean) 2i 0 j 0P k SNRPeak– For the error measure to beindependent of the signalenergy,gy, use the dynamicyrange square of the image asthe signal energy– For 8 bit image, peak 255Yao Wang, NYU-PolyEL5123: color and quantizationPSNR (dB ) 10 log255 2 q247
MSE of a Uniform Quantizer for AUniform Source 1 /( f max f min ) 1 / B, f ( f min , f max )p( f ) 0, otherwise f maxB22 12 f df f f minB12 Uniform quantization into L levels : q B / L B / LError in each bin is the same, and is uniformly distributed in (-q/2, q/2) 2q/2 B1qe 2 de q2 L q / 2q1212SNR 10 log10 2f q22B 2 2R 2 2f 2 2 R12 10 log10 2 2 R 20 R log10 2 6 R (dB)Every additionalddi i l bitbi increasesitheh SNR byb 6dB!dYao Wang, NYU-PolyEL5123: color and quantization48
Example: Nonuniform Source The pdf of a signal is shown below, we want to quantizeit to 2 levels. Determine the partition and reconstructionlevels that minimizes the quantization error (in terms ofMSE). Also compute the MSE and SNR. Go through in class.classp(f)1/2Exp(f)Exp(-f)fYao Wang, NYU-PolyEL5123: color and quantization49
MMSE Quantizer For any pdf, the quantizer that minimizesMSE is known as Minimal MSE (MMSE)quantizer. For uniform source,source what is the MMSEquantizer?Yao Wang, NYU-PolyEL5123: color and quantization50
Implementation of Quantization Two options Option 1:– At each pixel, calculating quantized value for thegiven pixel value– ForF uniformifquantization,ti tiincludingi l di one didivisioni i anddrounding, then multiplication– Must repeat for all pixels Option 2:– Precompute the quantized values for all possibleinput values and save in a looklook-upup table– Change each pixel based on the look-up table Which one is more efficient?Yao Wang, NYU-PolyEL5123: color and quantization51
Sample Matlab Code for Option 2 Setup the quantization function Q(f) for all possible inputlevel first.x imread('lena256 8.bmp');id('l256 8 b ') Matlab code[height, width] size(x);L 1616, MSE 2121.66Is there a more efficient implementation?Yao Wang, NYU-PolyEL5123: color and quantizationx int(x);B 256;% Q isi ththe quantizationti ti ttableblQ zeros(256, 1);% Quantized to 64 levelsL 16;q B / L;Lfor i 0:255,Q(i 1, 1) floor(i / q) * q q /2;endy zeros(size(x));for i 1:height,for j 1:width,y(i, j) Q(x(i,j) 1);endEndMSE mean(mean((x-y). 2));52
Quantization Effect – False Contour 1-D Signalfˆ (t )f(t) 2-D Imagettx zeros(256,256);(256 256)for I 1:256,for j 1:256,x(i,j) max(i,j)-1;enddendFigure;imshow(uint(x));f(i,j) max(I,j)Yao Wang, NYU-PolyEL5123: color and quantization53
Perception Optimized Quantization Reduce the artifact of false contour Better visualis al perception (H(Humanman eeyeses arevery sensitive to edges) MSE might be worseYao Wang, NYU-PolyEL5123: color and quantization54
Pseudo Random Noise Quantizerfg Uniform QuantizerQ()Step size: qĝfˆ -hRandom NoiseGeneratorUniform in (-q/2, q/2)Yao Wang, NYU-PolyWhy do we first subtract andthen add back the randomi ? WhatWh t if we skipki one offnoise?them?EL5123: color and quantization55
Example Comparison8 Level Uniform QuantizerMSE 83.78 Level Pseudo RandomNoiseo se QuaQuantizert eMSE 173.45Which one is better to your eye?Yao Wang, NYU-PolyEL5123: color and quantization56
Halftoning Halftoning – Representing gray scale image using 2levels (black and white) Used for printing gray scale photographs in B/Wnewspaper/fax Can be extended to more than two levelsfTwo Level Quantizerg fw Dither SignaldYao Wang, NYU-PolyfˆfbWhy don’t we subtract the addeddithered signal?EL5123: color and quantization57
Color Quantization In low end monitors, the monitor cannot display allpossible colors. Select a set of colors, save them in a look-up table (alsoknown as color map or color palette) Any color is quantized to one of the indexed colors Only needs to save the index as the image pixel valueand in the displayp y buffer Typically: k 8, m 8 (selecting 256 out of 16 million)Input index (k bits)Red color (m bits)Green color (m bits)Blue color (m bits)Index 1 . Index 2 k Yao Wang, NYU-PolyEL5123: color and quantization58
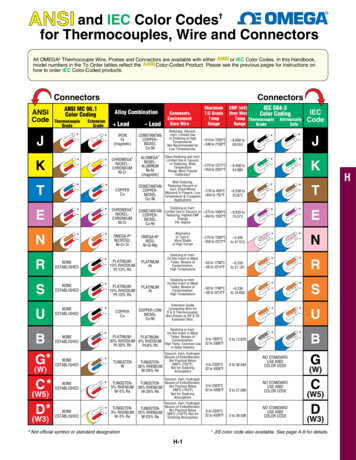
Web Colors: 216 Safe RGB ColorsThese colors are those that can be rendered consistently by different computer systems. They are obtainedby quantizing the R,G,B component independently using uniform quanitization. Each component isquantizedi d to 6 possibleibl values:l0(0x00),0(0 00) 51(051(0x33),33) 102(0102(0x66),66) 153(0153(0x99),99) 204(0204(0xCC),CC) 255(0255(0xFF).FF)Yao Wang, NYU-PolyEL5123: color and quantization59
Uniform vs. Adaptive Quantization Uniform (scalar quantization)– Quantize each color component uniformly E.g. 24 bit- 8 bit can be realized by using 3 bits (8 levels) forred, 3 bits (8 levels) for green, 2 bits (4 levels) for blue Do not pproduce ggood result Adaptive (vector quantization)– Treat each color ((a 3-D vector)) as one entity.y Find theN colors (vectors) that appear most often in a givenimage, save them in the color palette (codebook).Replace the color at each pixel by the closestcolor in the codebook– The codebook (I.e. color palette) varies from image toimage - adaptiveYao Wang, NYU-PolyEL5123: color and quantization60
Illustration of Vector QuantizationyCodebook size: 25yxVector QuantizationUniform QuantizationYao Wang, NYU-PolyxEL5123: color and quantization61
Example of Color Quantization24 bits - 8 bitsAdaptive (non-uniform) quantization(vector quantization)Yao Wang, NYU-PolyUniform quantization(3 bits for R,G, 2 bits for B)EL5123: color and quantization62
Color Dithering Color quantization may cause contour effect when thenumber of colors is not sufficient Dithering: randomly perturb the color values slightly tobreak up the contour effect, by applying the ditheringtechnique for gray scale images to each colorcomponent– fixed pattern or random noise dithering– diffusion dithering (the perturbed value of the next pixel dependson the previous one)Yao Wang, NYU-PolyEL5123: color and quantization63
Example of Color Dithering8 bit uniformwith diffusion dithering8 bit uniformwithout ditheringYao Wang, NYU-PolyEL5123: color and quantization64
Demo Using Photoshop Show quantization results with different methodsusing “image- mode- indeximage mode index color”colorYao Wang, NYU-PolyEL5123: color and quantization65
Homework1.2.3.4.5.6.Describe how the cones in the retina behind the human eye enable us to perceive color. Whatare the different types of cones we have? what colors are they each sensitive to?What color do you see when you project equal amounts of red, green and blue lights on a screen?What about red and green, and green and blue?What color do you see when you mix equal amounts off cyan, magenta, and yellow? What aboutcyan and magenta, magenta and yellow? what about mixing red, green, and blue in equalproportions?Consider the conversion between RGB and YCbCr coordinate. a) Determine the YCbCrcoordinate for a color that is specified in (R,G,B) coordinate with R 100,G 200, B 50. b)Determine the (R(R,G,B)G B) coordinate for a color specified in the YCbCr coordinate withY 100,Cb 50,Cr 30. Note that if you get R,G,B values that are outside the range of (0,255) youshould clip the values, so that values below 0 become 0, and values above 255 become 255.Suppose you are given a 24 bit color image, with color components red, green, blue eachrepresented by 8 bits per pixel. Now, we would like to reduce it to an 8 bit image by uniformlyg the red and ggreen components to 3 bits each, and the blue component to 2 bits.quantizingIllustrate the quantizer that you would use for different components. For designing the quantizer,you should assume the image values are uniformly distributed between 0 and 256 (instead of255). Suppose a pixel has a color value of (R,G,B) (200, 150, 40). What is the color afterquantization?Consider a source with a pdf as shown below. If we want to quantize it into L 3 levels, whatshould be the decision levels and reconstruction levels? Illustrate the results on the pdfpdf, andcompute the quantizer MSE and SNR.p(f)-1Yao Wang, NYU-PolyEL5123: color and quantization11f66
Computer Assignment1.2.3.Using Matlab or C, to implement uniform quantization of a grayscale image. Yourprogram should do the following: i) read a grayscale image into an array; ii) quantizeand save the quantized image in a different array; iii) compute the MSE, SNR, andPSNR between the originalgand qquantized images;gand iv)) displayp y and pprint thequantized image. Your program should assume the input values are in the range of(0,256), but allow you to vary the reconstruction level (L). Record the MSE obtainedwith L 64, 32, 16, 8, and print the quantized images with corresponding L values.Include the program, the image printout and MSE/SNR/PSNR values in yoursubmission. Comment on the imageg qqualityy as yyou varyy L.Choose a 24 bit color RGB image, quantize the R, G, and B components to 3, 3, and2 bits, respectively, using a uniform quantizer. Display the original and quantizedcolor image. Comment on the difference in color accuracy. Make sure you use acomputer that has a 24 bit color display, and the test image has good color contrast.Note you can apply the uniform quantization function developed for Prob. 1 to eachcolor component. For this assignment, please include color printout of original andquantized images. If you don’t have access to color printer, include a disk containingyour image files, or email the files to the grader.Choose a 24 bit RGB color image, convert it to HSI format, and display the HSIcomponents as separate gray scale imagesimages. Observe these images to comment onwhat does each of the H, S, I components represent. Include printout of the imagesand your program and comments in your report. For this assignment, you should notuse the MATLAB built-in function for RGB to HSV conversion. You should write yourown function. The HSV images should be saved in double precision. You can useimagesc( ) to display these images directly,directly which automatically scale each image toa gray scale between 0-255.Yao Wang, NYU-PolyEL5123: color and quantization67
Reading Gonzalez, “Digital Image Processing”,Chapter 2 (Section 2.1,21 22.2,2 22.3,3 22.4.141–2.4.3), Chap. 6. (Sec. 6.1-6.3), Sec. 8.2(p602-603 MMSE quantizer)(p602-603, Jain, “Fundamentals of Digital ImageProcessing” Chapter 4 (Section 4Processing”,4.55–4.11)Yao Wang, NYU-PolyEL5123: color and quantization68
Human Perception of Color Retina contains receptors - Cones Day vision, can perceive color tone Red, green, and blue cones - Rods Night vision, perceive brightness only