Transcription
Form ApprovedOMB NO. 0704-0188REPORT DOCUMENTATION PAGEPublic Reporting burden for this collection of information is estimated to average 1 hour per response, including the time for reviewing instructions, searching existing data sources,gathering and maintaining the data needed, and completing and reviewing the collection of information. Send comment regarding this burden estimates or any other aspect of this collectionof information, including suggestions for reducing this burden, to Washington Headquarters Services, Directorate for information Operations and Reports, 1215 Jefferson Davis Highway,Suite 1204, Arlington, VA 22202-4302, and to the Office of Management and Budget, Paperwork Reduction Project (0704-0188,) Washington, DC 20503.1. AGENCY USE ONLY ( Leave Blank)2. REPORT DATE3. REPORT TYPE AND DATES COVERED31 August 2005Final Technical Report (05NOV04 - 31AUG05)4. TITLE AND SUBTITLE5. FUNDING NUMBERSSystem Dynamics Aviation Readiness Modeling Demonstration - Final ReportC N00014-04-F-02656. AUTHOR(S)Michael E. McDevitt7. PERFORMING ORGANIZATION NAME(S) AND ADDRESS(ES)CACI Dynamic Systems Inc., 10085 Scripps Ranch Ct., San Diego, CA 921319. SPONSORING / MONITORING AGENCY NAME(S) AND ADDRESS(ES)8. PERFORMING ORGANIZATIONREPORT NUMBER10. SPONSORING / MONITORINGAGENCY REPORT NUMBEROffice of Naval Research800 North Quincy StreetArlington, VA 22217-566011. SUPPLEMENTARY NOTES12 a. DISTRIBUTION / AVAILABILITY STATEMENT12 b. DISTRIBUTION CODEApproved for public release; distribution unlimited.13. ABSTRACT (Maximum 200 words)A proof-of-concept demonstration of System Dynamics modeling was developed to determine the relative merit of the approachand then an experiment compared the results of the System Dynamics model with a traditional linear regression readiness model.This report documents the proof of concept model development and the experiment's results. An aviation readiness productionmodel was formulated using system dynamics. The model was developed over a period of six months with participation fromsubject matter experts at Commander Naval Air Force and Commander Strike Fighter Wing Pacific. The model incorporatesmonthly flight hour execution taking into consideration aircraft mission capable rates and the location of a squadron relative to theFleet Response Plan (FRP) training cycle to generate Primary Mission Area points in strike warfare that are accumulated togenerate an Attack Index. Concurrently, a renewed Strike Warfare Proficiency (Strike PRO) analysis was conducted forcomparison. Twenty-four Carrier Air Wing (CVW) events at NSAWC Fallon, NV were used to benchmark performance. Theresults of the Strike PRO algorithm and the results of the System Dynamics Model were each compared against the performancemetric. Source code for the System Dynamics Model is included as an appendix to the report.14. SUBJECT TERMS15. NUMBER OF PAGESSystem Dynamics, Modeling, Linear Regression, Comparison, Aviation Readiness, Strike Warfare6316. PRICE CODE17. SECURITY CLASSIFICATIONOR REPORTUNCLASSIFIEDNSN 7540-01-280-550018. SECURITY CLASSIFICATIONON THIS PAGEUNCLASSIFIED19. SECURITY CLASSIFICATIONOF ABSTRACTUNCLASSIFIED20. LIMITATION OF ABSTRACTULStandard Form 298 (Rev.2-89)Prescribed by ANSI Std. 239-18298-102
System Dynamics Readiness ModelingDemonstrationFinal ReportDeveloped for:Mr. Ervin Kapos, Code N00FDirector, Operations Analysis ProgramsOffice of Naval Research800 North Quincy StreetArlington, VA 22217-5660August 31 2005Work performed under Contract Number: N00014-04-F-0465byCACI Dynamic Systems Inc.10085 Scripps Ranch CourtSan Diego, CA 92131UNCLASSIFIED
System Dynamics Readiness Modeling Demonstration1.0 IntroductionCACI was contracted by the Office of Naval Research (ONR) to experiment with a non-traditionalapproach to improve readiness modeling in the Navy. CACI performed a proof-of-concept demonstrationof System Dynamics modeling to determine the relative merit of the approach and then conducted anexperiment to compare the results of the System Dynamics model with a traditional linear regressionreadiness model. This report documents the proof of concept model development and the experimentalresults.2.0 Executive SummaryAn aviation readiness production model was formulated using system dynamics. The model wasdeveloped over a period of six months with participation from subject matter experts at CommanderNaval Air Force and Commander Strike Fighter Wing Pacific.The model incorporates monthly flight hour execution taking into consideration aircraft mission capablerates and the location of a squadron relative to the Fleet Response Plan (FRP) training cycle to generatePrimary Mission Area points in strike warfare that are accumulated to generate an Attack Index.The development of the proof of concept systems dynamics model went well and the demonstrationmodel received positive endorsement from the customer at Commander Naval Air Force for its potentialutility in what-if analysis in regard to changing training and readiness requirements.Concurrently, a renewed Strike Warfare Proficiency (Strike PRO) analysis was conducted forcomparison. The bulk of this work involved data collection over a six-year period of disparate datasources. Twenty-four Carrier Air Wing (CVW) events at NSAWC Fallon NV were used to benchmarkperformance. The results of the Strike PRO algorithm and the results of the System Dynamics Modelwere each compared against the performance metric. They achieved almost equivalent statistical results,with correlation coefficients of 0.19 in both cases.Therefore, the experiment was inconclusive. The analysis team was unable to either prove or disprove thenull hypothesis. This was primarily due to historical data problems: timeframe mismatch, data qualityand the non-availability of data. Both models may lack significant variables in their formulations, butdata quality and scope over the performance period made any further analysis exceedingly difficult. On apositive note, the system dynamics model was qualitatively judged as having merit for providing arational systems-level explanation for resource allocation in readiness production. Further use of thesystem dynamics method is recommended for analysis of training and readiness matrix requirements.It is recommended that the Naval Aviation Enterprise take a close look at the requirements i.e.,performance measures, methodology and culture associated with archiving linked sets of performance andresource data to enable current and future proficiency analyses. If the Navy leadership is serious aboutcost wise readiness, then some significant cultural practices in the way that individual performance dataare collected, archived and managed will need major revision and in some cases, initial implementation.UNCLASSIFIED2
System Dynamics Readiness Modeling Demonstration3.0 BackgroundThis effort was initially proposed in an unsolicited white paper presented to Mr. Ervin Kapos, Director ofOperations Research to the Chief of Naval Research in the Spring of 2003. The rationale for thedemonstration is included in the following problem statement and proposed technical approach.3.1Problem StatementRecent newspaper articles report that the Chief of Naval Operations is planning a major overhaul ofmaintenance, training and deployment programs to quicken the Navy’s response. “A force that is readyevery day to apply maximum combat power.with strike groups fully ready to go out on very littlenotice.”1 This radical redesign of how forces are trained, maintained and employed could mean thattraditional concepts of readiness modeling may fail to provide the right information required by decisionmakers. This should prompt the question, do we need to relook at how we model readiness.With the advent of a new defense readiness reporting system (DRRS) requirement from OSD there is anurgent need for readiness capability models (by primary mission area) that can provide joint forcecommanders with an accurate assessment of a unit’s capability to perform specific Joint Mission EssentialTask List (JMETL) requirements now and in the future. This assessment methodology must havecredible analytical underpinnings to allow for proper force selection and to calculate a realistic time to getready to perform the mission and the time-associated costs. The new methodology must base decisionson currently available data and databases.A “useful” readiness model should be able to provide the Joint Force Commander with an assessment of aunit’s capability to perform mission essential tasks and that can answer the following questions: Ready to do what? At what level of performance, in what conditions, and for how long? Ready when? Today? Next Month? After mobilization? How much time and how much will it cost to achieve a desired level of readiness – to get ready? Ready for how long? What is the sustained capacity to perform the mission?Current readiness assessment is based on the Status Of Readiness and Training (SORTS) paradigm,which provides a “perceived” condition of a unit as measured in four resource categories: Personnel(CRPER), Equipment (CREQP), Training (CRTNG) and Supply (CRSUP). These categories are thenrolled up by mission area to provide a Primary Mission Area (PRMAR) rating of M-1 to M-4, with M-1being “fully ready” and M-4 being “not ready”. Each resource area is also rated in a similar fashion with“C-ratings”, C-1 through C-4. All of the primary mission areas and resource categories are compared andthe worst rating generally equates to an overall C-rating or CROVL for the unit.Unfortunately with the current system, with the exception of narrative comments, the time and resourcesrequired for a unit to achieve the next level of readiness or the final level of readiness is usually notspecified, making it harder for joint force planners to determine ultimate mission readiness at some laterdate. When readiness changes, a new report is submitted. Readiness reporting tends not to becontinuous, but instead is event-based and quantized. Trends are not explicitly considered nor reportedunless included by a thoughtful commander as a remark.1“Navy plans to alter training, quicken response times”, San Diego Union Tribune, Joe Cantlupe , Copley NewsService, 6 April 2003UNCLASSIFIED3
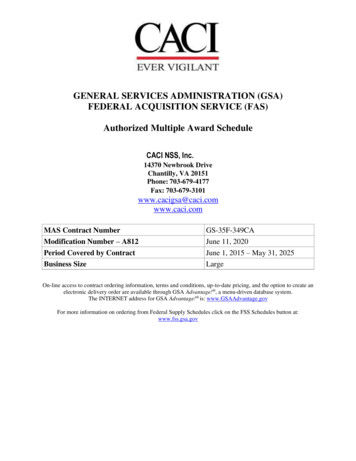
System Dynamics Readiness Modeling DemonstrationThe current system is based on unit commanders’ reports of current status according to certain formuladesignated by type commanders. Depending on the type commander and the culture of the unit type theremay be considerable variability in the detail and methodology substantiating the report. There have alsobeen cases of reporting a condition by default. A deployed unit must be C-2 to deploy so a unit reports C2 just prior to deploying. For example, cancellation of casualty reports prior to deployment was routinelyfollowed by new casualty reports on the same equipment a few days after the deployment begins.Current readiness systems ignore the persistence of readiness and the implications of inertia whenconsidering state change. Once a unit is ready, except for restocking of consumables, the unit will tend toremain ready for a sustained period. Readiness will slowly decline if the skills and practices in themission are not refreshed at some periodicity. These erosion curves tend to hold true if the personneldimension and other factors remain relatively constant. Performance of the mission task increasesreadiness - up to the point where fatigue begins to affect performance and increase error rate.Key to the overall “readiness system” is that there is considerable feedback present between the variousresource elements that contribute to readiness. Personnel shortages impact training. Training can beimpacted by equipment and supply. Equipment readiness can be impacted by training or a shortage ofqualified personnel. There are variable delays in acquiring training. A delay in readiness improvementdepends on the current state of readiness.The key metrics in a readiness system should be “total time to get ready” and “total cost to get ready” forequivalent levels of mission capability or performance. Recent experience in preparing ships, air wingsand battle groups for accelerated deployment in support of the “War in Iraq” may provide ample timeseries data for examination of these concepts.3.2Technical ApproachCurrent readiness estimation techniques neglect the necessity of having a continuous flow of informationfrom the vehicle level including the human performance portion of weapons’ system(s) through to thetheater level. Concepts like operational based readiness assessment (OBRA) attempted to measurevarious readiness indicators and develop a concept of continuous systems availability as a measure ofreadiness. However, efforts were compounded by a systemic lack of periodic measurement ofperformance information and the ability to correlate those indicators reliably to performance.Additionally, the coupling of resource information to performance is imprecise across many if not all ofthe resource domains.Could it be that the analysts are using the wrong tools? Linear regression models (LRM) tend to becomecurve-fitting exercises with adjustment of constants. Over time as the LRM fit erodes, the constants arereadjusted, but with little justification. Excel spreadsheets fail to account for feedback and time delays.Modern system dynamics software provides new tools and a refreshing new look at using cybernetictheory to explain readiness behaviors.Readiness tends to behave in a cyclic fashion for a number of reasons. One reason is that the readiness“system” is designed that way. A graphic example of cyclic readiness, the readiness of non-deployed airwings over time, is shown in Figure 1.UNCLASSIFIED4
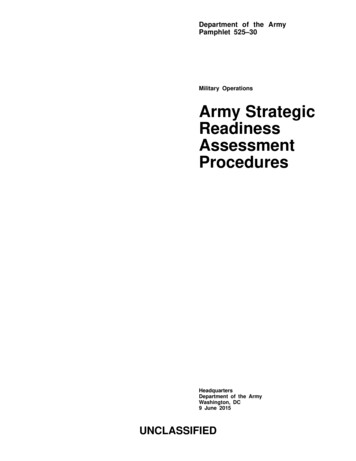
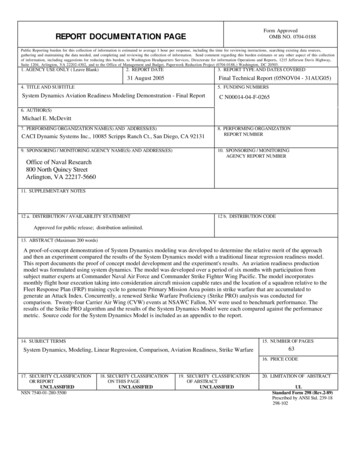
System Dynamics Readiness Modeling DemonstrationFigure 1: Non-deployed Air Wing Readiness "Bathtub Chart"Following a deployment, units enter the Inter Deployment Training Cycle (IDTC) – now called the FleetReadiness Training Plan (FRP). During early stages of the FRP, readiness degradation is expected asships and aircraft undergo maintenance and crews turnover. As units progress through the FRP, readinessshould steadily improve as maintenance is completed and training opportunities increase. In the latterstages of the FRP, units hone their war fighting skills by participating in exercises designed to ensure fullcombat readiness prior to deployment.Non-deployed readiness is currently funded at levels that leave little margin for flexibility. When fundingshortfalls occur, the Navy focuses first on ensuring the full readiness of deployed forces. Consequently,non-deployed readiness suffers as units in earlier stages of the FRP defer the ordering of parts,maintenance, and training so that additional funds can be made available for deployed units. While thisallows us to maintain a satisfactory deployed readiness posture, it has an undesirable effect on nondeployed forces. As a result, the non-deployed Air Wing readiness curve, or "bathtub," normallyassociated with units in the FRP has become increasingly deep and recovery to full combat readiness hasbecome much more taxing and occurs later in the FRP. The "bathtub" chart illustrates the increasingdifficulty our non-deployed forces are experiencing as they pass through the FRP.The results of a simple cyclic readiness model using a continuous time simulation methodology fromSystem Dynamics recreate the “pattern of readiness” evidenced in the bathtub effect as shown in Figure 2.UNCLASSIFIED5
System Dynamics Readiness Modeling DemonstrationReadiness100 Units1 Month1 Month40 Units0 Month0 Month0102030405060Time (Month)7080Readiness : Currentdeployment cycle : Currentworkup cycle : Current90100UnitsMonthMonth minimumdeployedreadiness goal readiness goalReadinessmonths perquarterdeployedsteaming days part of cycle increasingerodingerosion ratedeployederosion ratenondeployedsteaming daysnon deployedimprovement persteaming daydeployed improvementper steaming daynondeployederosion ratedeployment cyclemonthsbetweendeployment FINALTIME deploymentlengthfirst deploymentworkup cycleworkuplengthFigure 2: Cyclic Readiness ModelThe depth of the bathtub and relative steepness of the slope to climb out increase and decrease based onpolicy decisions and the dynamic availability of resources. As fewer resources are available for trainingafter return from deployment, the training levels drop lower until the resources are finally made availablelate in the workup cycle. This effect became very evident in the mid-1990s in Naval Aviation whenairframes were unavailable for workup training due to modernization (P-3 ICAPS) or due to significantmaintenance problems (F/A-18 gas turbine engine shortages).UNCLASSIFIED6
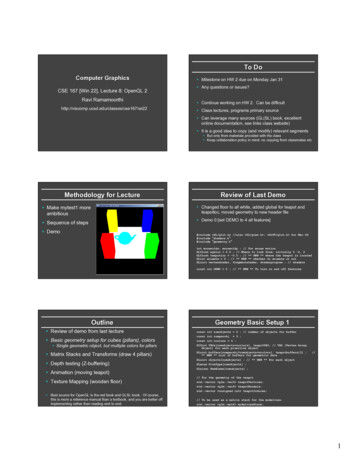
System Dynamics Readiness Modeling Demonstration fatigue - optempo -time required for training gap in requiredtraining resources maintenancebacklog-supplyreadiness-- properequipmentoperation --trainingresources- traininglevel --missioncapabilitygap--trainingrequirement personnelreadiness gap in personnelrequirements- required missioncapabilityoptempoFigure 3: Causal Loop Diagram2Figure 3 shows a causal loop diagram that illustrates the dynamic feedback between the traditionalreadiness resources of personnel (CRPERS), training (CRTNG), equipment (CREQP), and supply(CRSUP) as they impact readiness. Readiness in this context is measured as the level of performance of awarfare mission over a time period or as a clearly defined mission capability.There are multiple non-linear relationships between and among the four major categories of readiness thatare magnified by external influences, such as changes in operational tempo or budget, as they impactmission capability.Experimental Questions: 1. Can System Dynamics modeling be used to address “Human in the Loop”problems implicit in current readiness assessment models? 2. Can a continuous time model with causalfeedback loops and delays perform any better in readiness assessment than a linear regression model?This demonstration/experiment considered readiness as an “inventory” that accrues over time and that canbe reduced through expenditure and then restocked through the actions of a complex network of supply2Reading Causal Loop Diagrams (CLD). Arrows ? that have no “sign” are assumed to be . Negative relationships aremarked with a – sign. Relationships should be interpreted as follows: A? B means as A increases, then all else being equal,B increases. OR, as A decreases, then all else being equal B decreases. They move in the SAME direction. – Relationships areinterpreted as follows: A? -B means as A increases, then all else being equal, B decreases. OR, as A decreases, then all elsebeing equal B increases. The two variables move in OPPOSITE directions.UNCLASSIFIED7
System Dynamics Readiness Modeling Demonstrationchains. Readiness has persistence, or inertia when considered as an inventory. As an inventory, it can bemodeled using supply chain theory and continuous time simulation techniques.4.0 Statement of Work:The contract authorized a proof of concept demonstration of the feasibility and potential benefits of usingSystems Dynamics Readiness Modeling through CACI performance the following tasks:Task 1: The Contractor shall conduct a proof of concept demonstration of the feasibility andpotential of using Systems Dynamics Readiness Modeling to model readiness, asmeasured by operational performance.Task 2: The Contractor shall develop a system dynamics readiness model for a selected primarymission area in consultation with the ONR Operations Analysis Program Office.Task 3: The Contractor shall conduct an experiment to compare Systems Dynamics ReadinessModeling with linear regression-based readiness estimating modelsTask 4: The Contractor will provide a formal written report (final report) that describes theresults of the experiment as well as lessons learned and recommendations.5.0 Research Project PlanThis project builds upon past efforts. The Strike Warfare Proficiency (Strike PRO) program wassponsored by CINCPACFLT N83 in the late 1990s. Strike PRO used a series of linear regression modelsto predict point performance of an Air Wing or F/A-18 squadron in the land attack mission.5.1 Warfare MissionNavy F/A-18 Attack squadrons in a Strike Warfare Mission were selected as the targeted area for thedemonstration/experiment. Attack performance in Strike Warfare (STW) will be measured using thestandard operational metric of Bomb Hits Assessed (BHA) divided by the number of Bombs Fragged(BF) or (BHA/BF)3.5.2 MethodologyDevelop a system dynamics (SD) or continuous time simulation (CTS) model of naval aviation readinessbased on “P4 WARTS”4 resource patterns as primary causal factors of mission readiness. Include andincorporate the “Thomas Group” metrics wherever appropriate. Specifically address Strike Warfaremission performance for the F/A-18 Type/Model/Series of aircraft.1.1. Conduct a problem definition session at CNAP with appropriate process owners.3StrikePRO used the number of bombs assessed as successfully hitting the target divided by the number of bombsthat an air wing launched while on its Fallon detachment – BHA/BL. Later, on the recommendation of NSAWCSMEs, it was changed to BHA/BF – or the number of bomb hits divided by the number of bombs the air wingplanned to drop (or bombs fragged)4Originally coined at COMNAVAIRPAC in the mid-90s. P4 WARTS stands for the resources required to buildand support aviation readiness from the Type Commander’s perspective. These resources include Personnel, Planes,Parts, Petrol, Weapons, Adversaries, Ranges, TAD, and SimulatorsUNCLASSIFIED8
System Dynamics Readiness Modeling Demonstration1.1.1.Describe problem behavior verbally and graphically. Describe data sources andreliability. Describe goals, historic, current and projected. Explain rationale behindbehavior curve.1.1.2.Assess level of understanding and degree of confidence that the causes of the behaviorare understood. Document causal relationships. Determine or establish consensus oncausal factors and effects.1.1.3.Define all pertinent metrics. Determine which metrics that are currently collected arecontrol metrics. Indicate data sources and how frequently data are refreshed.2. Collect data from identified data sources for model validation and verification.3. Perform Model validation with aviation process owners.4. Compare SD Model results with Strike PRO regression analysis model. Null Hypothesis: That thesystem dynamics model will out perform the regression model by establishing a confidence of 0.01 orbetter. The historical performance of the Strike PRO regression model is no better that .05.5. Prepare and submit a formal written report that identifies the results of the experiment as well aslessons learned and recommendations.5.3 Data sourcesThe following data sources will need to be accessed as a minimum: Aviation Data Warehouse (ADW) using the SHARP software program for data reporting. ACES – Navy Flight hour program budgets and execution data TRMS – Personnel and SORTS data Operational results from SFARP, NSWAC, C2EX, JTFEX and deployed. Past and present Training & Readiness instructions and matrices for the F/A-185.4 Metrics, units, time seriesAll metrics and data will need to be normalized across the FRP. For example, Bomb Hits Assessed(BHA) / Bombs Fragged (BF) across an FRP with the FRP cycles normalized to the same relative timescale, i.e., Month 0, 1, 18. The nomenclature used in the NAVRIIP program for example is based onD, where D 0 is the deployment month. D-6 is six months prior to the deployment and D 6 is sixmonths into the deployment.UNCLASSIFIED9
System Dynamics Readiness Modeling Demonstration5.5 Detailed project planThe actual project proceeded as shown in Figure 4.IDTask Name4th QuarterNov1ONR Readiness Experiment2Contract Award3Executive level brief at CNAP45Conduct a problem definition session at CNAP withappropriate process owners.Describe problem behavior verbally and graphically.8Document causal relationships.9Receive DD254 from ONR10Describe data sources and reliability.1314Collect data from identified data sources for modelvalidation and verification.Model Aviation Readiness15Perform Model validation with aviation process owners.1617Compare SD Model results with Strike PRO regressionanalysis model.Draft Report18Out Briefing Report Review of Findings19Finalize Report20Prepare and submit a formal written report thatidentifies the results of the experiment as well asDec1st QuarterJan FebMar2nd QuarterAprMayJun3rd QuarterJul11/512/36/277/14Figure 4: Project PlanUNCLASSIFIED10
System Dynamics Readiness Modeling Demonstration6.0 System Dynamics Aviation Readiness Production ModelThe aviation readiness production model (or flight hour model) that was developed for this proof ofconcept demonstration is included in its entirety (complete with source code) in Appendix A. A detaileddescription of the model follows.The model was developed on the basic premise that as hours were flown based on the tenets of thetraining and readiness (T&R) matrix an increase in readiness would accrue over time based upon theNavy’s business rules and the general nature of human learning, i.e. specifically learning curves.Lost Hoursreset lostlost flighthoursget FH planauthorizing FHFlight HoursAllocatted notional FH permonth executing FH expending FHpilots expendingFHget actual FHEdataFlight HoursExpendedreset FHpct burnedsorties Total Pilots COB PMA Pointsadding PMApointspoints addedper FHexpiring PMApointsexpiredlookbackwindow month of cycle Figure 5: Flight Hour ExpenditureFigure 5 depicts the model structure for the planning and expenditure of flying hours and the accrual ofPrimary Mission Area (PMA) points. The Flight Hour Plan is determined based on the Notional FleetReadiness Training Plan (FRTP) as shown in Figure 6 (Enclosure 4 of CNAF 3500.1B dated21September 2004 - T&R Matrix). It is keyed to deployment cycles. Actual Air Wing/Squadronhistorical schedules, Flight Hour Execution and Full Mission Capable (FMC) rate data were fed to themodel from an Excel spreadsheet.UNCLASSIFIED11
System Dynamics Readiness Modeling DemonstrationNOTIONAL T&R FUNDING PROFILE (FRP)100090806050240Readiness% of T&R Matrix17030320100Maintenance ULTIntegSustainDeploymentR 27R 26R 25POMR 24D 6D 5D 4D 3D 2D 1POMR 15R 14R 13R 12R 11R 9R 10R 8R 7R 6R 5R 4R 3R 2R 14SustainFigure 6: Notional T&R Funding ProfileThe notional Flight Hours per month used in the model is based on the required number of Training andReadiness sorties multiplied by the number of flight hours (1.5) per F/A-18 sortie, all divided by thetraining interval of 90 days. This results in twenty-seven (27) flight hours per pilot and is used tocalculate the Flight Hour Plan.As actual flight hours are executed, a portion of these hours are allocated to training necessary for StrikeWarfare. As Strike Warfare accounts for roughly a third of the hours required to be flown in accordancewith CNAFINST (see Figure 8), thirty-three (33) points are added for each flight hour executed by fullmission capable aircraft.PMA points accrue and are maintained over the 27 Month FRTP cycle. At the beginning of each cyclethe look back window is set to 90 days. This look back window expands up to 360 days, day per dayafter completion of the initial ninety-day training interval. As training events age beyond 360 days theyexpire and are required to be repeated. At the commencement of a new cycle, the look back window isagain reset to ninety days.UNCLASSIFIED12
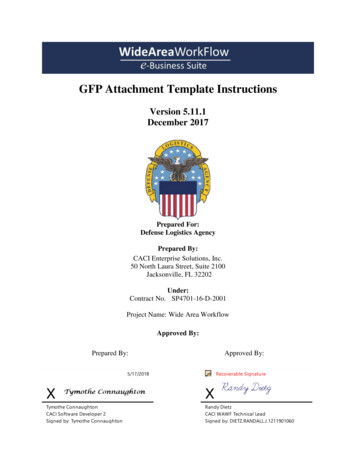
System Dynamics Readiness Modeling DemonstrationDetailed breakdown of FH RequirementsFunctional Check Flight3.3%Night Vision Goggles0.2%Aerial Refueling1.4%Demo Flight0.4%Similar Air Combat 1 v 125.1%Navigation (Instrument)6.8%Carrier Qualification14.7%Dissimilar Air Combat 2 v X6.5%Dissimilar Air Combat 4 v X1.9%Field Carrier Landing Practice14.2%Air-to-Air Gunnery1.6%War at Sea Exercise0.1%Bombing / Strafe ( 2 A/C)7.3%Bombing / Strafe ( 4 A/C)14.1%Close Air Support1.2%Mining Exercise0.7%Electronic Warfare0.4%Figure 7: T&R Matrix Requirements for F/A-18A simple supply chain monitors the number of pilots by level for each squadron in Figure 8.Replacement pilots are received from the Fleet Replacement Squadron (FRS) at about 3 every twomonths. They require on average six months to qualify as a Level 2 pilot. An additional year is requiredbefore qualification as a positional pilot. Another year is required to qualify as an advanced pilot capableof being in a strike lead role.The model calculates the demand on the FRS based on gaps and expected losses. This model does notinclude the FRS pipeline or its associated pipeline delay. It also assumes that losses at the departmenthead and command levels are filled immediately with contact relief and no delays in reporting.The model was run assuming steady state pilot production that could easily support 15 pilots per squadronacross the force. Unfortunately, historical squadron manning and monthly attrition data was not availablefor the time periods under analysis. The model is fully capable of taking time series attrition data intoaccount.The model continually calculates the number of pilots currently on board (COB) and keeps track of thevarious experience levels and the aggregate experience of the squadron. Percentage of L2, L3 and L4pilots onboard is continuously monitored and can be readily compared against the defined readinessstandards shown in Table 4:ACTC L2 L3 L4M182%50%30%M275%45%25%M365%40%20%Table 4: ACTC Experience Levels and M-RatingsUNCLASSIFIED13
System Dynamics Readiness Modeling Demonstrationl4 loss rateL4 Pilot retentionnew L4L4 losingtime as L4IntermediatePilots L2New Pilots L1new arrivalsqual as L2initial L1time to L2qual as L3initial L2time to L3FRS Level 1 Gradstotal initialgapadjustmenttimePositional PilotsL3initial L3Total
CACI performed a proof-of-concept demonstration of System Dynamics modeling to determine the relative merit of the approach and then conducted an experiment to compare the results of the System Dynamics model with a traditional linear regression readiness model. This report documents the proof of concept model development and the experimental