Transcription
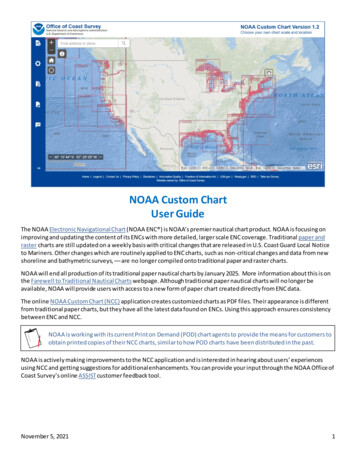
NOAA Custom ChartUser GuideThe NOAA Electronic Navigational Chart (NOAA ENC ) is NOAA’s premier nautical chart product. NOAA is focusing onimproving and updating the content of its ENCs with more detailed, larger scale ENC coverage. Traditional paper andraster charts are still updated on a weekly basis with critical changes that are released in U.S. Coast Guard Local Noticeto Mariners. Other changes which are routinely applied to ENC charts, such as non-critical changes and data from newshoreline and bathymetric surveys, –– are no longer compiled onto traditional paper and raster charts.NOAA will end all production of its traditional paper nautical charts by January 2025. More information about this is onthe Farewell to Traditional Nautical Charts webpage. Although traditional paper nautical charts will no longer beavailable, NOAA will provide users with access to a new form of paper chart created directly from ENC data.The online NOAA Custom Chart (NCC) application creates customized charts as PDF files. Their appearance is differentfrom traditional paper charts, but they have all the latest data found on ENCs. Using this approach ensures consistencybetween ENC and NCC.NOAA is working with its current Print on Demand (POD) chart agents to provide the means for customers toobtain printed copies of their NCC charts, similar to how POD charts have been distributed in the past.NOAA is actively making improvements to the NCC application and is interested in hearing about users’ experiencesusing NCC and getting suggestions for additional enhancements. You can provide your input through the NOAA Office ofCoast Survey’s online ASSIST customer feedback tool.November 5, 20211
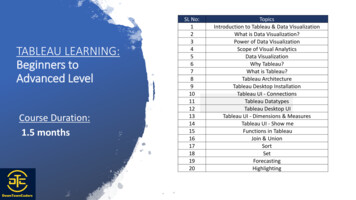
Moving around in the map windowThe controls in the top left corner of the NCC map window are usedto move to the area that you want to build a chart for.Use the Plus or Minus icons or roll your mouse wheel to zoom inand out of the map. The Home icon will zoom out to the defaultdisplay of North America. If you are using a GPS enabled device,clicking the My Locationicon will center the map at yourcurrent position. As you type into the Find Address or Place fieldthe auto-completion feature suggests locations to choose from. Select a location from the list or hit return to zoomto the spot. You may have to continue to zoom in to see chart features appear.Once the chart data is displayed, youcan click on the Identifyicon andthen tap on the map to get moreinformation about a particularfeature. An Identify Results windowwill appear with a count of thenumber of features found at thatlocation, such as (1 of 10). Use thearrowsat the top of the windowto cycle though each of the features.The feature being described in theresults window will be outlined in lightblue. Click the Identify icon again todeactivate it.A Scale Bar and Coordinate Display are in the bottom left corner of the mapwindow. A value in feet or miles is displayed next to the bar to indicate thedistance represented by the length of the bar. The coordinate display showsthe latitude and longitude of the mouse. The display may also be frozen byclicking on the icon. The display will then show the position of a pinwherever the mouse is clicked. The default display is in degrees, minutes, andseconds. This can be changed to decimal degrees or degrees and decimal minutes by clicking on the up arrow on theright side of the display and selecting the desired format.Accessing NCC settingsWhen NCC opens, these icons are displayed on the left side of the application window. After clicking on one, theassociated control panel is opened and the icons move to above the panel. The function of each is listed below.Help DocumentationLinks to a two-page Quick Start Guide, this user guide, a how-to video, the U.S. Chart No. 1,chart symbology guide, and version updates.Display SettingsSet the sounding units and other aspects of how data is portrayed on the chart.Print SettingsSelect chart scale, paper size and orientation, and center of the area to be charted.Export QueueCreate and view the completed chart.FeedbackProvide suggestions for improving the NOAA Custom Chart.November 5, 20212
The instructions below describe how to use the various settings to customize your chart. The remainder of the guide isorganized around these four basic chart-making steps.Customizing the display of depth areas to reflect your own vessel’s draftNCC enables users to set a “safety” value that controls where blue shallow water tints are shown on the chart. Someelectronic navigational systems that use ENCs can sound an alarm when a ship is heading towards shallow water, basedon the safety contour value that has been entered into the system for the ship’s draft. NCC provides a similar awarenessin an analog fashion by displaying a selected “safety contour” with a thick dark line. Generally, seaward of this line is“safe water” and shoreward is “shallow water.” Two and four shade options are also available for tinting shallow water.NCC does not create new contour lines, it displays existing depth contourscompiled into the ENC data that are used as the source to create NCC charts.Values entered by the user in the Display Settings control panel are used to selectan existing depth contour and depth areas to emphasize.As you consider the appropriate safety value to use for your custom chart, keep these factors in mind. Changes to aship’s draft can result from its load, speed, and sea conditions. The changing nature of the seabed due to silting andother factors, as well as the relative accuracy of the hydrography in an area, contribute to the risk associated with anygiven transit. All of these factors should be considered when calculating your vessels draft plus a prudent additionalcushion to use as the NCC safety setting.November 5, 20213
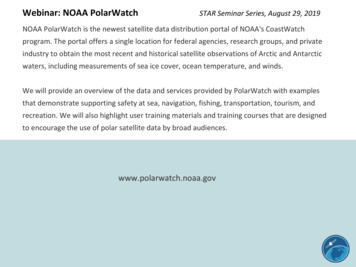
Click on the Display SettingsUnits control.icon to open the control panel and find the DepthThe Depth Units default is set to Feet, though the application may display depths inunits of feet, fathoms, or meters. The native unit for ENC data is in meters. Whendepth units are set to feet or fathoms, the values are rounded down to the nextlesser whole depth when the values are converted.Below the Depth Units control is the Depth Zone Tints control. The default fourshades setting will display sequential shades of blue, with the darkest blue showingthe shallowest water and white showing deep water.When the Depth Zone Tints control is set to two shades, the dark blue extends to thesafety tint contour. Any deeper water is shown as white.Two and four shade renderings for a chart with tint settings of 5, 11, and 17 feet are shown below.Traditional NOAA charts often have depth contours at 6 foot intervals in shallow water and larger intervals in deeperwater. For example: 6, 12, 18, 30, 60, 90, etc. Shallow water tint extents (showing one or two shades of blue) varyaccording to the slope of the bottom and the scale of the chart.On NCC charts, it is common for soundings and depth contour values to be shown as one foot shallower depths shownon the corresponding traditional paper or raster chart. This is a result of the rounding rules applied when the depths thatare stored in meters on ENCs are converted back into Imperial units for NCC charts. However, one cannot assume thatthe actual depths are one unit deeper than shown on the chart.November 5, 20214
Depths shown in feetThe image below shows the same area with depths displayed in meters. NCC selects the next deeper contour for thespecified setting (shallow, safety, or deep) if a matching contour does not exist.Depths shown in metersNovember 5, 20215
Customizing how other data are portrayed on the chartAlmost all of the rendering of the ENC data that is used to create NCC charts isautomatic. However, in addition to setting the safety contour value and blue shallowwater tints that are discussed above, there are a few other aspects of chart that canbe customized. The controls for these settings are on the bottom half of the DisplaySettings tab, shown at left. This is accessed by clicking on the Display Settingsicon.Labels for the safety depth contour and other depth contours appear with a whitehalo, as shown below. Contour Labels, as well as Compass Roses, may be toggled onand off.The Area Symbolization control changes how certain area features, such asanchorages, cable and pipeline areas, restricted and caution areas, and others aredepicted. The images below show a fairway, cable area, and a restricted area. Theimage on the left shows Plain Boundaries. The image on the right shows Symbolized Boundaries. Note that the trianglesand the “T-dash” portions of the symbolized boundaries point to the interior of the area.Comparison of Plain and Symbolized BoundariesSetting the scale, size, and area of the customized chartWhat is Chart Scale?Scale is the relationship between distance on a chart and the corresponding distance on the ground. This is often expressedas ratio, such as 1:10,000. Nautical charts and ENCs are broken into six categories, based on their scale. Small scale charts,such as Overview and General charts cover large areas – like the North Pacific Ocean – and show the least amount ofdetail. Large scale charts, such as Harbor or Berthing charts, cover small areas – like a harbor or even just a particular setof wharfs or piers – and show the greatest amount of detail. Coastal and Approach charts are in the middle. Thesecategories are referred to as a chart’s “Intended Use” in NCC and correspond to the six ENC “Usage Bands.”November 5, 20216
“Legacy” ENC data, that is, data that has not yet been reschemed, was compiled in over 100 different scales and therange of scales for each intended use overlaps to some extent with the range of scales used in adjacent intended usecategories. Reschemed ENCs are compiled in just 11 scales. The table below shows the scales for each Intended Use.When a particular Intended Use is selected by the users, the scale of the data used by NCC is based on whether it is froma legacy ENC cell or a reschemed ENC cell.ENC UsageBand No.Intended UseLegacy NOAA ENCScale RangesReschemed NOAAENC ScalesLevel of DetailShown on 01:2,5001:5,000MoreThe actual settings for the scale and size of the NCC chart are made in the PrintSettings control panel, which will be discussed later. However, there some controls inthe top half of the Display Settings tab, shown at left, that can help you optimize thescale, position, and level of detail to be presented on your chart. These are accessedby clicking on the Display Settingsicon.Unlike many online map applications that display greater detail nearly anywhere auser chooses to zoom in, nautical chart coverage does not have larger scale coverageeverywhere.When creating a custom chart, you must be aware of the scale of the underlying ENCdata from which NCC charts are generated. Attempting to make a largescale NCC chart where only small scale ENC data exists will yield poor results.NCC provides a way to determine where different scales of data coverage areavailable. The Data Extents control toggles the display of a red “minimum bounding rectangle” (MBR) surrounding eachENC. An MBR is the smallest rectangle that can completely enclose the data from a particular ENC.The Data Extent Text control governs which information about each ENC is displayed in the top left corner of each MBR.This includes the scale, the ENC name, both, or neither. An example displaying ENC scales is shown below.November 5, 20217
The Intended Uses control performs two functions. First, it controls which ENC band extents are displayed in the NCCmap window. The stack of overlapping red boxes, such as those shown in the image above, can be difficult to interpret.To reduce this clutter, uncheck the “All Datasets” box and check the box for the intended use that you wish to make achart for. The image below shows only the MBRs for the approach intended use / ENC usage band 4.November 5, 20218
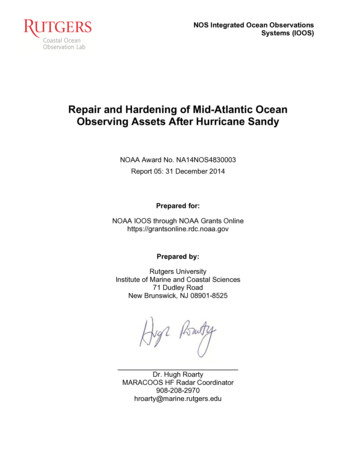
The Intended uses settings also control what ENC data is displayed in the NCC map window, as well as the data that isportrayed on the custom chart. It is recommended that the All Datasets box be checked before a chart PDF is created, asdescribed in the “View and download finished custom chart” section. This enables NCC to fill in any areas with smallerscale ENC data, if data at the scale specified in the Print Settings is not available, such as in the example below.Although most ENCs are somewhat rectangular and all reschemed ENCs are strictly rectangular, the data for some ENCsis irregularly shaped and does not completely fill its MBR. The “L” shaped ENC data coverage for McNeil Island in PugetSound, WA is an example of this case. The NCC display of the MBR for this ENC cell is shown below at left. The actualextent of the ENC data coverage is shown in blue tint on the right.Left image shows NCC displaying 1:80,000 data with the minimum bounding rectangle for a 1:20,000 scale ENC.Right image shows actual ENC footprint in blue tint. Area without blue tint is covered by 1:80,000 scale ENC data.Below, the image at left image shows a 1:20,000 NCC chart of McNeil Island, WA created with the Harbor Intended Usebox checked. The northeast quadrant of the chart shows only the low resolution NCC base map. The image at rightshows the same chart created with the All Datasets box checked. The missing data has been filled in with the nextclosest smaller scale data available the 1:80,000 ENC data from the approach intended use/ENC usage band 4.November 5, 20219
icon to open this control panel. Enter theClick on the Print Settingsdenominator of the representative fraction (without commas) for the scale chartthat you want to create in the Scale field. For example, for a 1:40,000 scalechart, enter 40000.Several International (ISO 216) and North American (ANSI/ASME Y14.1) standardpaper sizes may be selected from the Page Size pulldown menu for your chart.The proportions of these paper sizes are shown on the following page.A Portrait (vertical) or Landscape (horizontal) chart format may be selected fromthe Orientation pulldown menu.November 5, 202110
Relative sizes of international and North American paper sizes available in NCCNovember 5, 202111
Paper size and chart scale both affect the size of the area covered by your custom chart. Larger paper or a smaller scalewill both increase the size of the chart’s “footprint” on the ground, while use of smaller paper sizes or a larger scale willshrink the chart’s footprint. Some experimentation may be necessary to find the balance of coverage (footprint size) andlevel of detail (scale) that you want.Once the scale, size, and orientation setting have beenmade, click on the Create New Extenticon. This willactivate the crosshair cursor with a “Click to add anextent” prompt. Move the cursor over the NCC map windowand click at the center of the location you want to create achart at.NCC will take a moment to calculate the appropriatechart footprint for the scale, paper size, and latitudespecified. Please be patient – this could take 10-15 seconds.A red box, showing the extent of your custom chart, isdisplayed when the calculation has completed. The chartscale, as well as the length and width of the area covered onthe Earth, in meters, are displayed within the box.Move Custom Extenticon, then click and drag the chart to the desired position. Multiple custom chart extents –with the same or different scale, size, and orientation settings – can be created here before moving on to the ExportQueue control panel to complete the custom chart making process.View and download finished custom chartTo create, view and download your custom chart, clickon the Export Queue icon. This control panel shows alist of all the chart extents that have been created.Clicking on any chart in the list will zoom to the selectedchart in the NCC map window and highlight it with adarker shade of red. You can name your chart byreplacing the default text, “Chart 1.” The text that youenter will appear at the top of the custom chart.As in the Print Settings control panel, a chart selectedfrom the Export Queue list may be repositioned byclicking on the Move Custom Extenttool and thenusing the mouse to click-and-drag the chart.To delete charts, select one or more charts from the export queue and then click on the Delete Extentyour keyboard’s delete. Click “OK” in the “Are you sure you wish to delete selected products?” prompt.tool or hitTo create a PDF file of your custom chart. Select one or more charts from the list and click the Export Chartstool. Abar and timer will indict the progress of the chart being created. This process may take one or two minutes per chart. AnOpen buttonwill appear when the export it complete. Click the button to open the chart in anew browser tab. Use your browser’s download or save-as function to save the chart PDF file to your computer.November 5, 202112
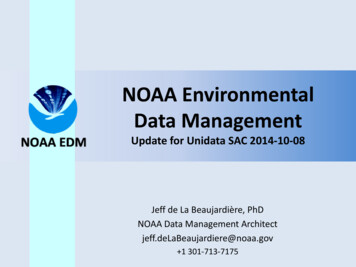
The first page of the PDF file holds the custom chart in the size and orientation that you selected. The second page ofthe PDF holds the Zone of Confidence Diagram. Subsequent 8.5” x 11” pages contain notes that a traditionalnautical chart would show within the chart itself. NCC collects all of these notices in one place.November 5, 202113
The age and accuracy of hydrographic survey data used on nautical charts varies. Depth information is based ondata from the latest available hydrographic survey, which in many cases may be quite old. Zone of Confidence(ZOC) Diagrams are provided on NOAA Custom Charts to assist mariners in assessing hydrographic survey dataand the associated level of risk to navigate in a particular area. ZOC diagrams show the extent the hydrographicsurveys used to compile the ENC data used on the NCC chart. Different shades of blue are used to indicate oneof five quality categories (A1, A2, B, C and D) assessed for the data in each “zone.” Areas for which the dataquality has not yet been assessed are shown as white. An accompanying table provides a description of eachcategory.November 5, 202114
For further assistance or to suggest improvements for the NOAA Custom Chartapplication, click the feedbackicon. This opens the NOAA Office of CoastSurvey’s online ASSIST customer feedback tool.If you have a question or suggestion concerning a particular NCC chart that youare trying to create, please tell us where the chart is of and attach the NCC chartPDF or a screenshot of the area, if possible.November 5, 202115
NOAA will end all production of its traditional paper nautical charts by January 2025. More information about this is on the . Farewell to Traditional Nautical Charts webpage. Although traditional paper nautical charts will no longer be available ,NOAA wil pl rovide users with access to a new form of paper cha rt created directly from ENC data.