Transcription
The Association ofPROFESSIONALENGINEERSEMPLOYMENT ANDREMUNERATIONREPORT 2020/21
The Association ofPublished by Professionals AustraliaCopyright 2020 by the Association of Professional Engineers, Scientists andManagers, Australia (trading as Professionals Australia). All rights reserved.No part of this work may be reproduced or stored in any form, especiallytypographically, electronically and including photocopying without writtenpermission of the publisher. The use of material for private study, research orcriticism is excepted from the reservation and may be undertaken within theaccepted meaning of fair dealing. The publisher makes no representation, in anyform, as to the accuracy of the information contained in this work and cannotaccept any legal responsibility for errors, omissions or consequences of anyaction taken by readers.ISSN 2203-1162 (previously ISSN 1444-7495)GPO Box 1272, Melbourne Victoria ssionalengineers.org.au2 Professional Engineers Employment and Remuneration Report 2020/21
CONTENTSFOREWORDJOB MARKETKEY FINDINGSENGINEER REMUNERATIONDisciplineStateSectorResponsibility levelJob functionUnion/Professional association membershipPost-graduate qualificationsAccreditationRecent graduatesGenderSatisfaction with current remunerationWORKPLACE ISSUESProfessional developmentHours of workProfessional intentionsWorker fatigue staff morale and productivityWork prioritiesFactors impacting engineering capabilityFactors impacting mental NDEPENDENT CONTRACTORSABOUT THE SURVEYEMPLOYMENT FRAMEWORK58HOW TO ORDER THE EXTENDED ENGINEERS EMPLOYMENTAND REMUNERATION REPORT685263Professional Engineers Employment and Remuneration Report 2020/21 3
A NOTE ABOUT THISSURVEYThe aim of this annual survey is to allow us toreport on pay and work trends in the professionalengineering workforce. As part of a longitudinaldata series of over 30 years, it will provide a strongevidence-base for understanding the position ofthe engineering workforce and the changes tothe engineering workforce over the previous andupcoming 12 months.The data referred to in this report was captured as the economicdownturn following the COVID-19 began and, as such, provides abenchmark of pay levels we want to return to or exceed as we rebuildthe economy.The data reflects only the initial impact of the COVID-19 pandemic onwages and while engineers appear to be faring reasonably to the pointat which this snapshot was taken, engineering salaries in the coming 12month period are unlikely to be immune from the effects of the healthcrisis itself and the economic penalties that arise from the lockdown.In response to the developing crisis, the 2020 survey included aquestion looking specifically at the work impact of COVID-19 onprofessional engineers. For a comprehensive report on the initialemployment impacts of the COVID-19 pandemic on professionalengineers, visit the APEA website at pandemic-engineers-report/4 Professional Engineers Employment and Remuneration Report 2020/21
ABOUT THEA S S O C I AT I O N O FPROFESSIONALENGINEERS,AUSTRALIAThe Association of Professional Engineers Australia is a division of Professionals Australia (formerlythe Association of Professional Engineers, Scientists and Managers, Australia). This organisation isregistered under the Fair Work Act 2009 representing over 23,000 professionals including professionalengineers, scientists, veterinarians, surveyors, architects, pharmacists, information technologyprofessionals, managers, transport industry professionals and translators and interpreters throughoutAustralia.Professionals Australia began as the Association of Professional Engineers, Australia (APEA) whichformed in 1946 and was registered as an industrial association in 1948. APEA was the first organisationto ensure that professional engineers were recognised and rewarded for the high-value work theydo. The Professional Engineers Case, finalised in 1961, saw engineers across Australia receive salaryincreases averaging more than 40 per cent. Even more importantly it set the precedent for work valueand benchmark salaries for professionals.Professionals Australia's engineering members are employed across all sectors of the Australianeconomy. Engineering-based industries are worth 479 billion or 32 per cent of national grossvalue added and exports from engineering-based industries excluding mining totalled 92 billion1or 29 per cent of total exports. This figure swells to 249 billion or 78 per cent of exports if miningis included. Engineers perform design, scoping and project management roles in a diverse range ofindustries throughout the private and public sectors including roads, rail, water, electricity, informationtechnology, telecommunications, construction, mining, oil and gas exploration, defence, shipbuildingand manufacturing. Engineers are largely responsible for designing, building and maintaining Australia'sinfrastructure. The contribution of our engineers and their ability to derive new ideas and developsolutions to our challenges as a nation will be fundamental to a successful transition to a competitivehigh-skill, knowledge-based economy.Professionals Australia has Government approval as an assessment entity for the only mandatoryengineering registration scheme in Australia – the Registered Professional Engineers of Queensland(RPEQ). Professionals Australia offers assessment in the areas of Civil, Electrical, Information Technologyand Telecommunications, Management, Mechanical and Structural Engineering.Professionals Australia is a not-for profit organisation and is owned by its members.Professional Engineers Employment and Remuneration Report 2020/21 5
FOREWORDAustralia is experiencing a significant downturn in economic activitywith high levels of unemployment, underemployment and low GDPgrowth expectations as the waves following the COVID-19 pandemicunfold. Australian GDP growth slowed to 2.3 per cent in the 2019financial year and is likely to fall well short of the 2.75 per centpredicted for the 2020 financial year.2 It is clear that the pandemicwill have a major impact on the engineering and construction labourmarket in the coming 12 months but the magnitude of the changes,the long-term impact on employment levels and the speed of therecovery are obviously difficult to forecast.While the Grattan Institute estimates comparatively low levelsof unemployment in the Professional, Scientific and TechnicalServices industry (10 per cent) as the COVID-19 pandemic playsout, stand-downs, staffing cuts and reduced hours have still had asignificant impact. We’ve seen people taking or being asked to takeunpaid leave or furloughs and leave on full or half pay, professionalsreallocated to different roles in areas of demand, alternativearrangements for fly-in-fly-out workers, vastly expanded remotework/work from home arrangements and the use of other flexibilityprovisions. We've also seen some employers trying to shut downproper consultation with their employees on the changes to workpractices they want to implement to deal with the crisis.The ongoing design and delivery of critical infrastructure and majornation-building projects will help drive economic recovery as weemerge from the Coronavirus health emergency as well as thedrought and bushfire emergencies. Keeping engineering skills up-todate will help ensure a well-trained and agile engineering workforceas the crisis subsides and governments invest in fiscal stimulusmeasures and both new and suspended or delayed infrastructureand construction projects, manufacturing, mining, construction andagriculture projects ramp back up.Now more than ever, engineers are looking to their work for theopportunity it gives them to participate in wealth-generatingactivities for their organisation and contribute to the nation’seconomic recovery. They develop solutions to complex problemsand positively impact people and processes. For Australian industryto lead the way to economic recovery, we need to recognise therole of the professional engineering workforce in value creation,continue to provide proper incentive for the next generation toaspire to professional engineering careers and, most critically, giveengineers the opportunities and recognition they need to make areal difference in their day-to-day work – our strength as a nation aswell as a competitive Australian economy depend on it.Engineers have expressed concern about performance measureswith shifting deadlines as projects are delayed for a range of reasonsincluding site shutdowns, domestic and international supply chaininterruptions and bottlenecks, shortages of equipment and materialsand travel restrictions.While the COVID-19 crisis presented massive challenges, there arealso a range of opportunities in engineering as Australia moves intopost-health crisis phase – and the remuneration and employmentsnapshot revealed in this survey show that we were reasonably wellplaced to withstand the impacts of the pandemic.Gordon BrockCEO, Association of Professional Engineers, Australia6 Professional Engineers Employment and Remuneration Report 2020/21
JOB MARKETWhen this snapshot was taken, the size of the professionalengineering workforce continued to hold at historically highlevels (bachelor and post-graduate degree qualified). Accordingto Australia’s most recent census data3, there were 140,391professional engineers employed across Australia in 2016 remainingfairly constant with the 2011 level of 140,425 up from around108,000 in 2006. The number of qualified engineers throughoutAustralia totalled 393,000 to 20194 and, based on historical growth,would normally have increased to around 412,000 to 2020 (includinggraduate diploma and graduate certificate level engineers). Thepandemic is likely to have an impact on employment growth but theextent of that impact is at this stage difficult to forecast.The most recent figures show that the number of studentscommencing a degree in engineering increased by 0.2 per cent onthe previous year driven by a 3.8 per cent increase in entry-levelcommencements offsetting a 14.8 per cent decline in post-graduatecommencements. Completions were up, driven by a 7.3 per centincrease in entry-level course completions that offset a 2.6 percent decline in post-graduate completions. It is also noteworthythat there was an increase in completions of 4.5 per cent markinga record high for completions of engineering courses by domesticstudents.5 The decline in international students able to continuetheir studies in Australia as a result of the pandemic is likely toimpact completions and the impact is likely to have a long tail, butagain the magnitude of the impact is difficult to predict.The Department of Employment, Skills, Small and Family Businessreported that overall, the number of employed engineeringprofessionals had increased by 5.1 per cent to February 2019compared with 2.3 per cent across all occupations. Demand wasstrongest for civil engineers across most states but the marketeased with shortages limited to Queensland, Tasmania and the twoterritories. A national shortage of electrical engineers also emergedfor the first time since 2012 with shortages identified in New SouthWales, Victoria and Queensland. Employers filled less than half ofthe mining engineer vacancies and shortages were identified for thefirst time since 20136.The latest figures show disappointing progress in the participationof women with only 14.6 per cent of the engineering workforcewomen, lower than the 2001 figure.Engineering vacancies in Australia to June 2019 contracted by9.2 per cent compared to a decline of 7.4 per cent for the overallvacancy rate.7 Consistent with long-term trends, vacancy levelswere highest in Civil engineering followed by Industrial/Mechanical/Production engineering vacancies and Mining and ICT engineers. Thestrongest growth in engineering vacancies was in New South Walesfollowed by Victoria, Queensland and Western Australia drivenlargely by major infrastructure spending on roads and rail projects.(see Table 1 below).Table 1 – Engineering vacancies by stateSTATEAVERAGE MONTHLYENGINEERING VACANCIESPERCENTAGE GROWTH/DECLINE OVER 2019 (%)PROPORTION OFENGINEERING VACANCIES (%)NSW1,161-2128VIC930-14.723QLD839-2.520WA836Less than 120SA172-10.34ACT78(% too small to report)2NT44(% too small to report)1TAS35(% too small to report)1Department of Employment, Skills, Small and Family Business figures show that the main reasonsemployers found applicants for engineering roles unsuitable were lack of experience in a particularspecialisation, insufficient technical skills and poor application, interview or work history.8The current supply of engineers provides a firm foundation of engineering capacity. However, a rangeof initiatives will be needed to create a sustainable Australian engineering capability for the futureand ensure engineers play the central role they should in the economic recovery phase following theCOVID-19 crisis. These include ensuring an adequate talent pool of engineers with five to ten years'experience, equipping engineers with up-to-date specialist technical skills in existing and emergingareas, making efforts to boost engineering course commencements and completions to maintain thelatest upturns and initiatives in the face of the pandemic and to encourage greater participation ofunderrepresented groups including women in the engineering workforce.Professional Engineers Employment and Remuneration Report 2020/21 7
KEY FINDINGSREMUNERATION Average wages for professional engineers over the 12 months toApril 2020 rose by 2.4 per cent, outpacing a CPI increase of 2.2per cent over the 12 months to 31 March 2020 and the WagePrice Index increase of 2.1 per cent across all professions over thesame period. A Masters degree delivered a wage premium of 13.6 per centwhen compared with a Bachelor degree, while a GraduateDiploma delivered a wage premium of 16.6 per cent. Respondentswith a doctorate received the highest wage premium, at 32.4 percent. Engineers in the Education and training industry fared best interms of growth rate with an average annual increase of 3.4 percent. 41.0 per cent of respondents received no pay rise at all in theprevious 12 months – 43.2 per cent in the private sector and 37.5per cent in the public sector. Wages in the Consulting and technical services industry, Transport,postal and warehousing and the Mining industry also rosestrongly, increasing between 2.6 and 2.7 per cent. Average annual salary movements were greatest for engineersqualified in the Mechatronics and Aeronautical disciplines withincreases of 4.9 and 4.2 per cent respectively. Gas supply as well as Manufacturing exhibited the weakestgrowth, both at 1.5 per cent. Movements were lowest for engineers qualified in Systems,Geological and Information technology and communicationsengineering with movements of 0.0, 1.3 and 1.5 per centrespectively. Respondents in the Education and training industry reported thehighest average wage with a median total package of 203,954,followed by engineers in Gas supply and Information Media andtelecommunications with packages of 191,625 and 171,804respectively. Engineers in the Defence industry recorded the lowest averagetotal package at 115,263, followed by Manufacturing with anaverage package of 126,272. The survey found almost one-third (30.5 per cent) of respondentswere dissatisfied with their current level of remuneration. 6.7 per cent of respondents said they were considering leaving theprofession permanently and the most common reason for wantingto leave the profession was lack of career advancement. 45.6 per cent said they believed their remuneration package wasfalling behind what others undertaking similar work were beingpaid. 47.1 per cent said they did not believe their package appropriatelyreflected the level of responsibility they undertook in their day-today work.STAT E Respondents from Western Australia reported the highest mediantotal package at 155,700, followed by the ACT at 153,181 andTasmania with 142,499. The Northern Territory and Tasmania performed the strongest interms of wage growth, with average salary movements of 4.8 and3.3 per cent respectively. The survey found that accreditation in the form of RPEng,CPEng or RPEQ delivered a premium of 24.7 per cent higherremuneration. Respondents holding an accreditation reporteda median total package of 157,850, compared with 126,625among those respondents not holding an accreditation.8 Professional Engineers Employment and Remuneration Report 2020/21
WORKPLACE ISSUESSEC TOR 50.0 per cent of public sector respondents saw an increasinglack of in-house engineering capacity as a major issue in theirworkplace over the last 12 months, compared with 24.6 of privatesector respondents. A sector comparison shows that the public sector marginallyoutperformed the private sector in terms of wage growth,delivering a 2.4 per cent increase compared with an increase of2.3 per cent for the public sector. 45.9 per cent in the public sector saw poorly scoped or designedprojects as an issue impacting their workplace compared with38.0 per cent in the private sector. Public sector respondents reported a slightly higher median totalpackage at 139,921 compared with 136,061 for the privatesector. Insufficient skills development was seen as a factor affectingengineering workplaces by a similar number of public and privatesector respondents at 49.7 and 46.1 per cent respectively. A lack of engineers in decision-maker roles was reported asa serious workplace issue by 38.5 per cent of public sectorrespondents, compared with 19.4 per cent of private sectorrespondents. Survey respondents confirmed changes in staff morale and levelsof fatigue in their workplaces with 40.0 per cent of respondentsreporting that staff morale at their workplace had declined inthe previous 12 months and 39.2 per cent reporting that workerfatigue had increased. 25.2 per cent of public sector respondents said their organisationdid not actively regard engineering capability as a source ofinnovation compared with 11.2 per cent of engineers in theprivate sector. Respondents ranked job satisfaction, remuneration, job securityand work/life balance as their top four work priorities. Workplace stress and poor workplace management were the mainfactors negatively affecting respondents' mental health.WOMEN INENGINEERING 50.9 per cent of female respondents reported that they hadexperienced discrimination on the basis of gender. While 81.7 per cent of respondents said their employer had inplace formal policies to deal with discrimination and 75.3 percent said their employer had in place formal policies to promotediversity, 12.8 per cent said that their employer did not havestrategies in place to actually implement the policies. 32.5 per cent of female respondents reported having experiencedsexual harassment in the course of their employment comparedto 1.9 per cent of male respondents.Professional Engineers Employment and Remuneration Report 2020/21 9
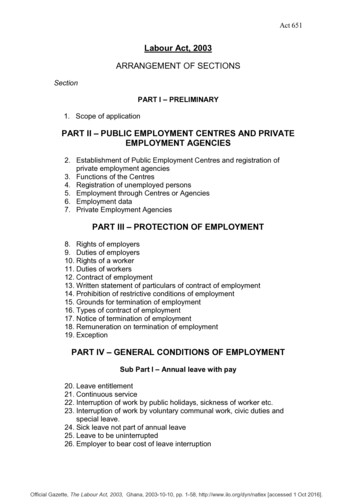
ENGINEERR E M U N E R AT I O NOver the 12 months to end May 2020, engineering remuneration continued its trend of growth, withwages rising steadily at a similar rate to that reported last year. Salaries across each industry increased tovarying degrees, with the median salary across the profession increasing by 2.4 per cent - 2.3 per cent inthe private sector and 2.4 per cent in the public sector, outpacing the Wage Price Index (WPI)9 at 2.1 percent. Engineering salaries marginally outperformed the Consumer Price Index (CPI)10 over the past year,which increased by 2.2 per cent.This result indicates engineering salaries has remained ahead of the cost of living. The March 2020 CPIfigures include the first effects of COVID-19 and are notably increased from the March 2019 result of1.3%. Prices may continue to rise faster than they have in the past, particularly in response to emergencyfiscal policy. While engineers are well positioned to weather the effects of the pandemic, they will not beimmune to the effects on wages and income.For a more comprehensive report on the initial employment impacts of the COVID-19 pandemic onprofessional engineers, visit the APEA website at andemic-engineers-report.Figure 1 - Median percentage increase in salaries by sector of 2.4%All PrivateAll Public2.1%2.4%2.2%0.5%0.0%All OtherWPI (Mar '20) CPI (Mar '20)All Sectors10 Professional Engineers Employment and Remuneration Report 2020/21
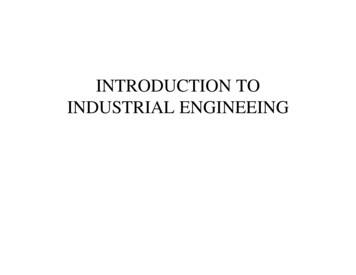
Wage growth by industryGrowth in salaries across the engineering profession is closely linked to the performance and strength ofeach industry.Strong wage growth in Education and training is explained by the experience engineers in that field haveand the ongoing strength of demand for employment in the industry to the point this snapshot wastaken.Wages growth in Consulting and technical services was strong reflecting large-scale investment intransport infrastructure and renewable energy projects in the last 12 months. Consulting Engineershave expressed concern about project delays for a range of reasons including site shutdowns, domesticand international supply chain interruptions and bottlenecks, shortages of equipment and materialsand travel restrictions but it is likely stimulus measures will support this industry as a means of drivingeconomic recovery over the coming 12 months.Figure 2 - Median percentage increase in salaries by industryEducation and Training3.4%2.7%Consulting & Technical ServicesOther Transport, Postal and Warehousing2.6%Mining (inc. Oil/Gas extraction)2.6%Water, Sewerage and Drainage2.5%Rail2.5%Road2.5%Information Media and Telecommunications2.4%Public Administration and 7%Manufacturing1.5%Gas essional Engineers Employment and Remuneration Report 2020/21 11
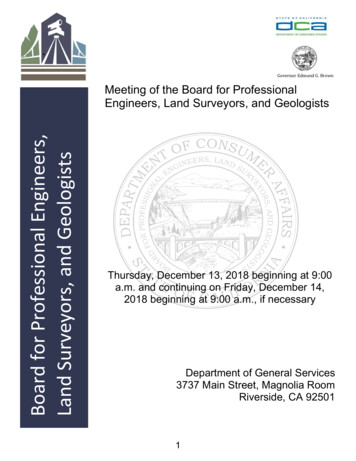
Average wages by industryRespondents in Education and training reported the highest total remuneration package ( 203,954),followed by engineers in Gas supply ( 191,625) and Information media and telecommunications( 171,804). While engineers in Gas supply reported the second highest overall wages, they also reportedthe lowest wage growth of 1.5 per cent (see Figure 2). Education and training’s comparative strength inboth pay levels and pay growth are likely the result of the experience engineers employed in that fieldhave, moving into lucrative teaching roles within tertiary institutions.Conversely, engineers in Defence reported the lowest median total packages ( 115,263), a concern givenlower wage growth in this industry despite its importance to Australia. Manufacturing was also low inboth total packages and wage growth ( 126,272, 1.5 per cent), but with the focus on manufacturing asa potential source of recovery from the COVID-19 crisis there may be an opportunity for growth in thefuture.Figure 3 - Median base salary and total package by industry 170,000Education and TrainingGas Supply 203,954 155,000Information Media andTelecommunications 191,625 148,679 171,804 140,000Electricity 164,450 135,000Mining (inc. Oil/Gas extraction)Rail 125,815 158,775 146,899Public Administration and Safety 118,000 138,262Other Transport, Postaland Warehousing 120,000 136,879Construction 110,000Road 112,948 131,400Consulting & Technical Services 114,842 131,400Water, Sewerage and Drainage 110,000 130,415Manufacturing 112,192 136,000 126,272 103,000Defence 0K 50K 115,263 100KBase Salary 150K 200KTotal Package12 Professional Engineers Employment and Remuneration Report 2020/21
Differences in pay reported by industry are influenced by both remuneration levels and the distributionof respondents across responsibility levels. Table 2 below provides a breakdown of salaries by industry aswell as responsibility level for further reference. Responsibility level definitions can be found in the Aboutthe survey section.Table 2 - Median base salary and total package by industry and responsibility levelLEVEL 1LEVEL 2LEVEL 3LEVEL 4LEVEL 5ABOVE LEVEL OTALPACKAGEBASESALARYTOTALPACKAGEConsulting & TechnicalServices 67,000 73,365 80,000 89,539 106,000 121,545 135,000 159,229 174,039 202,626 225,000 246,375Construction 72,302 82,241 85,500 93,623 100,228 129,244 138,542 167,477 172,500 219,864--Mining (inc. Oil/Gasextraction) 82,000 89,790 81,000 88,855 130,275 153,300 159,932 184,200 159,000 194,848--Electricity 87,078 96,808 100,156 116,070 135,657 157,445 151,400 176,480 192,843 230,447--Gas Supply------ 180,000 202,575----Water, Sewerage andDrainage 67,653 74,080 87,756 98,540 110,000 138,375 127,700 145,293 156,723 193,410--InformationMedia andTelecommunications---- 110,000 123,200 160,000 193,090---- 71,400 78,183 85,000 93,130 106,000 116,070 142,544 162,353 175,000 216,425------ 102,500 113,833 118,000 138,336 145,813 199,616--Road 69,500 76,103 102,500 116,009 107,524 124,968 118,438 139,220 162,000 186,150--Rail 68,298 77,897 90,500 103,348 120,000 137,635 151,150 170,826 194,500 214,042--Other Transport,Postal andWarehousing-- 90,000 98,550 124,400 137,414 129,000 160,694----Education and Training------ 143,478 169,774 180,000 212,054-- 70,000 76,775 83,000 93,349 101,857 128,115 130,920 153,035 164,250 185,603------ 97,500 111,763 121,325 132,851---- 70,000 76,900 85,000 94,972 112,598 132,920 140,000 163,155 174,039 206,517 216,000 251,988DefencePublic Administrationand SafetyManufacturingOtherAll industriesProfessional Engineers Employment and Remuneration Report 2020/21 13
DISCIPLINEAverage annual total packages were highest for engineers qualified in the Geological and Manufacturingdisciplines but low responding in these categories limit the drawing of any serious inferences. Totalpackages were lowest for those qualified in the Structural discipline where there was substantialresponding.Figure 4 - Median annual base salaries and total package by engineering discipline 176,295 160,250GeologicalManufacturing 166,600 140,000Electrical 149,456 130,000 126,000BiomedicalAeronautical 116,000Civil 114,000Information Technologyand Communications 120,000 137,970 137,020 133,715 132,969Electronics 115,003 132,794Systems 115,000 132,250Mechanical 110,000 131,400Chemical 109,012 130,642Environmental 110,000Mechatronics 127,913 123,530 105,500 121,981 110,428MaterialsNaval Architecture 105,000 114,975Structural 101,500 114,874 0K 20K 40K 60K 80K 100K 120K 140K 160K 180K 200KBase SalaryTotal Package14 Professional Engineers Employment and Remuneration Report 2020/21
Average annual salary movements were greatest for engineers qualified in the Mechatronics andAeronautical disciplines with increases of 4.9 and 4.2, per cent respectively. These were followed byEnvironmental engineering at 2.7 per cent.Movements were lowest in the Systems, Geological and Information technology and communicationsdisciplines with movements of 0.0, 1.3 and 1.5 per cent respectively.Figure 5 – Median annual percentage base salary movements by engineering calMaterials1.8%Electronics1.8%1.5%Information Technologyand %3.0%4.0%5.0%6.0%Professional Engineers Employment and Remuneration Report 2020/21 15
STAT EIn 2020, the respondents from Western Australia reporting the highest median total package at 155,700, followed by the ACT at 153,181 and Tasmania with 142,499.Annual salary movements were greatest in the Northern Territory and Tasmania with growth of 4.8 and3.3 per cent respectively.The extent of the impact and recovery will depend on factors such as the number of cases, the size of thepopulation, the size of cities and degree of urbanisation, whether the state has large older or indigenouspopulations, the concentration of workers in at-risk occupations and industries such as tourism, thesuccess of lockdown measures, the extent and impact of stimulus measures, the extent to which thestate relies on overseas arrivals and/or international students for growth, the extent to which the statepublic sector can provide a floor to job losses, the state of the state's economy prior to the crisis and theimpact on markets for particular state-manufactured products and services.11Figure 6 - Median total package and percentage increase in salary by stateNT 127,6054.8%ANNUAL GROWTHWA 155,7001.8%ANNUAL GROWTHQLD 134,6851.9%ANNUAL GROWTHSA 135,6262.3%ANNUAL GROWTHNSW 139,6232.5%ANNUAL GROWTHVIC 134,2632.2%ANNUAL GROWTHACT 153,1810.0%ANNUAL GROWTHTAS 142,4993.3%ANNUAL GROWTH16 Professional Engineers Employment and Remuneration Report 2020/21
SEC TORThere was very little difference in the performance of participants from the public and private sectorin 2020 in terms of median base salary, total package and salary growth. Private sector respondentsreported increases of 2.3 per cent compared to 2.4 per cent in the public sector (see Figure 1). Publicsector respondents reported a median total package of 139,921, compared to 136,061 in the privatesector.Figure 7 - Median base salary and total package by sector 145,000 115,000 138,336 120,000 120,000 125,000 139,921 130,000 136,061 118,000 135,000 120,000 140,000 110,000 105,000All PrivateAll PublicBase SalaryAll SectorsTotal PackageDifferences between the remuneration of participants in the private and public sector were muchmore apparent looking across standard levels of responsibility (see About the survey section for leve
to ensure that professional engineers were recognised and rewarded for the high-value work they do. The Professional Engineers Case, finalised in 1961, saw engineers across Australia receive salary increases averaging more than 40 per cent. Even more importantly it set the precedent for work value and benchmark salaries for professionals.