Transcription
pulmonary Research and respiratory medicinEISSN 2377-1658Research*Corresponding author:Susan E. Douglas, PhDNational Research Council Halifax1411 Oxford Street HalifaxNS B3H 3Z1, CanadaE-mail: susan.douglas@nrc-cnrc.gc.caOpen arison of Next-Generation SequencingPlatforms for Clinical Testing of Non-Small CellLung CancerRama K. Singh, Susanne Penny and Susan E. Douglas*Volume 2 : Issue 3Article Ref. #: 1000PRRMOJ2116National Research Council Halifax, 1411 Oxford Street Halifax, NS B3H 3Z1, CanadaArticle History:ABSTRACTReceived: May 20th, 2015Accepted: July 13th, 2015Published: July 15th, 2015Citation:Singh RK, Penny S, Douglas SE.Comparison of next-generation sequencing platforms for clinical testingof non-small cell lung cancer. PulmRes Respir Med Open J. 2015; 2(3):97-108.Personalized treatment of lung cancer using therapies that target activating oncogenicmutations such as EGFR and ALK has become the standard of care. Current molecular testingis routinely performed for single genes and increasingly in a multiplex format. However, thescarcity of sufficient biopsy material has necessitated a more high-throughput and comprehensive testing approach. Next Generation Sequencing (NGS) offers great promise as a highlysensitive method of detection for a variety of biopsy sources (tissue, blood, pleural effusions).However, there are multiple NGS platforms and panels with varying advantages and disadvantages.This pilot study compared four different library construction methods (Ion AmpliSeq,Illumina TruSeq, and Raindance Thunderbolts amplicon-based methods and Roche EZSeq sequence capture method) and two different sequencing instruments (Ion Torrent PGM and Illumina MiSeq). A common set of ten tumor/normal pairs from lung adenocarcinoma patientswere analysed by all platforms. Additional samples were analysed in subsets of the platforms.To assess the feasibility of sequencing circulating free DNA (cfDNA) from plasma and pleuraleffusions, two additional samples were analysed on two amplicon-based platforms. A bioinformatic pipeline for automated sequence data analysis was developed using the Galaxy environment. To determine the most cost-effective, technically streamlined library constructionand sequencing method, we compared coverage statistics, sensitivity, variant detection, andworkflow for all platforms.KEYWORDS: Adenocarcinoma; Non-small cell lung cancer; Personalized medicine; Mutational analysis; Pleural effusion; Circulating free DNA; Next generation sequencingABBREVIATIONS: cfDNA: circulating free DNA; FFPE: Formalin-fixed paraffin-embedded;GUI: Graphical User Interface; NGS: Next Generation Sequencing; NSCLC: Non-small celllung cancer; PE: Pleural Effusion; PCR: Polymerase Chain ReactionNote: All gene names are abbreviated according to the Human Genome Nomenclature Committee.INTRODUCTIONCopyright: 2015 Douglas SE. This is anopen access article distributedunder the Creative Commons Attribution License, which permitsunrestricted use, distribution, andreproduction in any medium, provided the original work is properlycited.Pulm Res Respir Med Open JLung cancer remains the leading cause of cancer-related death worldwide, accountingfor 1.59 million of the 8.2 million total cancer deaths each year.1 Non-small cell lung cancer(NSCLC) accounts for 80% of all lung cancers and adenocarcinoma, the main histologicalsubtype, has frequently already metastasised when detected. As standard single-site biopsy ofthe primary tumor may not capture intratumor heterogeneity or the genetic makeup of metastatic lesions, such testing can lead to inaccurate prognosis and treatment strategies.2,3 Availabilityof tissue biopsy in the majority of cases is limited and in some cases cannot be performed, thusreducing the likelihood of successfully monitoring therapeutic response. The use of alternativePage 97
pulmonary Research and respiratory medicinEISSN 2377-1658Open Journalsources of biopsy material that reflect tumor heterogeneity andthe metastatic state, such as readily available blood4 or PleuralEffusions (PE),5 may provide valuable information.There is an urgent need for sensitive methods for assessing mutational status from small biopsy samples for prognosis and predicting response to therapy as well as progressionof lung adenocarcinoma. Next generation sequencing (NGS) offers attractive prospects, including the ability to simultaneouslyinterrogate hundreds of mutational hotspots with high accuracyand sensitivity from limited amounts of genomic DNA from avariety of tumor sources. Major improvements in sequencingtechnology such as increased read length and accuracy have resulted in dramatic cost reductions, making NGS more affordable.Protocols for isolation of amplifiable DNA from Formalin-fixedparaffin-embedded (FFPE) samples6 and the small amount ofDNA available from fine-needle aspirates7 have also improved.NGS is particularly valuable when solid tumor biopsies cannotbe obtained but sampling of circulating free DNA (cfDNA) inplasma or pleural effusions is possible.8,9 Genetic alterationscommonly found in thyroid cancer can be detected in cfDNAand have proved very useful in diagnosis from fine-needle aspirate biopsies that gave cytologically indeterminate results.10,11For the clinical lab, NGS allows one single test on asingle platform irrespective of cancer type or biopsy source.12Alternatively, customized panels can be designed that focus oncancer type-specific mutations, eg. ThyroSeq for thyroid cancer.13 Panels can be relatively small (20-30 Kb capture size) thatfocus on well-studied mutation hotspots or much larger panels(several hundred Kb to a few Mb) that encompass mutations forwhich therapeutics are in the pharmaceutical pipelines as well asgenomic sites that are frequently mutated and may be of clinicalor pharmacodynamic relevance.14,15Mutation analysis of NGS raw sequence data involvesa complicated series of processes that can be divided into twomain parts: alignment and variant calling. Alignment involvesaligning the tumor and normal sequence reads to a human reference genome, a number of post-processing steps including realigning sequences around insertion and deletions (where misalignment is likely), recalibrating instrument quality scores andgathering quality metrics. Variant calling includes comparingthe normal, tumor and reference sequence to look for possiblevariants, filtering these variants based on quality, clinical significance or other parameters and finally, annotating the mutation. Although commercial tools are available for NGS mutationanalysis, they are costly and often involve storing data in a cloudenvironment, which may be prohibited for clinical patient data.Therefore, locally installed, open source tools are a desirable option. However, it is also essential to have an analysis pipelinethat is accessible to clinicians and scientists with no programming knowledge. Galaxy16 is an open, web-based workbenchthat provides a framework for building pipelines for computational analyses of genomic data. Galaxy pipelines are secure,accessible, reproducible and transparent. Galaxy can be installedPulm Res Respir Med Open Jhttp://dx.doi.org/10.17140/PRRMOJ-2-116locally to protect sensitive data. Once open sources tools havebeen installed into the Galaxy framework and a workflow hasbeen designed, users access the pipeline through an easy to useGraphical User Interface (GUI). Provenance tracking is automatic; metadata such as inputs, parameters and outputs for eachtool used are stored and easily accessed through the GUI. Galaxy’s web-based model allows easy sharing of datasets, historiesand workflows.BHere we report a pilot study that compared four different library construction methods and two different sequencing platforms. 48 samples (22 tumor/matched normal pairs, onetumor only sample plus two controls) were compared across IonAmpliSeq and Roche SeqCapEZ. Due to lack of DNA for fourof these samples, they were replaced by four samples from bloodand PEs for analysis by Illumina TruSeq. Finally, upon acquisition of a Raindance digital droplet Polymerase Chain Reaction(PCR) instrument, a subset of 22 samples for which sufficientDNA remained plus two samples of cfDNA from plasma and aPE were analysed using this technology for library construction.A bioinformatics pipeline for sequence quality checking, alignment, post alignment processing, variant calling and annotationwas developed within the Galaxy framework. The advantagesand disadvantages of each method in our hands are discussed.MATERIALS AND METHODSSample InformationPatient FFPE-preserved tumor biopsy samples andmatched normal lung tissue were obtained from the ClinicalDiagnostics Laboratory at Capital District Health Authority(CDHA; Halifax, NS, Canada). In addition, plasma from onepatient, PE from one patient (both the cell pellet and cfDNA),whole blood from one patient and two control samples containing known amounts of cell lines harbouring mutations of interest (Supp Tables 1 and 2) were also analysed. Cell lines H1650,H1781, H1975, A549 and SW948 were obtained from the American Type Culture Collection and propagated as recommended.Cell line H3122 was a kind gift from Dr. Jeffrey Engelman,Massachusetts General Hospital, Boston, MA. Cell line HCC78was obtained from Dr. John D. Minna (The University of TexasSouthwestern Medical Center, Dallas, TX). This study was approved by the Capital Health Research Ethics Board (CDHARS/2013-090), and all participating individuals signed informedconsent.DNA Preparation and Quality ControlDNA was prepared for mutational analysis in the Clinical Diagnostics Laboratory at CDHA as described.17 DNA from22 tumor/matched normal pairs and one tumor only sample withknown mutational statuses as determined by multiplex SNaPshot analysis and a quadruplex sizing assay and for which therewas at least 1 mg of DNA available were chosen for analysis(Supp Table 1). DNA was sheared at the Genome Quebec/Mc-Page 98
pulmonary Research and respiratory medicinEISSN 2377-1658Open JournalGill Innovation Centre using an Adaptive Focused Acoustics ultrasonicator (Covaris, Woburn, MA, USA). PEs were obtainedand processed within 2 to 4 h after thoracocentesis. The sampleswere centrifuged at 1,000 rpm for 10 min and cell pellet andsupernatant were saved and frozen at -20 ºC.cfDNA was prepared from 3 mL of plasma and 10 mLof PE supernatant using the QIAamp Circulating Nucleic Acidkit (Qiagen, Mississauga, ON, Canada). DNA was preparedfrom the PE cell pellet derived from 10 mL of PE and from 400µL of whole blood using a QIAamp DNA Mini and Blood MiniKit (Qiagen). DNA from the PE cell pellet and the whole bloodwas sheared by passing it through a 26-guage needle.Double-stranded DNA from all samples was quantified using a Qubit 2.0 Fluorometer (Invitrogen, Burlington, ON,Canada) and DNA quality was determined using a Kapa hgDNAQuantification and QC kit (Kapa Biosystems, Boston, MA,USA) and a LightCycler 480 (Roche Applied Science, Laval,QC, Canada) according to the manufacturers recommendations.DNA library preparation and next generation sequencing rocheEZSeq custom capture (EZ): A custom SeqCap EZ Choice li-brary (Roche Nimblegen) was designed to capture 211,652 Kbof DNA sequence from 863 amplicons in 94 genes that are oftenmutated in solid tumors. This custom design included all of thegenes present in the other three panels as well as 14 introns from5 genes (ALK, BRAF, NTRK1, RET, and ROS1) in which translocations commonly occur (Supp Table 3). The custom captureand library preparation were performed by the Genome Quebec/McGill Innovation Centre (Montreal, QC, Canada). Briefly,libraries were prepared from 250 ng of sheared DNA from 22tumor/matched normal pairs, one tumor only sample, and twocontrol cell line mixtures (Supp Table 1) using the Kapa HTP Library Preparation kit (Kapa Biosystems). Two sets of barcodedlibraries of 24 samples each were generated. DNA end-repair,A-tailing, ligation of TruSeq indexed adapters (Illumina), andamplification were performed according to the supplier’s protocol. The libraries were quantitated using a Qubit 2.0 Fluorometeras well as by quantitative Polymerase Chain Reaction (qPCR)using the Kapa Library Quantification kits (Kapa Biosystems).The libraries were also checked on a BioAnalyzer to assess theaverage insert size. Equal amounts of each set of 24 librarieswere pooled and 1 mg of multiplexed DNA library pool washybridized to the SeqCap EZ library together with Hybridization Enhancing (HE) oligonucleotides as described in the RocheSeqCap EZ protocol. After amplification of the captured multiplexed DNA library pools, each pool of 24 libraries was runon a separate MiSeq at the Genome Quebec/McGill InnovationCentre using 150 bp paired end runs.Ion AmpliSeq (IT): Targets were amplified from the same samplesas above by 20 cycles of PCR using the Ion AmpliSeq CancerHotspot Panel v2 (Life Technologies, Burlington, ON, Canada)and the Ion AmpliSeq Library Kit 2.0 with 10 ng of input DNAaccording to the supplier’s protocol with the following modifica-Pulm Res Respir Med Open Jhttp://dx.doi.org/10.17140/PRRMOJ-2-116tions. Forty-eight samples were processed in three sets of sixteensamples each. In order to assess whether per sample sequencingcost could be reduced without detrimental effects on sequencequality and output, for two sets of samples one-fourth, and forone set one-half, reagent volume from AmpliSeq Library Kit 2.0was used. Primer sequences were partially digested and amplicons were phosphorylated with the FuPa reagent, and then barcoded using Ion Xpress Barcode Adapters (Life Technologies).After removal of the excess adapters from unamplified libraries using AMPure XP Reagent (Beckman Coulter, Mississauga,ON, Canada), libraries were amplified for 7 cycles and equalizedusing the Ion Library Equalizer Kit (Life Technologies). Equalvolumes of 16 libraries were combined resulting in three sets of16 pooled libraries and automated template preparation was performed on an Ion OneTouch 2 system using Ion PGM Template0T2 200 Ion Sphere particles (IPS) and the Ion OneTouch Template OT2 kit (Life Technologies). Each set of 16 libraries wasenriched for template-positive Ion PGM Template 0T2 200 ISPon the One Touch ES system and sequenced on a separate 318chip using an Ion PGM Sequencing 200 kit v2 (Life Technologies). All procedures were performed at the Genome Quebec/McGill Innovation Centre.Illumina TruSeq (TS): Targets were amplified from all of thesame samples as above except for four (1, 8, 21, and 23) forwhich no DNA remained (Supp Table 1). Instead, four samplesderived from blood or PE were included to test the feasibility ofusing cfDNA. Libraries were prepared at NRC Halifax from 250ng DNA following the TruSeq Amplicon Cancer Panel librarypreparation guide Rev. A, April 2012. Briefly, DNA sampleswere hybridized with the primer pool, purified from unboundprimers on the Illumina Filter plate by washing, and then boundoligos were extended and ligated by incubation at 37 C. Afteraddition of barcoding adapters and common adapters for clustergeneration by polymerase chain reaction (PCR) a 5 µL aliquotfrom control and selected samples were run on 4% gel to confirm library amplification and expected fragment size. Libraries were purified using AMPure XP Reagent (Beckman Coulter)and were normalized using library normalization beads (Illumina), pooled in equimolar amounts and quantitated by qPCR. Thepooled library was diluted 100-fold in chilled HT1 buffer to 11pM and loaded into the MiSeq V2 reagent cassette for 150 bppaired end runs.RainDance ThunderBolts (TB): Twenty-four samples (Supp Table 1) for which DNA still remained (LT/LN6, LT/LN10-18, cellline controls, PE supernatant and plasma) were used to constructthe libraries using the ThunderBolts Cancer Panel v7.1 (RainDance Technologies, Lexington, MA, USA). Libraries wereconstructed at NRC Halifax using the Thunderbolts Cancer Panel Consumables Pack according to the supplier’s protocol. Foreach sample, two separate reactions were set up for droplet generation. Each primer pool set was mixed with 50 ng DNA, 2XGenotyping Master Mix (Life Technologies), droplet stabilizerand transferred to the RainDrop chip (8 reactions/chip). Dropletswere generated in the RainDrop digital PCR source instrumentPage 99
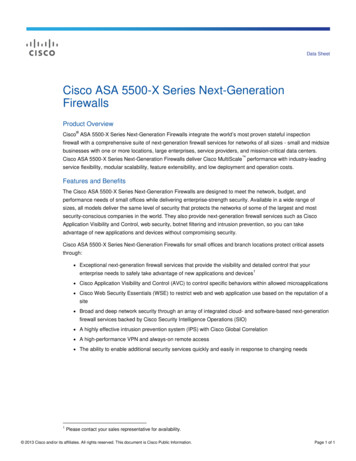
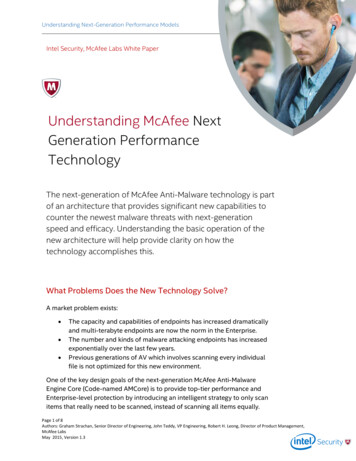
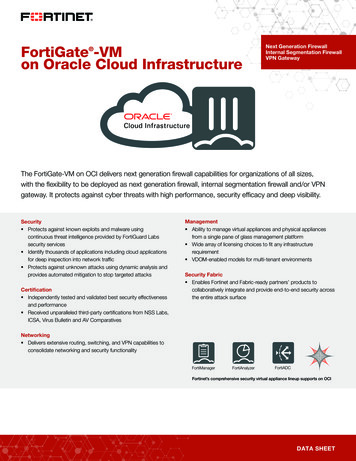
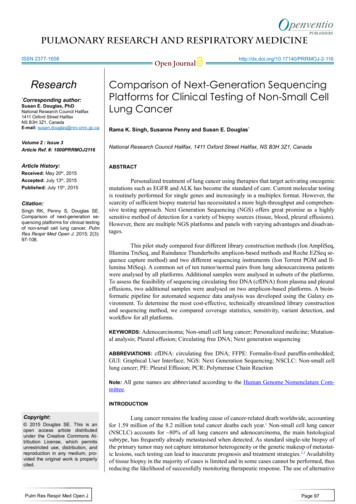
pulmonary Research and respiratory medicinEISSN 2377-1658Open Journal(RainDance Technologies), transferred to a 96-well PCR block,and amplified by PCR for 55 cycles using the ThunderBoltsCancer Panel 1st PCR cycling conditions. After purification using AMPure XP Reagent (Agencourt), Illumina bar-coded primers (Integrated DNA Technologies, Coralville, IA, USA) wereadded to each library pair by PCR for 10 cycles. After purification using AMPure XP Reagent (Agencourt), library pairs werequantitated on a Bioanalyzer (Agilent). Total product yield wascalculated for each pair and the samples were diluted to 2 nM.Equal portions of each 2 nM library were pooled, diluted to 1nM, and denatured with 0.2 N NaOH. Pooled and denatured library was diluted to 8 pM with chilled HT1 buffer (Illumina),and loaded into a MiSeq V2 reagent cassette with Raindancecustom sequencing primers as described in the ThunderBoltsCancer Panel Protocol for Illumina MiSeq run.http://dx.doi.org/10.17140/PRRMOJ-2-116normal sample with the TruSeq panel as there was insufficientDNA remaining. In these cases, a randomly chosen normal sample (LN13) was used to generate the variant files.RESULTS AND DISCUSSIONSequencing MetricsSequencing metrics for all samples run on the four platforms (EZ, IT, TS and TB) are available in Supp Table 4A-4C.Metrics were calculated using Picard tools as described in Methods. For the ten tumor/matched normal pairs and two controlsthat were run on all four platforms, comparative data are shownin Table 1 and discussed in depth below.Mean Target Coverage and 100X Coverage of Target BasesData AnalysisAll sequence files were processed using a custom Galaxy (http://galaxyproject.org) bioinformatics pipeline (Figure1). FASTQ files were aligned to build 37 of the human referencegenome (hg19) using the bwa-mem18 algorithm (for Ion Torrentsequences the following were changed from default values: -O7, -E 2, -L 2). Alignment files were sorted with Picard Toolsv1.129, realigned and recalibrated using GATK.19 Pileup fileswere built using SAMtools mpileup20 (-d 10000, -q 30, -Q 20).Metrics were calculated using Picard’s CollectMultipleMetrics,CollectTargetedPcrMetrics and CalculateHsMetrics (http://picard.sourceforge.net). Variants were called with Varscan21,22(http://varscan.sourceforge.net) using the default settings (except tumor-purity was reduced from 1 to 0.6) for clinical samples. For cell line controls, the min-var-freq was reduced from0.1 to 0.02 since some of the mutations were present at lowfrequency. Translocations were analysed using BreakDancer.23Annotation and filtering was performed using VariantDB24 orVarSeq (Golden Helix, Bozeman, MT). In four cases, (Samples1, 8, 21 and 23) sequence data was not obtained from a matchedAll of the platforms gave the predicted depth of coverage, taking into account the size of the panels and the outputfrom the sequencers. The Thunderbolts platform gave the highest depth of target coverage whereas the EZSeq library gave thelowest (Figure 2A). However, the panel size was much higherfor the EZSeq library (211 Kb vs. 30-37 Kb for the other panels).A single MiSeq run with the Version 2 chip is predicted to giveapproximately 5.7 Gb of sequence, which would give depth ofcoverage for 48 samples with the 210 kb EZSeq panel and twoMiSeq runs of approximately 840X, 48 samples with the 35 kbTruSeq panel and one MiSeq run of 2600X, and 24 samples withthe 30 Kb Thunderbolts panel and one MiSeq run of 5970X (correcting for approximately 85% enrichment efficiency and 90%mappable reads). This is very close to what we obtained (522X,2975X and 4829X, respectively).Although the EZSeq platform resulted in lower reads,it captured a much larger target and thus more sequence information including potential translocation breakpoints (usually inintrons), and was customizable. However, it will require moreFigure 1: A schematic of the NGS mutation analysis pipeline including alignment, post-alignment processing, variant calling, annotation/filtering, and visualization tools.Tools shown in green are accessed from the Galaxy webinterface; tools in blue are accessed outside of Galaxy. Inputs and outputs are shown in purple.Pulm Res Respir Med Open JPage 100
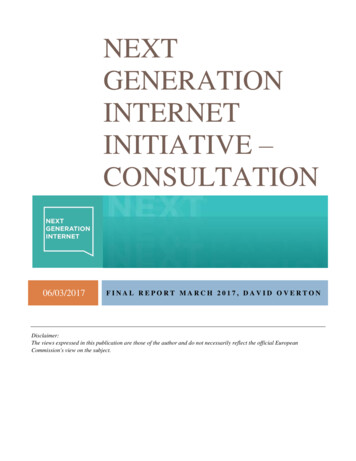
pulmonary Research and respiratory medicinEISSN 2377-1658sequence runs (and therefore cost) to provide sufficient coveragefor accurate mutation calling.Thunderbolts, Ion AmpliSeq and EZSeq panels allhad similar median % coverage of target bases at 100X (98.45100%) whereas the TruSeq panel gave consistently lower values(92.96%). In addition, the median % zero coverage targets was0.5% for TruSeq whereas it was virtually zero for the other platforms. For the TruSeq panel, however, twice as many sampleswere run per MiSeq run and this could have contributed to thelower % coverage of target bases.Three samples (LN1, LN8 and LN21) had limiting amounts of DNA and gave significantly lower total readswith the EZSeq and Ion AmpliSeq panels (Supp Table 4), andhigher % zero coverage targets. Previous studies have also reported that samples with marginal DNA yields underperformedin NGS assays compared to those with adequate DNA.15 Onesample (LN14) gave only about one tenth the number of totalreads compared to the other samples with the Thunderbolts panel. However, the percent of reads that aligned to the referencegenome and the error/indel rates were no different from othersamples with high read counts (98-99%).Reducing the amount of reagent used for the Ion AmpliSeq library construction did not result in any appreciable reduction in mapped reads, mean depth or percent on target reads(data not shown). In fact the two libraries where only ¼ reagentamounts were used had marginally superior metrics than the library in which ½ reagent amounts were used. It is possible thatsignificant cost savings could be achieved if this finding is borneout in a larger study.Coverage for samples from the PE pellet and plasmathat were sequenced using the TruSeq and Thunderbolts panels also gave significantly lower total reads than those thatwere derived from FFPE and a lower percentage of these readsaligned to the reference genome (94% and 82%, respectively, forTruSeq; 90% for Thunderbolts) and to the amplicon targets at 100X coverage (79 and 73%, respectively, for TruSeq; 99.9%for Thunderbolts). Interestingly, cfDNA isolated from the PE supernatant had comparable total reads but the percentage of readsaligned to the reference genome and to the amplicon targets at 100X coverage was lower for TruSeq (93%). Whole blood performed comparably to other samples for all metrics, confirmingthat blood serves as a good patient matched control for the tumorbiopsy material.(55) used in the generation of the Thunderbolts libraries; optimisation of conditions such as reducing the number of PCRcycles may improve the error rate for this panel. However, only27 cycles of PCR were used for the TruSeq libraries so it is possible that there are other underlying causes for the higher errorrate. Strand-specific sequencing errors as described in Simen, etal.12 were seen in multiple samples and on different instruments.Errors generated during PCR steps of library preparation aremost frequent in amplicons with low coverage and with samplesof low quality. Single nucleotide misincorporation at an earlystage results in over-representation in the final library. Sequencing samples in duplicate can distinguish real mutations from amplification errors, although this adds to the cost of the assay.12Indel RatesIndel rates were low for all platforms except the IonAmpliSeq (Figure 2C), which had indel rates approximately tenfold higher (0.19% vs. 0.01-0.03%). Many of the indels occurredin homopolymer tracts of four or more identical bases, a phenomenon which has been noted commonly.25ChimerasThe percent chimeric reads could be calculated for allMiSeq paired end reads but not the single reads from the IonTorrent instrument (Table 1). The Thunderbolts platform had asignificantly lower number of chimeric reads (0.04% comparedto 0.19% and 0.47% for the TruSeq and EZSeq platforms, respectively). This advantage could be due to the picolitre-sizeddroplets generated during the Thunderbolts library construction;where each droplet only contains one template, there would beless opportunity for chimeric amplicons to be formed.All four platforms had acceptable error rates below0.5% (Figure 2B). Errors can result from the amplifcation reaction or from the sequencing chemistry itself. EZSeq and IonAmpliSeq libraries had error rates approximately half those ofThunderBolts and TruSeq libraries (0.23% and 0.19% vs. 0.48%and 0.47%). This could be due to the high number of PCR cyclesVariableThunderBoltsEZSeqAmpliSeqTruSeqInput DNA (ng)10025010250Capture size (Kb)302113735TimeshortestlongestmediummediumRuns1 MiSeq2 MiSeq3x3181 MiSeq24484848SamplesMetricsaError RatesPulm Res Respir Med Open Jhttp://dx.doi.org/10.17140/PRRMOJ-2-116Open Journalmean target coverage4829X522X1353X2975X%target bases 100X99.9398.4510092.960.53%zero coverage0 0 imeras0.040.47n/aCDHA concordanceexcellentexcellentGoodcell line lentMedian valuesMissed EGFR 19-DEL 24 bpNot consistent with other three platformsabcTable 1: Sequencing metrics calculated for ten sample pairs and two cell line controls run on allfour platforms.Page 101
pulmonary Research and respiratory medicinEISSN 2377-1658Open re 2: Median depth of coverage (A), error rate (B) and indel rate (C) obtained using four platforms. TB: Raindance Thunderbolts; EZ:Roche EZSeq; IT: Ion AmpliSeq; TS: Illumina TruSeq.Pulm Res Respir Med Open JPage 102
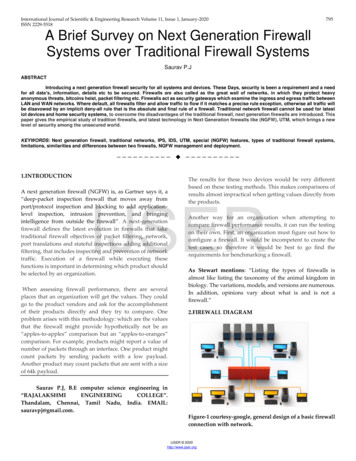
pulmonary Research and respiratory medicinEISSN en JournalMutation Detection and Congruence with SNaPshot and SizingMutational AnalysesWith one exception, all platforms detected the mutations identified by SNaPshot and sizing assays in all 23 tumorsamples (Table 2). The EGFR deletion in Exon 19 in sample9T was missed by Ion AmpliSeq but detected by EZSeq at lowfrequency (1.8%) and TruSeq at 15.8%. NGS was more informative than the SNaPshot and sizing assays in providing information on the sizes of the deletions in EGFR Exon 19 in samples1 and 9 and uncovering additional information on the nucleotide position of the KRAS mutations. The KRAS34 mutationidentified by SNaPshot in sample 11T was actually two KRASmutations in adjacent nucleotide positions 34 and 35 of codon12. These were found in all four platforms and occurred on different sequencing reads, indicating tumor heterogeneity ratherthan a double mutation in some clones (Figure 3). An actionableKRAS codon 13 mutation (c. 38G A) that is not included in theSNaPshot assay was identified in sample 14T at a frequency of39-55% by all four platforms (Figure 4).The allele frequencies were quite consistent acrossplatforms (Table 2) although in some instances, one platformIn addition to the mutations that were assayed in theClinical Diagnostics Laboratory, several others were identifiedusing NGS, the most common of which were in TP53 (SuppTable 5). These were found in eleven different tumors; the TP53p.R234L mutation was found in three separate tumors. Thep.Q61L mutation was detected in the HRAS gene, whereas inlung cancer it is normally found in the KRAS gene.Concordance with Cell Line controlsThe concordance of mutation detection in cell line controls by NGS is shown in Figure 5. The allele frequencies werequite consistent across platforms, although KRAS G12S andPIK3CA E542K were not detected using the EZSeq platform.The values from the EZSeq platform also deviated substantiallyin the cases of the EGFR Exon19 deletion, the HER2 insertionSampleMutationaIonTorrent%b1TEGFR 19-DELEGFR 19-DEL 9bp42.4EGFR 19-DEL 9bp28.5EGFR 19-DEL 9bp*29.3not not not not not donen/a6TKRAS 34KRAS G12C (c.34)33.7KRAS G12C (c.34)36.9KRAS G12C (c.34)38.0KRAS G12C (c.34)28.67TKRAS 35KRAS G12D (c.35)19.8KRAS G12D (c.35)23.2KRAS G12D (c.35)19.7not donen/a8TKRAS 34KRAS G12C (c.34)24.6KRAS G12C (c.34)16.6KRAS G12C* (c.34)23.8not donen/a9TEGFR 19-DELnegativen/aEGFR 19-DEL 24bp1.8EGFR 19-DEL 24bp15.8not anegativen/a11TKRAS 34KRAS G12A (c.35)21.8KRAS G12A (c.35)21.7KRAS G12A (c.35)24.2KRAS G12A (c.35)KRAS G12C (c.34)8.6KRAS G12C (c.34)4.8KRAS G12C (c.34)2.6KRAS G12C n/a12TcNegativeEZ Seqshowed a lower frequency from the other three. For example,the KRAS G13D mutation in sample 14T and the KRAS G12Cmutation in sample 15T were present at 39% and 19.4%, respectively, in the EZSeq platform whereas in the other three platforms, these mutations were present at 50-55% and iveKRAS G13D (c.38)50.0KRAS G13D (c.38)39.0KRAS G13D (c.38)54.6KRAS G13D (c.38)55.015TKRAS 34KRAS G12C (c.34)27.3KRAS G12C (c.34)19.4KRAS G12C (c.34)22.8KRAS G12C en/anegative17TKRAS 34KRAS G12C (c.34)29.9KRAS G12C (c.34)28.3KRAS G12C (c.34)27.0KRAS G12C (c.34)33.718TKRAS 34KRAS G12C (c.34)32.3KRAS G12C (c.34)28.0KRAS G12C (c.34)33.8KRAS G12C (c.34)31.2n/a19TNEGATIVEnegative
Illumina TruSeq, and Raindance Thunderbolts amplicon-based methods and Roche EZSeq se-quence capture method) and two different sequencing instruments (Ion Torrent PGM and Il-lumina MiSeq). A common set of ten tumor/normal pairs from lung adenocarcinoma patients were analysed by all platforms. Additional samples were analysed in subsets of the .