Transcription
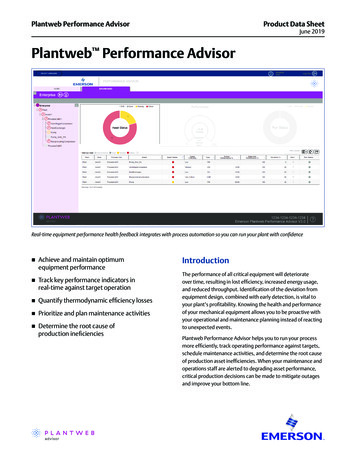
Plantweb Performance AdvisorProduct Data SheetJune 2019Plantweb Performance AdvisorReal-time equipment performance health feedback integrates with process automation so you can run your plant with confidence Achieve and maintain optimumequipment performance Track key performance indicators inreal-time against target operation Quantify thermodynamic efficiency losses Prioritize and plan maintenance activities Determine the root cause ofproduction ineficienciesIntroductionThe performance of all critical equipment will deteriorateover time, resulting in lost efficiency, increased energy usage,and reduced throughput. Identification of the deviation fromequipment design, combined with early detection, is vital toyour plant’s profitability. Knowing the health and performanceof your mechanical equipment allows you to be proactive withyour operational and maintenance planning instead of reactingto unexpected events.Plantweb Performance Advisor helps you to run your processmore efficiently, track operating performance against targets,schedule maintenance activities, and determine the root causeof production asset inefficiencies. When your maintenance andoperations staff are alerted to degrading asset performance,critical production decisions can be made to mitigate outagesand improve your bottom line.
Plantweb Performance AdvisorBenefitsPlantweb Performance Advisor calculates thermodynamicbased equipment performance using industry-standard ASMEPTC performance calculation techniques to facilitate KPIs andmetrics that can be compared to design/baseline to determine“deviation from design” diagnostics for your critical machinery,including turbines, compressors, boilers, pumps and otherproduction assets.Specific key performance indicators combined with cleargraphical operating plots show exactly where the equipmentis currently operating versus expected or design condition.Combining performance data with machinery condition,protection and prediction diagnostics helps your reliabilityprogram shift from reactive to proactive operation.Performance Advisor provides calculated information forcommon non-exhaustive key equipment types, such as: Compressors – Multi-stage, centrifugal and axial Compressors – Multi-stage, reciprocating Gas Turbines – Mechanical drive, generating Steam Turbines – Mechanical drive, generating Boilers Fired Heaters / Furnaces HRSGs Condensers – Air cooled, water cooled Pumps Cooling Towers Chillerswww.emerson.com/plantwebadvisorJune 2019Benefits for the Entire FacilityOperations: Receive real-time feedback of equipmentperformance to influence control changes and help meetoperational production targets.Maintenance: Experts access in-depth diagnostics tounderstand degradation trends and status by correlatingcondition and performance data.Process Engineers: Identify potential instrument problems,pinpoint degradation sources, and evaluate the effectivenessof cost improvement actions.Management: Understands financial impact of performancedeviations and how it impacts plant operation.Product DescriptionPlantweb Advisor SuitePlantweb Performance Advisor is part of the Plantweb suite ofintegrated applications that monitor the health, performanceand energy intensity for a site’s key production assets. ThePlantweb Advisor Suite includes the following applications: Performance Advisor – 1st principle thermodynamicmodeling comparing actual performance againstdesign expectations Health Advisor – Patented, statistical approach tocalculating asset health using equipment sensors aswell as process data Energy Advisor – Energy monitoring, consumptionmodelling, unit/area/site roll-up and tracking, and alertingfor overconsumption eventsThese solutions monitor the mechanical integrity of theassets and flag efficiency deviations that, if not acted upon,often result in an unplanned shutdown.2
Plantweb Performance AdvisorReal-Time EquipmentPerformance MonitoringThe real-time information available from PlantwebPerformance Advisor helps you pinpoint opportunitiesfor performance improvement that would otherwise gounnoticed. Differentiating features add value and knowledgeto equipment operation. Ability to apply KPI calculations retrospectively to viewhistorical machinery performance Data connectivity to any historian or DCS regardlessof vendor; gather data from multiple sources Intuitive graphical presentation clearly displays currentoperating point compared to design criteria in both timebased, and operating envelope plots Facilitates integration of protection, prediction,and performance information for a complete conditionand performance monitoring solutionFlexible Data ConnectivityPlantweb Performance Advisor receives measurement inputdata from existing field instrumentation, web-based data(such as weather information), and user data from manuallyentered values. Data can be collected from any manufacturer’sDCS or data historian using standard protocols. This flexibilitymeans that plants with multiple sources of input data andinformation systems can unify their performance calculationsin a single, centralized location.www.emerson.com/plantwebadvisorJune 2019Multiple UsersPlantweb Performance Advisor communicates specificdiagnostics aligned to plant roles. Operators obtain real-time feedback on setpointchanges to ensure optimal asset performance isachieved and maintained. Maintenance resources can identify impending conditionand/or performance issues and prioritize planned activities. Process Engineers can determine assets that are developingproblems and assess the cost of degradation vs. the costto repair.Results You Can TrustPlantweb Performance Advisor has been developed by expertsin applying thermodynamic models on-line and thereforeincludes features designed to handle common challengesusing real plant data. Key features include data validation andmanipulation functions, “sense testing” of calculated results,and proper filtering of inputs.Input Data ValidationPlantweb Performance Advisor evaluates the quality of DCS/historian input signals using data quality, expected rangetesting, and (alternative) data substitution techniques toensure the best data is used for the performance calculation.Equipment efficiency changes are often tracked down totenths of a percent, so good input measurements are essential.Plant data can be error-prone. When data is bad, PerformanceAdvisor can be setup to estimate from last good value, acalculated value, or a default value, ensuring the accuracyof the calculations and delivering reliable results. Suspectdata is highlighted to the user within the GUI.3
Plantweb Performance AdvisorAnalog Input FilteringNoisy data from on-line systems often creates issues,particularly for 1st principle, heat-and-material balancemodels. Plantweb Performance Advisor data integrity isensured through built-in analog input filtering and validationtechniques. Analog signals may have a small degree ofcustomizable smoothing applied inside Plantweb PerformanceAdvisor to improve performance analysis, particularly whennoisy data is present.A reported “poor” or “suspect” status of any input orsubstituted value is made visible through the graphic interface,delivering an early warning mechanism for problematic dataconnectivity or measurement issues. The same techniques canbe applied to key results to ensure sensible data is propagatedto other systems as required.Common View of the TruthHome-grown spreadsheet applications are often used forequipment performance calculations, but most companies findthey are cumbersome, hard to maintain, do not usually operatein real-time and have limited users. Plantweb PerformanceAdvisor is based on OSIsoft PI, the leading process historian inthe continuous industries, with over 10,000 installations andhundreds of thousands of users.www.emerson.com/plantwebadvisorJune 2019 Compared to do-it-yourself spreadsheets, PlantwebPerformance Advisor provides overwhelming benefits. Full-function database and graphics engine which canbe completely customized if desired Ability to scale up to hundreds of assets and users Modular structure for easy configuration and expansion Pre-engineered ASME PTC performance calculationsfor many equipment types Easy comparison to reference operation at“standard conditions” Calculation of the economic impact of degradation Easy data cleaning and validation techniques Able to retrospectively apply performance calculationsto historical data Model data smoothing to help understand underlyingperformance trends Easy-to-use detailed graphical interface and historiancapabilities that interface with multiple external data sources Consistent modelling approach for similar units on asite- wide and organization-wide basis4
Plantweb Performance AdvisorJune 2019Module: Compressor – Centrifugal/AxialModule Process Flow DiagramFLOWOPTIONALGAS COMPOSITIONINLET TEMPERATUREINLET PRESSUREMECHANICAL EFFICIENCYGUIDE VANE POSITIONSSHAFT POWERRECYCLE VALVE POSITIONSHAFT TORQUESURGE CONTROLLER OUTPUTGAS DENSITYGAS VALUESTAGETypical single stage shownSPEEDEXIT PRESSUREEXIT TEMPERATUREEquipment Design Information Piping & Instrumentation Diagrams (P&ID) OEM Design / Equipment Specification Sheets Operating Curves* – Head Versus Flow, Efficiency VersusFlow, Discharge Pressure Versus Flow**, Power Versus Flow*Module Input Data Points (per stage)Module Calculation Method AMSE PTC 10Module Outputs Flow (measured inside any recycle loops) Polytropic Efficiency – Actual Temperature – Inlet / Suction Polytropic Efficiency – Design Temperature – Exit / Discharge Polytropic Efficiency – Deviation Pressure – Inlet / Suction Polytropic Head – Actual Pressure – Exit / Discharge Polytropic Head – Design Shaft Speed (On Variable Speed Machines) Polytropic Head – Deviation Inlet Gas – Composition Flow – Volumetric Flow Actual Inlet Gas – Density (or Inlet Compressibility) Flow – Mass Flow Inlet Gas – Specific Heat (or Ratio of Specific Heats) Shaft Power Consumption (if not measured) Deviation Cost (Lost Throughput and/or Additional Power)Optional Data If Available Exit Gas – Specific HeatAdditional Outputs (data dependent) Exit Gas – Density (or Compressibility) Efficiency and Head – Adiabatic and Isothermal Shaft Power Power – Design Shaft Torque Power – Deviation Reference Condition – Power Compressor Gas Velocities – Inlet and Exit Reference Condition – Head Flow – Mass Design and Deviation Reference Condition – Volume Suction Stagnation Conditions Reference Condition – Density Discharge Stagnation Conditions Reference Condition – Speed Temperature – Theoretical Rise and Ratio Temperature – Actual Rise and Ratio Pressure – Rise and Ratio Corrected & Normalized – Volume Flow, Head and Power Machine Work Coefficients & Machine Mach Number* At various operational speeds** OptionalNOTE: A turbo-compressor is a turbine module compressor modulewww.emerson.com/plantwebadvisor5
Plantweb Performance AdvisorJune 2019Module: Compressor – ReciprocatingModule Process Flow DiagramGAS – COMPOSITIONINLET TEMPERATUREGAS – DENSITYINLET PRESSUREGAS – SPECIFIC HEATOPTIONALEXIT GAS – SPECIFIC HEATCAPACITY CONTROLEXIT GAS – DENSITYGAS FLOWEXIT PRESSUREEXIT TEMPERATURETypical single stage shownSPEEDPOWEREquipment Design Information Piping & Instrumentation Diagrams (P&ID) OEM Design / Equipment Specification Sheets;Including – Single/Double Acting, Stroke Length, Bore,Piston Area, Rod Area , Valve size(s), Capacity Control,Design Operating Points Operating Curves (Required): Power Versus Flow,Capacity Control CurvesModule Input Data PointsModule Calculation Method ASME PTC 9Module Outputs Temperature – Inlet / Suction Swept Volume Temperature – Exit / Discharge Clearance – Volume and Percent (Crank End, Head End) Pressure* – Inlet / Suction Volumetric Efficiency – Actual Pressure* – Exit / Discharge Volumetric Efficiency – Design Shaft Speed Volumetric Efficiency – Deviation Inlet Gas – Composition Adiabatic Efficiency – Actual Inlet Gas – Density (or Inlet Compressibility) Adiabatic Efficiency – Design Inlet Gas – Specific Heat (or Ratio of Specific Heats) Adiabatic Efficiency – Deviation Shaft Power Adiabatic Head – Actual Power – DesignOptional Data If Available Power – Deviation from Design Power Gas Flowrate Flow – Actual Volumetric and Mass Discharge Gas – Density Specific Power – per Mass Flow Discharge Gas – Specific Heat Flow – Design, and Deviation from Design Mass Flow Temperature – Cooling Jacket Coolant Inlet Deviation Cost (Lost Throughput and/or Additional Power) Temperature – Cooling Jacket Coolant Exit Capacity Control OperationAdditional Outputs (Data dependent) Rod Drop Measurement Compressor Gas Velocities – Inlet and Exit Shaft Efficiency Cylinder Suction Internal Conditions Cylinder Discharge Internal Conditions Temperature – Theoretical Rise and Ratio (with and withoutcooling duty) Temperature – Actual Rise and Ratio Pressure – Rise and Ratio Rod-loads (Head and Crank End)* Pressure typically measured at suction/discharge sor6
Plantweb Performance AdvisorJune 2019Module: Gas Turbine (Electricity Generating & Mechanical Drive)Module Process Flow DiagramFUEL COMPOSITIONFLOW – FOGGINGPOWER / TORQUEFLOW –FUELTEMPERATURE – INLETSHAFT SPEEDOPTIONALFLOW – INLET AIRFLOW – EXHAUSTFLOW – STEAM INJECTIONTEMPERATURE – FUELTURBINETEMPERATURE – TMAX / TITCOMPRESSORTEMPERATURE – COMP EXITIGV POSITIONRUN HOURSCOMP DISCH. PRESSINLET PRESSURE DROPAMBIENT HUMIDITYTEMPERATURE– EXHAUST AVERAGEAMBIENT PRESSURETEMPERATURE – EXHAUST RADIALAMBIENT TEMPERATUREEquipment Design Information Piping & Instrumentation Diagrams (P&ID) OEM Design / Equipment Specification Sheets andCorrection Curves to ISO Conditions GT Load Testing – Acceptance Testing Data;Design at various Gas Turbine Loads (50%, 75%, 100% load),at various Inlet Temperature conditionsM
ASME PTC 22 – Corrected output, heat rate, and thermal efficiency are calculated based on correction curves provided by the turbine manufacturer. Design combustion, turbine heat rate and efficiency are calculated based on turbine design data and compared to the corrected values. Module Inputs Module Outputs Flow – Fuel Flow – Fogging / Evaporative Cooling (where present) Flow – Steam .
