Transcription
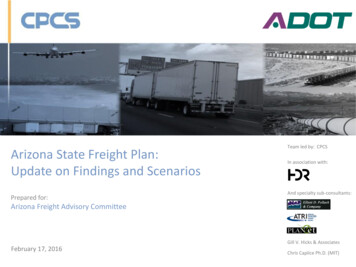
Arizona State Freight Plan:Update on Findings and ScenariosPrepared for:Team led by: CPCSIn association with:And specialty sub-consultants:Arizona Freight Advisory CommitteeGill V. Hicks & AssociatesFebruary 17, 2016Chris Caplice Ph.D. (MIT)
Meeting Goals Update FAC on Arizona State Freight Plan Discuss FAST Act Input from FAC on strengths, weaknesses, andfreight transportation system opportunities2
Meeting AgendaTimeItemPresenter1:30 – 1:40Welcome and IntroductionsMichael DeMers (ADOT)1:40 – 2:00Project Status ReportDonald Ludlow (CPCS)2:00 – 2:20Scenario Results andDiscussionDonald Ludlow (CPCS)Alejandro Solis (HDR)Michael LaBianca (HDR)2:20 – 2:40FAST Act Freight OverviewDonald Ludlow (CPCS)2:40 – 2:55Input from FAC on Strengths, Donald Ludlow (CPCS)Weaknesses, Opportunities2:55 – 3:00Wrap Up and Next StepsMichael DeMers (ADOT)Donald Ludlow (CPCS)3:00 Adjourn3
Presentation OverviewProject Status ReportPresentation of Scenarios and DiscussionFAST Act Freight OverviewInput from Freight Advisory CommitteeFuture Meeting and Ongoing Tasks4
Stepped Approach to the Project5
Resources Availablewww.azdot.gov/freight6
Phase 1: Vision, Goals, ObjectivesEach goal supported by set of objectives7
Phase 2: Arizona Freight Transportation SystemArizona’s transportation system generallysupports efficient goods movement Highway congestion concentrated in Arizona’s urbanizedareas – notably Phoenix metro area Rail network is lacking in north – south infrastructure– At grade crossings and Nogales border crossing issues– Some limits to rail capacity, intermodal facilities, classificationyards, and logistics centers Air Cargo using Phoenix Sky Harbor is affected by localcongestion, limited international connections Pipelines lack storage capacity and redundancy to respondto system disruptions Border Crossings long waits, changing market share8
Phase 3: Industry Sector AnalysisIdentified sector–based transportation needs and issuesFOOD & PMENTMANUFACTURINGMININGFORESTRYENERGYWHOLESALER& RETAILTRANSPORTATION& LOGISTICSHIGH TECHMANUFACTURING9
Phase 3: Report on Economic Context of FreightMovement in Arizona – Trade Flows California, Texas,and Mexico arethe predominantinbound andoutbound freightmarkets, byvolume I-10 is Arizona’smost heavilyused freightcorridor10
Phase 3: Report on Economic Context of FreightMovement in Arizona – Issues Affecting Sectors Recurring congestion andbottlenecks in and aroundurban centers, particularlyPhoenix Non-recurring congestion andbottlenecks Axle-load restrictions Truck driver shortage Funding constraints impactingfuture quality Other issues differ by sector11
Phase 4: Policies and Strategies12
Phase 4: Policies and Strategies Central issue for consideration– How will Freight Plan priorities fit into ongoingproject evaluation and prioritization efforts withinADOT (i.e. P2P)?13
Phase 5: Performance Measures, Data and ApproachesFewer performance measures, but tied to objectives Increase mobility– Truck Travel Time Index (TTTI) Increase system efficiency– Annual Hours of Truck Delay Increase system reliability– Truck Planning Time Index (TPTI) Increase safety– Accident rate per 100 million VMT– Total societal cost of accidents Value judgement indicators14
Phase 5: Performance and ConditionApplying performance measure to assess conditions Provide a benchmark forfuture comparisons Overall system performanceis good, but specific locationsmay have issues– 86% of KCCs travel time ratedgood– 85% of KCCs reliability ratedgood Urban areas display poorperformance15
Phase 5: Value Judgement IndicatorsHow have freight travel times changed in thelast five years?How have incidents and close calls changed inthe last five years?How have multimodal options (ability to ship How have logistics costs due to systemby truck, rail, air) changed relative to five years inefficiencies changed in the last five years?ago?16
Presentation OverviewProject Status ReportPresentation of Scenarios and DiscussionFAST Act Freight OverviewInput from Freight Advisory CommitteeFuture Meeting and Ongoing Tasks17
Phase 6: Freight Forecasting Scenario planning workshop– November 5, 2015– 50 attendees from private and public sector– What factors do you think will have the biggest impacton the future of freight transportation in Arizona?– Developed three alternative scenarios for the future
Scenario Planning Workshop
Top STEEP Drivers Identified by ParticipantsSocial: urbanization, shared economy, labor shortage,immigrationTechnological: internet of things, alternative fuels,autonomous trucks, flexible/automated manufacturingEnvironmental: water demand/supply, extremeweather events, new environmental regulationsEconomic: National conditions, Canamex, opening ofMexican ports, fuel price volatilityPolitical: Funding (more or less), competition withneighboring states, land use regulations, shifting touser fees instead of taxes
Base Case 2010 to 2040– Change in truckvolumes AZTDM2 Model– Assignment oftruck flows(Transearch)– Assignment ofpassenger flowsPRELIMINARY NOT FOR DISTRIBUTION
Scenario 1 – Domestic BlissDomestic Bliss: government and social forcesdominate market influences International factors– Weak international trade, including Mexico Domestic factors– Migration of firms from California to Arizona due toregulations– Population growth in Arizona, primarily retirees– Increasing US trade in dairy farming, agriculture, miningand other resource intensive industries
Scenario 1 – Domestic Bliss Second Gray Wave matchesoptimistic populationgrowth for State Migration of firms to AZproportional to optimisticpopulation growth in SWcounties Domestic trade with midwestern US states replacesinternational trade– Proportional to differencesbetween trade forecasts
Scenario 1 –Domestic BlissPRELIMINARY NOT FOR DISTRIBUTION
Scenario 2 - #urbanizona#urbanizonia: market and social forces dominategovernmental control and influence. Domestic factors– Urban population increase in Phoenix and Tucson,primarily young and well educated– Shared economy and automation fully functioning,decreasing vehicle use– Growing high-tech/bio sectors
Scenario 2 – #urbanizona Urban populationincreases at a faster ratethan rural population– Urban centers demandfor goods increasessignificantly Export growth– Optimistic forecast forinternational trade Slight decrease in freighttonnage moved due touse of technologicaladvances
Scenario 2 –#urbanizonaPRELIMINARY NOT FOR DISTRIBUTION
Scenario 3 – SOBO – South of the BorderSOBO: market and government forces dominatesocial influence. International factors– Increased trade with Mexico, replacing China– Mexican port development and expansion– Border crossings are expanded and immigration reformed Domestic factors– Arizona transports, assembles and customizes Mexicangoods– Suburban growth patterns
Scenario 3 – SOBO – South of the Border Significant increase in tradewith Mexico in response toelevated growth in Mexicaneconomy– Mexican imports and exportsexpected to growth by overthree times by 2040 Optimistic population growthfor urban and rural counties as aresult of ties with MexicoAll Arizona counties importingfrom Mexico according tostatewide county averagesOutsourcing of Agricultural andFood/Beverage production infavor of other industries
Scenario 3 – SOBOSouth of the BorderPRELIMINARY NOT FOR DISTRIBUTION
Presentation OverviewProject Status ReportPresentation of Scenarios and DiscussionFAST Act Freight OverviewInput from Freight Advisory CommitteeFuture Meeting and Ongoing Tasks34
FAST Act Freight OverviewFixing America’s Surface Transportation (FAST) Act National Multimodal Freight Policy with national goals to guide decision-making 4.5B discretionary and competitive freight-focused grant program over 5 years– Eligibility: States, Metropolitan Planning Organizations (MPOs), local governments, tribalgovernments, special purpose districts and public authorities (including port authorities), andother parties– Projects that improve safety, eliminate freight bottlenecks, and improve critical movements 6.3B National Highway Freight Program– Formula funds over 5 years allocated to states– Eligible projects includes freight projects on the National Highway Freight Network– Up to 10 percent of these funds may be used for intermodal project New authority/requirements improve project delivery and facilitate innovative finance– Provisions to reduce the time it takes to break ground on new freight transportation projects,including by promoting best contracting practices and innovating financing and fundingopportunities– Reduced uncertainty and delays with respect to environmental reviews and permitting
FAST Act Freight OverviewFreight Networks National Multimodal Freight Network (NMFN)– National Highway Freight Network Interstate Highways 41,000 primary freight network highway miles identified underMAP-21 State-identified highway segments– Multimodal critical rural freight facilities and corridorsdesignated within the State under section 70103 of thistitle– Critical rural and urban freight corridors designatedwithin the State under section 167 of title 23
FAST Act Freight OverviewState Freight Planning Considerations State Freight Plan required every 5 years– Project investment plan, prioritized and financiallyconstrained– Address reliability and resiliency of system– Performance based planning State Freight Advisory Committees– Membership representative of state freightstakeholders
Presentation OverviewProject Status ReportPresentation of Scenarios and DiscussionFAST Act Freight OverviewInput from the Freight Advisory CommitteeFuture Meeting and Ongoing Tasks38
Input from FAC on ongoing work – Existing and FutureStrengths and Weaknesses Generally speaking, the performance of thefreight system in Arizona is looking good and atthis point the focus is on operations, policies, andtargeted capital improvements. Is this the rightfocus? FAST ACT requires Freight Plans to put forwardspecific projects –it’s our intent to do this, yet theprimary focus is preservation, modernization, andas a last resort expansion
Presentation OverviewProject Status ReportPresentation of Scenarios and DiscussionFAST Act Freight OverviewInput from the Freight Advisory CommitteeFuture Meetings and Ongoing Tasks40
Recent and Upcoming Activities Southern Arizona Stakeholders Meeting Mid-May FAC Meeting (May 18th target)– Projects and prioritization approaches– Define Drivers of private industry efficiency andperformance Deliverables available before next meeting– Phase 5: Initial freight performance of the freighttransportation system– Phase 6: Freight Forecasts– Phase 7: Trends and Needs– Phase 8 : Strengths, Weaknesses, Opportunities
Questions and DiscussionDonald Ludlow, MCP, AICPManaging Director1050 Connecticut Ave. NW, Suite 500, Washington, DC 20036T: 1 202 772 3368 C: 1 703 216 2872 dludlow@cpcstrans.com www.cpcstrans.com
Work Plan Addresses High Level Key QuestionsGoals,Objectives,Strategy SystemAnalysis andNeeds Prioritizationand ActionPlan What vision, strategic goals and objectives should underpin Arizona’s State Freight Plan forfreight transportation investment? (Phase 1)Which policies and strategies will enable Arizona to improve the competitiveness of itstransportation system and the economic vitality of the State? (Phase 4)Which facilities comprise Arizona’s freight transportation system and how well are these assetsperforming? (Phase 2)What types of commodities do Arizona’s freight-dependent businesses move over thetransportation system and what contribution do freight–dependent businesses make to theArizona economy? (Phase 3)Which performance measures should guide investment decisions in Arizona’s freighttransportation system? (Phase 5)What trends and changes should Arizona anticipate as the state develops plans to meet futurechallenges and opportunities? (Phase 6)Which trends, needs and issues are likely to affect Arizona’s freight movement system? (Phase 7)What are the strengths and weaknesses of the state’s freight transportation system? (Phase 8)How should the state make decisions to prioritize freight investments? (Phase 9)What freight improvement strategies will guide the development of the freight plan? (Phase 10)How should Arizona implement the strategies outlined in the Arizona State Freight Plan? (Phase11)44
Phase 3: Industry Sector Analysis - AgricultureSector Summary 1.5 billion (0.6%) of state GDP Employs over 25,000 (1%) totalemploymentTransportation Summary Supply chain relies on travel timeand reliability Many stakeholders reportedgood roadway performance Weight restrictions and bordercrossings are barrier to efficiency Other issues include I-10, SR-189,I-17, I-40, border crossings,roadways in Mexico
Freight Sector Groups
Performance Measures, Data and ApproachesFewer performance measures, but tied to objectives Increase mobility– Truck Travel Time Index (TTTI) Increase system efficiency– Annual Hours of Truck Delay Increase system reliability– Truck Planning Time Index (TPTI) Increase safety– Accident rate per 100 million VMT– Total societal cost of accidents Value judgement indicators47
Performance and ConditionApplying performance measure to assess conditions Provide a benchmark forfuture comparisons Overall system performanceis good, but specific locationsmay have issues– 86% of KCCs travel time ratedgood– 85% of KCCs reliability ratedgood Urban areas display poorperformance48
Southern Arizona Stakeholder InputCritical Issues What trends (U.S. or Mexico) are having thegreatest impact on freight volumes, modes ortrade patterns? What are the most critical transportation issuesaffecting your business or region? What infrastructure constraints are mostdetrimental to freight movements betweenArizona and Mexico? What actions could ADOT take to improve toimprove goods movement statewide?
2:55 -3:00 Wrap Up and Next Steps Michael DeMers (ADOT) Donald Ludlow (CPCS) 3:00 Adjourn. 4 . -Accident rate per 100 million VMT -Total societal cost of accidents Value judgement indicators 14. . including by promoting best contracting practices and innovating financing and funding



![Amalfi 180 Led Otto [28.01.22]](/img/23/022e99f7-d57e-51b4-8c41-152437a0d633.jpg)
