Transcription
BMC BioinformaticsBioMed CentralResearchOpen AccessAn integrative modular approach to systematically predictgene-phenotype associationsMichael R Mehan1, Juan Nunez-Iglesias1, Chao Dai2,1, Michael S Waterman1and Xianghong Jasmine Zhou*1Addresses: 1Program in Computational Biology, Department of Biological Sciences, University of Southern California, Los Angeles CA 90089,USA and 2School of Computer, Wuhan University, Wuhan 430079, PR ChinaE-mail: Michael R Mehan - rielmeha@usc.edu; Juan Nunez-Iglesias - nunezigl@usc.edu; Chao Dai - chaodai@usc.edu;Michael S Waterman - msw@usc.edu; Xianghong Jasmine Zhou* - xjzhou@usc.edu*Corresponding authorfrom The Eighth Asia Pacific Bioinformatics Conference (APBC 2010)Bangalore, India 18-21 January 2010Published: 18 January 2010BMC Bioinformatics 2010, 11(Suppl 1):S62doi: 10.1186/1471-2105-11-S1-S62This article is available from: http://www.biomedcentral.com/1471-2105/11/S1/S62 2010 Mehan et al; licensee BioMed Central Ltd.This is an open access article distributed under the terms of the Creative Commons Attribution License (http://creativecommons.org/licenses/by/2.0),which permits unrestricted use, distribution, and reproduction in any medium, provided the original work is properly cited.AbstractBackground: Complex human diseases are often caused by multiple mutations, each of whichcontributes only a minor effect to the disease phenotype. To study the basis for these complexphenotypes, we developed a network-based approach to identify coexpression modules specificallyactivated in particular phenotypes. We integrated these modules, protein-protein interaction data,Gene Ontology annotations, and our database of gene-phenotype associations derived fromliterature to predict novel human gene-phenotype associations. Our systematic predictions provideus with the opportunity to perform a global analysis of human gene pleiotropy and its underlyingregulatory mechanisms.Results: We applied this method to 338 microarray datasets, covering 178 phenotype classes, andidentified 193,145 phenotype-specific coexpression modules. We trained random forest classifiers foreach phenotype and predicted a total of 6,558 gene-phenotype associations. We showed that 40.9%genes are pleiotropic, highlighting that pleiotropy is more prevalent than previously expected. Wecollected 77 ChIP-chip datasets studying 69 transcription factors binding over 16,000 targets undervarious phenotypic conditions. Utilizing this unique data source, we confirmed that dynamictranscriptional regulation is an important force driving the formation of phenotype specific gene modules.Conclusion: We created a genome-wide gene to phenotype mapping that has many potentialimplications, including providing potential new drug targets and uncovering the basis for humandisease phenotypes. Our analysis of these phenotype-specific coexpression modules reveals a highprevalence of gene pleiotropy, and suggests that phenotype-specific transcription factor bindingmay contribute to phenotypic diversity. All resources from our study are made freely available onour online Phenotype Prediction Database [1].Page 1 of 12(page number not for citation purposes)
BMC Bioinformatics 2010, 11(Suppl 1):S62BackgroundA major goal of modern genetics is to determine whichgenes are associated with which human phenotypes.Over the course of the last few decades, studiesuncovering the basis for Mendelian diseases have beenextremely successful, typically identifying causal mutations in single genes [2]. However, most humanphenotypes, e.g. complex diseases such as cancer orneurological diseases, are controlled by multiple genes,each of which has a minor contribution to the diseasephenotype [3]. Therefore, to effectively identify genesthat are related to complex phenotypes, the approachmust consider groups of genes rather than studying genesin isolation. Numerous methods have been developedfor identifying gene modules from protein-proteininteraction (PPI) networks [4], metabolic networks [5],or transcription-regulatory networks [6], however thesenetwork data are often lack human phenotype-specificinformation.In this study, we identified gene modules that arespecifically coexpressed in datasets that study particularhuman phenotypes. Identifying phenotype-specificmodules in human is far more difficult than in modelorganisms because the phenotypes can only be observedrather than working directly with the biological pathways that define them. Ideally, these biological pathwaysshould be reverse-engineered from data taken fromindividuals that display particular phenotypes. Publicrepositories of microarray data are a valuable resourcefor this type of analysis because they contains hundredsof well annotated expression datasets that span a widevariety of phenotypic conditions. It is known thatidentifying co-expression modules frequently occurringacross multiple microarray datasets significantlyenhances the signal to noise ratio [7-9]. Here, weidentified co-expression modules that are present recurrently and specifically in datasets of one phenotype byusing the remaining datasets as a background.Using these phenotype-specific coexpression modules,we performed a systematic prediction of gene-phenotypeassociations by integrating three data sources: previouslyknown associations derived from literature text mining,Gene Ontology annotations, and protein-protein interactions. A previous study designed an approach toidentify gene modules in human PPI networks andused them to predict novel gene-phenotype associations[10]. Our approach differs from this in that it integrateshundreds of microarray datasets in parallel to identifymodules, and then superimposes protein-protein interactions as well as phenotype and functional annotationsto make /11/S1/S62The systematic annotation of gene-phenotype associations provides us with the opportunity to perform thefirst global analysis of gene pleiotropy in human. Genepleiotropy has the potential to explain the vast humanphenotypic diversity, considering that the number ofhuman genes is far fewer than originally anticipated[11]. Several large scale studies of pleiotropy have beenperformed on model organisms such as yeast [12,13]and C. elegans [14]. In humans however, pleiotropy isoften only recognized following the in-depth analysis ofa single gene or gene family [15-17]. To our knowledge,no comprehensive determination or prediction of whichgenes exhibit pleiotropic behavior throughout the entirehuman genome has been previously performed. Basedon our modular approach, we have defined a novelconcept, modular pleiotropy, as the pleiotropic behavior ofgenes resulting from their presence in their modules, aswe have shown that changes in module membership candefine a gene’s pleiotropic behavior. To further understand the underlying mechanisms of phenotypic diversity, we utilized the rapid accumulation of ChIP-chipdatasets, measured under various phenotypic conditions,and tested whether the phenotype specificity of ourmodules, as well as specific instances pleiotropy, couldbe attributed to dynamic phenotype-specific generegulation.By integrating 338 human microarray datasets representing 283 phenotypes, we have identified 193,145phenotype-specific modules. We subsequently predicted6,558 novel gene-phenotype associations covering 3,183genes, and showed that 40.9% of genes are associatedwith multiple phenotypes, and can thus be consideredpleiotropic. We collected 77 Chip-chip datasets, annotated them with matching phenotypes, and confirmedthat dynamic transcriptional regulation is an importantforce driving the formation of phenotype-specific modules. Our module-based approach has the advantage ofnot only predicting pleiotropy, but also suggesting how agene is pleiotropic, exerting different phenotypic functions in different transcriptional and regulatory contexts.We have provided all the data from our study, includingthe gene phenotype database we constructed via textmining, our phenotype-specific modules, and our novelphenotype predictions, in our online Phenotype Prediction Database [1].Results and discussionSystematic annotation of gene-phenotype associationOur approach identified phenotype-specific modulespreferentially coexpressed in microarray datasets thatPage 2 of 12(page number not for citation purposes)
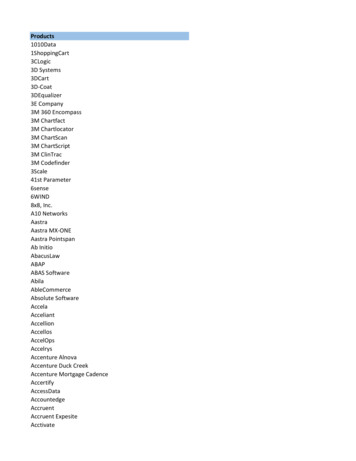
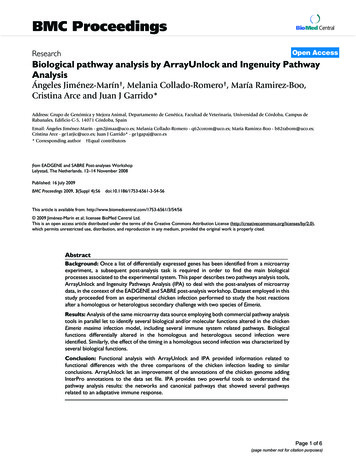
BMC Bioinformatics 2010, 11(Suppl 1):S62study particular phenotypes, and we used these modulesto perform systematic phenotype prediction, study genepleitropy, and integrated phenotype-specific transcription factor binding data to build dynamic regulatorynetworks (Figure 1). We collected 338 human microarray datasets from the NCBI Gene Expression Omnibus(GEO) [18]. By mapping the dataset annotations ontoUMLS [19] phenotype terms we obtained 283 phenotypeclasses each of which contained at least 3 microarraydatasets. For the purposes of this paper, we employ abroad interpretation of the term phenotype, whichincludes diseases, tissues, and cell types.We previously designed a Multiple Objective SimulatedAnnealing (MOSA) algorithm that robustly identifiesgroups of genes that are preferentially coexpressed indatasets of a specific phenotype class [20]. The simulatedannealing procedure was designed to optimize fourcharacteristics of phenotype-specific coexpression modules: size, density, specificity for the phenotype datasets,and a summary statistic of module density which weterm density differential. The goal of this approach wasto identify genes modules that exhibit a coexpressionsignature which is specific to the phenotype in whichthey were identified, and therefore are likely to representprocesses inherent to the phenotype.Applying this approach, we identified 193,145 phenotype-specific coexpression modules that met our criteriaof a minimum size of 7, minimum density of 0.66, and aminimum phenotypic enrichment p-value of less than0.01 after FDR correction. These modules spanned 178phenotypes and had an average size of 13.7. A moredetailed description of this algorithm is outlined in themethods section.In this study, starting with the phenotype-specificmodules, we predicted gene phenotype associations byadditionally incorporating the following three datasources: our database of gene-phenotype associationsobtained from text-mining of the Gene Reference IntoFunction (GeneRIF) resource, the Gene Ontology database, and protein-protein interaction data (details inmethods).We trained a different random forest classifier for the 52phenotypes for which the phenotype-specific coexpression modules contained genes with GeneRIF entries withthe same phenotype. Each classifier therefore dependedon the the set of genes that were known to be associatedwith the training phenotype via GeneRIF text mining, towhich we refer to as Gp. Our model contained 5 predictorvariables, and contained one observation for each 62in the phenotype-specific modules. If a gene appeared inmore than one module, the predictor variables wereaveraged across the modules.Given a previously unannotated gene gi, which is amember of module mpj (the jth module specific tophenotype p), we predicted whether gi is associated withphenotype p by considering the following predictivefeatures: i) the enrichment of the members of mpj forgenes in Gp; ii) the degree of GO annotation similaritybetween gi and mpj Gp; iii) and the number of proteinprotein interactions between gi and mpj Gp. The firstpredictor variable was the negative log p-value of thehypergeometric test for enrichment of genes in themodule for genes in Gp. The second predictor variablewas derived from protein-protein interaction (PPI) data.The PPI score was calculated by summing the totalnumber of protein-protein interactions between thecurrent gene and genes from Gp in the same module.The remaining three predictor variables were derivedfrom the three subtrees of GO (biological process,cellular component, and molecular function) as follows.For a pair of genes in the same module, the GO score fora subtree was calculated by first identifying all GO termsshared between the two genes. Once this set of distinctmatching terms was established, the GO score wascalculated by summing up the negative log p-values ofthe significance of matches to genes in Gp.These classifiers trained on the predictive featuresdiscussed above predicted 6,558 gene-phenotype associations covering 3,183 genes. For a cumulative recall(including all phenotypes) of at least 20%, the precisionof our predictions was approximately 65%. As thestringency of the cutoff parameter increases the precisioncontinues to climb above 80%. This indicates that if werestrict the classifiers to a small number of predictionsthey become extremely accurate, which would be anideal set to pursue in a clinical setting. The precisionrecall plot, which differs from a ROC plot by onlyplotting statistics related to positive predictions, for threeclassifiers compared to randomly generated modules isshown in Figure 2. Each of our predictions is scoredbased on the fraction of classification trees from therandom forest that voted for the prediction. Table 1shows the predictions with the best scores for the 10highest scoring predictions, stratified by phenotype,along with supporting evidence from published papersand Gene Ontology. GeneRIF does not contain allpublished papers that discuss a gene’s association witha phenotype, so the published papers listed in this tablerepresent information not used by the classifier. The firstprediction is ADRB3 for the phenotype “UrologicPage 3 of 12(page number not for citation purposes)
BMC Bioinformatics 2010, 11(Suppl /S62Figure 1A flow chart of our approach pipeline for each phenotype. We designed a multiple objective simulated annealing(MOSA) algorithm to identify phenotype-specific coexpression modules in microarray datasets. We incorporated additionaldata sources into a random forest classifier to make novel gene-phenotype predictions. These modules and predictions wereused to study human pleiotropy and phenotype-specific transcription regulation.Page 4 of 12(page number not for citation purposes)
BMC Bioinformatics 2010, 11(Suppl /S62Figure 2Random forest performance. Precision-recall plot depicting the training performance of the random forest classifiers forthree phenotypes.Table 1: Highest confidence gene-phenotype association predictions stratified by phenotypePhenotypeCutoffGeneGene DescriptionPMIDUrologic DiseasesPhagocytesGenital Neoplasms, FemaleInflammationskin EXO1CXCL2SC4MOLFPRL1adrenergic, beta-3-, receptorpromyelocytic leukemiaexonuclease 1chemokine (C-X-C motif) ligand 2sterol-C4-methyl oxidase-likeformyl peptide receptor 218311486monocyte0.99TAP2Bone Marrow A1transporter 2, ATP-binding cassette,sub-family B (MDR/TAP)chemokine (C-X-C motif) ligand 11integrin, beta 4histocompatibility (minor) HA-1153283691289290415625007Relevant GO Termmyeloid cell differentiationDNA repairinflammatory response12234057G-protein coupled receptor proteinsignaling pathwayimmune response151023661519447914502255immune responsecell adhesionintracellular signaling cascadeEach phenotype is listed with the predicted gene, the gene's description, and the proportion of decision trees from the random forest classifier thatpredicted its association to the phenotype. The final two columns provide supporting evidence in the form of a PubMed ID for a published work or aGene Ontology annotation that is consistent with the phenotype.Diseases.” The potential for this gene to be involved inurologic diseases is supported by its presence in thehuman urinary bladder urothelium, as well as itsregulation of urinary function [21]. Five of the predictions in this table are for phenotypes related to theimmune system, such as “Phagocytes,” “Inflammation,”“Lymphocyte,” “monocyte,” and “Bone Marrow Cells.”Many of these predictions are supported by bothliterature and their GO annotations which includemyeloid cell differentiation, inflammatory response,and immune response. Two other interesting predictionsare the chemokine genes CXCL11 and CXCL2 for thephenotypes “Bone Marrow Cells” and “Inflammation”respectively. Chemokines are master controllers of themigration of leukocytes, which originate in bone marrowand directly effect many functions related to the immunesystem including inflammation. The remaining predictions shown in the table are related to cancer andepithelial tissue related phenotypes.To provide a more comprehensive analysis of ourpredictions, rather than just highlighting the highestscoring predictions, we performed functional enrichment analysis on each predicted set of associated genesfor each phenotype. This analysis revealed that themajority of phenotype enriched biological processes areconsistent with the functionality of the phenotype,which supports the quality of our predictions. Forexample, in the phenotype “Squamous cell carcinoma,”our predicted genes are enriched for GO annotationsrelated to skin cancer such as DNA replication, keratinization, and epidermis development. GO annotations arePage 5 of 12(page number not for citation purposes)
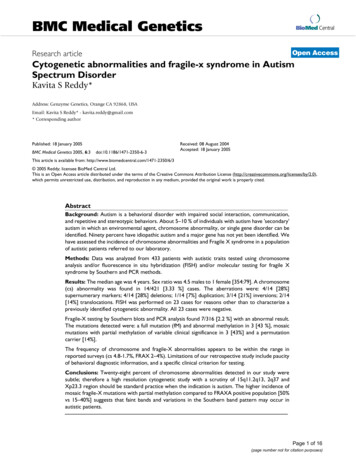
BMC Bioinformatics 2010, 11(Suppl /S62also consistent with the phenotypes for tissues. Thephenotype “Brain” is enriched for synaptic transmissionand monovalent inorganic cation transport. We highlight additional examples of significantly (FDR p-value 0.01) overrepresented GO terms within predicted genesets for phenotypes in Table 2.UMLS text mining of GeneRIF terms can lead to incorrectannotations and therefore pleiotropy. The addition ofour phenotype predictions resulted in 607 novelpleiotropic genes. Furthermore, 725 genes that werepreviously pleiotropic were annotated with a newphenotype distinct from all previous annotations,resulting in a new case of pleiotropy.The prevalence of gene pleiotropyOur large-scale gene-phenotype association predictionprovided us with a unique opportunity to systematicallystudy gene pleiotropy. The simplest definition ofpleiotropy, a gene being annotated with multipleUMLS phenotype terms, is inadequate here. For example,TAL1 is annotated with both “leukemia” and “Immunoproliferative Disorders,” but these do not constitute twodistinct phenotype associations because one is simply amore general phenotype than the other. Other groupshave employed phenotype distance metrics and declaredtwo phenotypes different when their distance exceeded acertain threshold [10,22]. However, this type of methodrelies on the selection of an arbitrary threshold, whichcan significantly affect the results. Here, we definedpleiotropy using the structure of the parental linkswithin the UMLS phenotype ontology. We considered agene pleiotropic if it was annotated with at least twophenotypes, neither of which is a descendant of theother.Pleiotropy can be determined and observed in a varietyof ways. In this study, we predicted whether a particulargene exhibits pleiotropic behavior based upon itsmembership in phenotype-specific coexpression modules. We therefore term this type of pleiotropy modularpleiotropy, in which a gene’s pleiotropic behavior isdetermined by module membership. An example thatillustrates this phenomenon is depicted in Figure 3involving two modules, one specific to “nervous systemdisorders” and the other to “Neoplasms, Glandular andEpithelial.” These modules share six genes related to theextracellular matrix, the substrate upon which cellsmigrate, proliferate, and differentiate. It is not surprisingto find these genes associated with epithelial cancer, asmany studies have shown that the extracellular matrix isheavily involved in tumor progression and metastasis[23,24]. The extracellular matrix also plays a major rolein the development and repair of the central nervoussystem, supporting its presence in both modules [25]. Ineach of the two overlapping modules, the remaining,unshared genes also include genes from the extracellularmatrix and additional genes that are highly specific tothe phenotypes in which the modules were discovered.These include the well known Alzheimer’s susceptibilitylocus APOE, an actin gene differentially expressed inschizophrenia patients (ACTG1), a brain-specific tubulinApplying this definition of pleiotropy to only the diseasephenotypes revealed that 40.9% of the 8,504 genes inour study are associated with at least one pair of distinctphenotypes. It should be noted that this percentage islikely to be an over estimate of pleiotropic genes, sinceTable 2: Overrepresented GO terms in predicted genes. Seven of the UMLS phenotypes are highlighted, along with the number ofphenotype-specific coexpression modules and number of novel predicted associated genes. The final column contains a subset of theoverrepresented GO biological processes in the predicted genes that are consistent with the phenotype. The full table is available onour supplementary websitePhenotypeModulesPredictionsOver-represented GO annotationsAdenocarcinoma236769Bone Marrow Cells5390421Brain8373329Connective and Soft Tissue Neoplasm146322Musculoskeletal DiseasesSquamous cell carcinoma5421126832454nervous system disorder8235628cell cycle process (3.5e-06)DNA replication (4.1e-06)cell cycle phase (8.5e-06)immune response (3.8e-06)immune system process (7.2e-06)response to virus (2.0e-05)synaptic transmission (3.8e-06)monovalent inorganic cation transport (1.7e-05)cell cycle process (4.3e-14)cytoskeleton-dependent intracellular transport (8.6e-07)actin filament-based process (8.2e-06)DNA replication (2.5e-08)keratinization (8.1e-05)epidermis development (1.0e-04)respiratory electron transport chain (5.1e-07)acetyl-CoA catabolic process (3.2e-05)Page 6 of 12(page number not for citation purposes)
BMC Bioinformatics 2010, 11(Suppl /S62Figure 3An example of modular pleiotropy with a pleiotropic component related to the extracellular matrix. Themodules shown are specific to microarray datasets that study “nervous system disorders,” and “Neoplasms, Glandular andEpithelial.” The shaded elliptical nodes represent genes associated with the module phenotype (via GeneRIF text mining),whereas the shaded diamond nodes represent predictions made by our random forest classifier. The edge opacity indicateshow often a pair of genes was coexpressed in the microarray datasets for which the module was coexpressed.associated with behavioral defects (TUBA1A), and atubulin polymerizer that serves as a neuroprotectant(S100A4). The neoplasms module also contains genesrelated to the extracellular matrix, and genes with knownroles in neoplastic processes such as tumor progression,tumor necrosis induction, tumor suppression, andtumor invasion [26,27].We would also like to highlight an interesting predictionof pleiotropy for the gene BGN, which is present in bothmodules. This prediction is supported by the RefSeq entryfor this gene, which states that it is thought to transfergrowth factors between cells and that it may promoteneuronal survival. Some additional evidence for BGN’sactivity in cancer was discovered by a study that showedBGN controls cell growth in pancreatic cancer cells [28].Studies have demonstrated BGN’s potential role in thehuman nervous system as well, as BGN is overexpressedin rats after brain injury and it sustained the survival of ratneocortical neurons in culture [29,30].The above example nicely illustrates the power of ourclassification method to make reliable phenotype predictions, and in particular to identify pleiotropy and itsmodular context.Phenotype-specific transcriptional regulationWe hypothesized that regulatory networks are not staticrelationships between transcription factors and theirtarget genes, but rather dynamic networks that vary todictate different observed phenotypes, such as tissuetypes and diseases. Thanks to the accumulation of ChIPchip experiments, each of which provides genome-wideTF binding data derived under particular phenotypicconditions, we were able to test this hypothesis bydetermining whether TF binding detected under aphenotypic condition preferentially occurs in genesbelonging to modules specific to the same phenotype.This concordance between or phenotype-specific coexpression modules and phenotype-specific binding fromChIP-chip data also serves to independently validate thephenotype-specificity of our modules.We compiled 77 ChIP-chip datasets from the publicrepositories and also manually collected results fromliterature publications. These data include 69 TFs and16,122 target genes, which can be found on our onlinePhenotype Prediction Database [1]. Applying our textmining procedure to these datasets resulted in a total of208 phenotypes including diseases, tissues and celltypes. Of these 208 phenotypes, we focused on the 97Page 7 of 12(page number not for citation purposes)
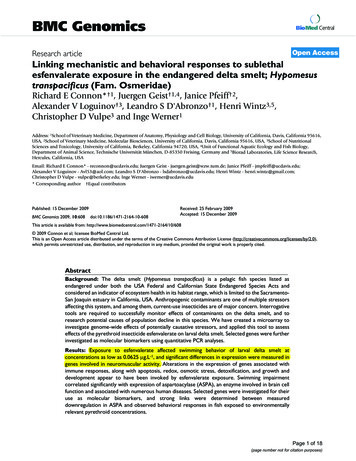
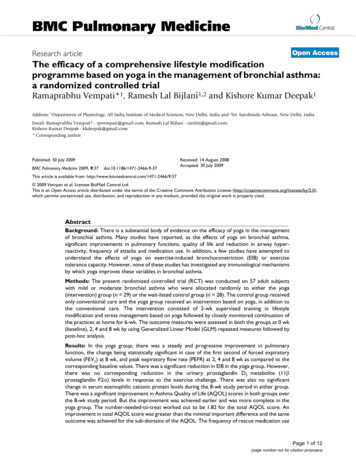
BMC Bioinformatics 2010, 11(Suppl 1):S62phenotypes that were also studied by the microarraydatasets we had collected. This provided us with one ofthe most comprehensive collections of regulatory dataavailable, with the phenotypic conditions that eachdataset studied.For each phenotype-specific module, we tested themember genes for enrichment of TF binding derivedfrom ChIP-chip datasets that study related phenotypes.Out of the 97 ChIP-chip phenotypes, 43 exhibited astatistically significant preferential binding (Mann-Whitney test, FDR 0.05), indicating that target genes fromChIP-chip data are more likely to form coexpressionmodules in microarray datasets whose phenotype annotations match those of the ChIP-chip experiment. The fulltable of p-values resulting from this analysis are availableonline on our Phenotype Prediction Database [1].One example of a phenotype that exhibits preferentialChIP-chip binding is “Prostatic Neoplasms,” which isstudied by a single ChIP-chip dataset profiling androgenreceptor binding. The phenotype-specific preferentialbinding is shown in Figure 4. The proportion ofphenotype-specific modules for this phenotype that aresignificantly enriched for androgen receptor binding(hypergeometric p-value 0.025) is over 16 times /S62than the modules specific to other phenotypes. Thisstrong over representation of significant binding enrichment for our modules demonstrates the ability of ourmethod to detect evidence of phenotype-specific TFbinding, despite being provided only a small fraction ofthe complete transcriptional regulatory informationrelated to this phenotype.The second example in the figure is the more generalphenotype “Malignant Neoplasms”. The distribution ofTF binding enrichment is more continuous for thisexample due to the larger number of related phenotypespecific modules and ChIP-chip datasets. As with theprevious example, there is a higher relative frequency ofsignificantly bound modules specific to phenotypes thatmatch the phenotype of the TF binding. Also, thefrequency of the most significant binding enrichment(hypergeometric p-value 0.025) within the distributionof the related phenotype-specific modules is more thantwice as high as the frequency of all other enrichment pvalues. This can be attributed to the much higherquantity of ChIP-chip data available for this phenotype,which allowed for more significant binding for ourtranscription modules. This result implies that as moreChIP-chip data becomes available, we would expect tosee the significance of binding enrichment of ourFigure 4Distribution of ChIP-chip TF binding enrichment p-values for phenotype-specific coexpression modules. Thedistributions of ChIP-chip TF-binding enrichment p-values are shown for two ChIP-chip phenotypes: Prostatic Neoplasms andMalignant Neoplasms. The first and second rows of distributions correspond to those derived from microarray datasets with aphenotype related to the ChIP-chip data phenotype and those derived from unrelated phenotypes respectively. The final rowdisplays the log2 ratio of the two distributions relative to their respective total sizes.Page 8 of 12(page number not for citation purposes)
BMC Bioinformatics 2010, 11(Suppl 1):S62phenotype-specific modules continue to increase.Although the complete set of phenotype-specific bindingis not available, we were still able to construct portionsof these dynamic transcriptional networks by combiningphenotype-specific coexpression modules with TF binding from the same phenotypes. For example, Figure 5shows two overlapping modules, each specific todifferent phenotypes, and each significantly enrichedfor phenotype-specific binding that matches its phenotype. The two modules are each preferentially coexpressed in datasets studying a specific phenotype: one“Squamous Cell Neoplasms” and the other “Immunoproliferative Disorders."As with the previous example of pleiotropy, these twomodules are phenotype specific and are enriched withgenes related to each phenotype. The “Squamous CellNeoplasms” module contains ten genes, five of whichwere previously annotated with the phenotype, and also significantly enriched for GO terms consistent withcancer of squamous tissue: keratinocyte differentiation(p-value 2.8e-9) and epidermis development (p-value5.1e-7). The seven gene “Immunoproliferative Disorders” module contains four genes that were annotatedwith the phenotype, as well as being enriched for GOannotations related to the immune system such asleukocyte chemotaxis (p-value 5.1e-7) and defenseresponse (p-value 5.0e-6). The modules share two proinflammatory calcium binding genes, S100A9 andS100A12, that are implicated together in a number ofdiseases [31]. S100A
Michael S Waterman - msw@usc.edu; Xianghong Jasmine Zhou* - xjzhou@usc.edu *Corresponding author from The Eighth Asia Pacific Bioinformatics Conference (APBC 2010) Bangalore, India 18-21 January 2010 Published: 18 January 2010 BMC Bioinformatics 2010, 11(Suppl 1):S62 doi: 10.1186/1471-2105-11-S1-S62