Transcription
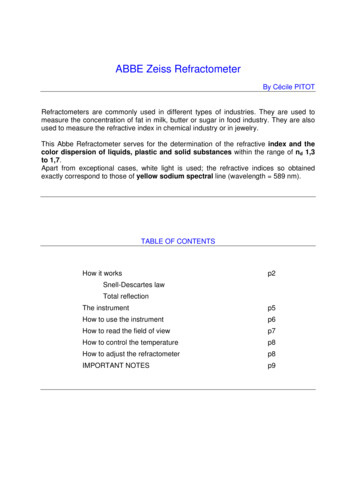
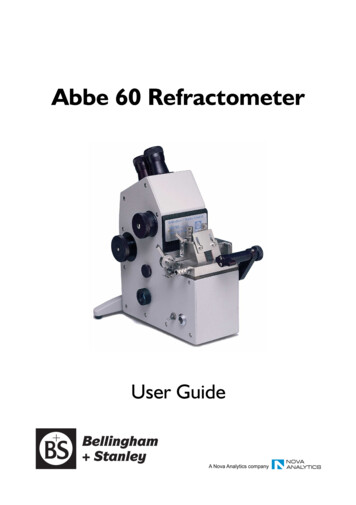
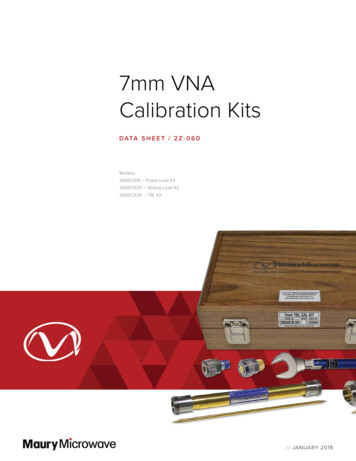
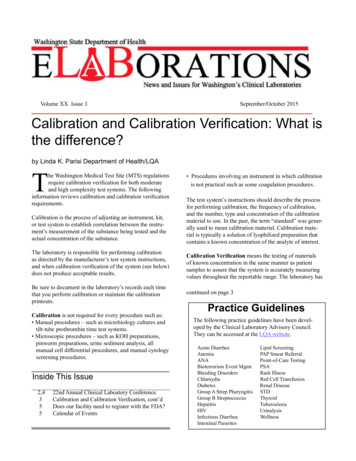
University of California Cooperative Extension Fresno CountyRefractometer Calibration, Use and MaintenanceStephen Vasquez and Shannon MuellerHarvest season will soon beupon us in the San Joaquin Valley, which means that testing fruitfor maturity will become a dailytask. Proper sampling for sugar isimportant for making decisionson harvesting specific varieties orlocations. Often referred to as“soluble solids” or “sugar” testing, fruit maturity evaluation involves sample collection and testing procedures that accuratelyrepresent the crop. Testing forsugar content in fruit has becomeeasier as technology has improved. However, improved technology cannot eliminate deficiencies in sample collection or errorscaused by poor refractometer careand maintenance. Reviewing thefollowing tips should improve theaccuracy and utility of sugar datain determining fruit maturity.Choosing and Using a HandheldRefractometerreading of zero (Fig. 3). A solution containing sucrose (tablesugar or fruit juice) placed on theprism surface will change the direction of the light significantly.Depending on the amount of sucrose in solution, the ºBrix willrange from 0 to 25 for most agricultural crops. In Figure 4, ananalog refractometer displays areading from a sample that is 17ºBrix.Handheld analog refractometers are convenient because theydo not require an energy source.However, they may not be accurate if used outside the specifiedtemperature range. Older refractometers will give accurate readingsonly when the temperature is at68ºF (20ºC). Both the refractometer and the sample of juice mustbe at this temperature. When temperatures are above or below opti-mal, a corrections table is neededto determine actual ºBrix. Readings can be as much as 0.89 ºBrixlower when the temperature is50ºF (10ºC) if a correction is notmade. If samples are being evaluated at temperatures close to roomtemperature, the difference isprobably of little practical significance. However, if evaluationsare being made outdoors in theheat, then it is important to adjustthe readings by a given factor provided by the manufacturer. Newerrefractometers compensate forfluctuations in temperature, butare still only accurate within aspecified range of temperatures.A range between 68-86ºF (2030ºC) is the most common fortemperature compensated (TC)There are two types of handheld refractometers: analog anddigital (Fig. 1). They work on theprinciple that light entering aprism has a unique characteristic.That characteristic is representedby a value on a scale in unitsknown as ºBrix. When light entersa dry prism, the field of view inan analog refractometer remainsblue (Fig. 2). In a digital refractometer, an error message wouldappear. Both are indications thatthe light is not being interferedwith as it passes through theprism.Pure water placed on the re- Figure 1. Types of available refractometers. The two on the left are digital andfractometer should result in a the two on the right are analog.
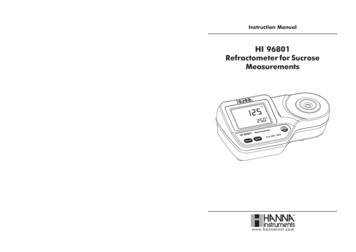
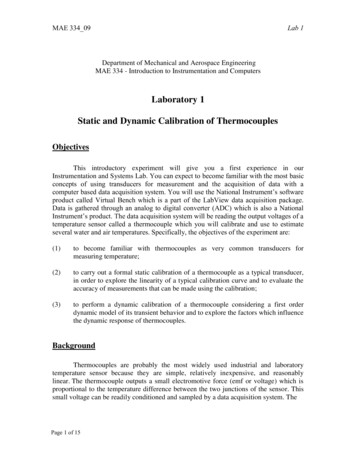
or automatic temperature compensation (ATC) refractometers.Refractometers with larger ATCranges are available, but are moreexpensive.Samples evaluated in the heaton a San Joaquin Valleysummer day will result ininaccurate readings. If using anon-ATC refractometer, as thetemperature increases, accuracy ofthe reading will be compromised.Accuracy improves when samplesare taken back to a lab or officefor processing at room temperature. Figure 5 shows the variabilityin ºBrix readings from samplesevaluated at different times of theday. Note that testing samples during hot weather can give a “false”increase in actual ºBrix. Decidingwhether the difference is significant will depend on how close youare to the critical range for decision-making regarding harvest.If using an analog refractometer, whenever possible, all sampleswithin a specific field or blockshould be read by one person,since readings are somewhatsubjective.Handheld digital refractometers are convenient, often haveATC, and readings are less subjective. Batteries are needed andshould be replaced each season.Juice samples are deposited into awell that allows a light-emittingdiode (LED) to reflect lightthrough the prism. A liquid crystaldisplay (LCD) screen displays theºBrix reading in seconds. Asquickly as you can clean the wellwith water and dry it, the nextsample can be tested. In additionto the hot Valley sun affectingdigital refractometers whenoutside of the optimal ATC range,bright light can interfere withaccuracy. Shading the sample wellwill eliminate the interferencefrom sunlight.Whichever style of refractometer you choose, it is important to identify your objectiveand determine what options areimportant to you. Analog refractometers are popular with growersbecause they are easy to useand relatively inexpensive(approximately 100-200). Adigital refractometer will usuallyresult in more rapid readings andmore accurate data (approximately 300).303025252020151510105500Brix% 20ºCFigure 2. The field of view in ananalog refractometer remains bluewhen only light passes through theprism.CalibrationCalibrating the refractometer isthe first step in evaluating sugarcontent of fruit. It is an easy butoften neglected task. Calibrationverifies the zero baseline reading,ensuring that subsequent fruitjuice sample readings are accurate.Fruit harvest decisions based oninaccurate sugar readings can impact quality, storage durability andsales. Refractometers should becalibrated at the beginning of eachuse and, depending on how manysamples are being measured, periodically throughout the samplingprocess.Proper calibration requires apure water source and testing solutions of known sucrose concentration. Water allows the user to“zero” the refractometer so fruitjuices can be correctly measured.An ideal water source is deionized(DI) or distilled water - water thathas been filtered to remove ionssuch as sodium, calcium, iron andother impurities. In the past, bothtypes of water were available atgrocery stores, but are now difficult to find due to production cost.More common now are the manybrands of bottled drinking water,which have been filtered usingPage 2303025252020151510105500Brix% 20ºCFigure 3. When water is placed on theprism, a contrast line develops at the“0” mark on the scale.303025252020151510105500Brix% 20ºCFigure 4. A solution containing sugarwill display the percent sucrose in ºBrixunits. The sample placed on this prismis displaying 17 ºBrix.
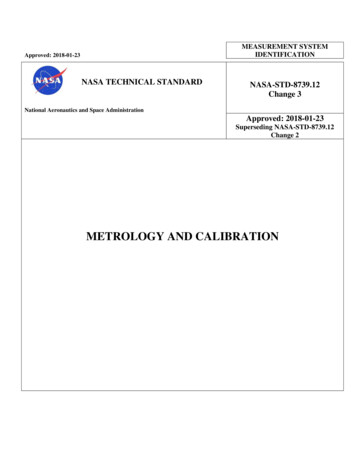
5. Secure the cap and vigorouslyshake each bottle until the sugar iscompletely dissolved. At the end ofthis step, four bottles containing 0, 5,10, and 20 packets of sugar makeyour calibration test kit.14Refractometer Reading (Brix)12108Steps for Calibration6420No sugarLow sugarCool Temperature (66F)Medium sugarHigh sugarRecommended TemperatureHot Temperature (98F)Figure 5. Variability in ºBrix readings as a result of solution temperature. Cooltemperatures did not have as great an effect on the readings as hot temperatures. Standard deviations associated with the high temperature readings arepresented in the graph.reverse osmosis to remove impurities. Test solutions are needed tocalibrate your refractometer. Kitsthat include solutions with knownºBrix values can be purchasedfrom refractometer manufacturers, but can be expensive. Thefollowing method can be used tomake your own calibration testkit, saving yourself hundreds ofdollars.e. A clean, soft, lint-freecloth.2. Carefully remove 5 capfuls ofwater from each bottle to allowroom for the addition of sugar.3. Clearly label each bottle withone of the following designations:0, 5, 10, 20. Marking the bottleand cap using a permanentmarker will maintain the identityof the bottle contents. Count outMaking a Calibration Test Kitthe correct number of sugar pack1. Obtain the following materials ets and place them in front of thebottle with the corresponding(Fig. 6).a. 4 bottles of drinking water number.containing 500ml (16.9 fl 4. Hold the sugar packets up tothe light to make sure contents areoz) each.b. A 100-count box of sugar uniform. Although the box maypackets with each packet indicate that each sugar packetcontaining 3 grams of contains 3 grams of sugar, wefound there was a lot of variabilitysugar. The amount ofin the actual weight of the sugarsugar is specified on thepackets (Figs. 7 and 8). Carefullybox where nutrition inforpour the contents of the specifiedmation is listed.number of sugar packets into eachc. Felt tip marker.bottle. The bottle marked with 5d. TC or ATC refractometer. will receive 5 sugar packets, etc.Page 31. Inspect the refractometer prismfor scratches, chips, separations orother aberrations that may interferewith proper readings (Fig. 9). Ifdusty, rinse with water and wipewith a clean, soft, lint-free cloth.2. Note the temperature at the timeof readings. Most ATC refractometers operate properly in the 68-86ºFrange. A laboratory or office at roomtemperature should be used if outside temperatures exceed the manufacturer's recommended temperaturerange.3. Place a few drops of pure wateron the prism surface. If it is an analog refractometer, close the cover. Ifbubbles form, gently pressing thecover will remove the bubbles andhelp disperse the water over the entire surface. For digital refractometers, make sure that bubbles in thewell are eliminated prior to making areading.Figure 6. Simple field refractometer calibration test kit.
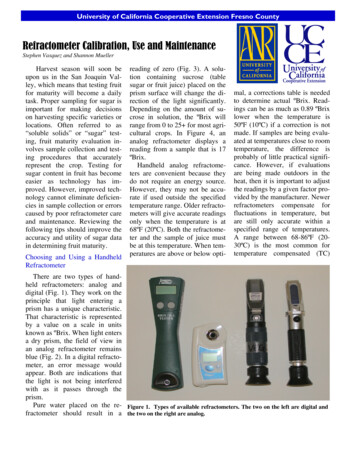
6. Between samples, clean therefractometer prism surface withpure water and wipe dry.7. Repeat steps 5 and 6 withbottles marked 10 and 20.Record the values in Table 1.8. Compare your values withthose in Table 1. If your valuesare outside the expected range,follow the calibration steps a second time. If they are still outsidethe range, read the following“Trouble Shooting” section forhelp.Trouble Shooting TipsFigure 7. Visual difference in contents of commercial sugar packets. Thepacket on the far left is empty and the packet on the far right has the expectedamount of sugar. Arrows indicate level of sugar in each packet.sure that the entire surface is filledand void of bubbles. Note thevalue and write it in Table 1 underYour Value. For digital refractometers, place the solution in the welland press the start button. Recordthe value in Table 1. The valuewill remain on the LED displayuntil the next sample is read.2. Check to make sure that500ml water bottles and 3g sugarpackets were used.3. Check to make sure that 5capfuls of water were removedbefore adding sugar.4. Check to make sure that thepackets had close to the sameamount of sugar in them and thatthe appropriate number of packets were added to each of thebottles.3.5A verag e G ram s o f Su g ar p erPacket4. Hold the refractometer up tonatural light or an incandescentbulb to obtain the reading. Looking into the eyepiece, one shouldsee a distinct separation between ablue and white section, oftencalled a “contrast” line. If the contrast line is not directly at zero,then adjust by turning the screw onthe top of the refractometer until itreads zero (Fig. 3). Replace theplastic cap after adjusting the calibration screw to prevent waterfrom entering the refractometer.You can adjust the focus by twisting the eyepiece until the scale canbe seen clearly. Once the refractometer is calibrated to zero withpure water, dry the surfaces with aclean cloth. Digital refractometersshould be calibrated by pressingthe zero button with water in thewell.1. Check to make sure that thebottled water used was unopened/new.32.521.510.50B r a nd A ( 3 g)B r a nd B ( 3 . 5 g)B r a nd C ( 3 g)Figure 8. Chart documenting the variability in grams of sugar per packet in com-5. Place some of the solution mercially packaged sugar. The numbers in parentheses following the Brand desigfrom the 5-packet bottle on the nation are the contents specified on the labels. 25 packets of each brand wereprism and close the cover, making weighed.Page 4
Table 1. Simple field refractometer calibration test kit expected 3.45.0-6.020-packet11.040.26010.6-11.8Your Value* Refractometers are accurate 0.2% when used under normal conditions.5. Check to see if the refractometer is temperature compensating. If it is not, a corrections tableis needed to make adjustments.The corrections table is only validif the temperature was recordedfor each reading.6. Check to make sure that anATC refractometer was usedwithin its range of 68-86ºF.7. Check to make sure that thesolution is within the temperaturerange of the ATC refractometer.8. Replace the batteries inthe digital refractometer at thebeginning of each season.MaintenanceRefractometers are analyticalinstruments that must be properly maintained for accuratereadings. Here are some simpletips to assure accurate readingsfrom season to season.Refractometers should not beexposed to wet environments.After each reading or beforestoring the refractometer, theprism should be thoroughlycleaned with water and dried.If the field of view in an analogrefractometer becomes cloudy, itmost likely has been immersed inwater and can only be fixed by aprofessional technician. Exposing a digital refractometer toexcess water may damage theinternal electronics.Do not evaluate solutions thatthe refractometer is not made for.If your goal is to read sugarsamples, do not try to measuresaline solutions. Doing so willcompromise the instrument.Purchase a refractometer madefor the solution you are interestedin evaluating.Handle your refractometer withcare. Dropping it can break,scratch, or displace the opticsand/or prism.Store your refractometer in alocation that has a constanttemperature. Storing it in alocation that has more than a 5ºFdifference each day will severelycompromise the optics andprism.Stephen Vasquez is the UCCooperative Extension viticulture farm advisor in FresnoCounty.Shannon Mueller is the UCCooperative Extension agronomyfarm advisor in Fresno County.Figure 9. Poorly maintained refractometer with a damaged prism. Scratches,separations, and detached prism noted by arrows.Page 5
calibrate your refractometer. Kits that include solutions with known ºBrix values can be purchased from refractometer manufactur-ers, but can be expensive. The following method can be used to make your own calibration test kit, saving yourself hundreds of dollars. Making a Calibration Test Kit 1. Obtain the following materials (Fig. 6). a.