Transcription
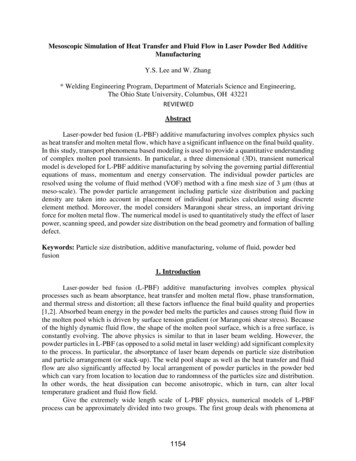
Mesoscopic Simulation of Heat Transfer and Fluid Flow in Laser Powder Bed AdditiveManufacturingY.S. Lee and W. Zhang* Welding Engineering Program, Department of Materials Science and Engineering,The Ohio State University, Columbus, OH 43221REVIEWEDAbstractLaser-powder bed fusion (L-PBF) additive manufacturing involves complex physics suchas heat transfer and molten metal flow, which have a significant influence on the final build quality.In this study, transport phenomena based modeling is used to provide a quantitative understandingof complex molten pool transients. In particular, a three dimensional (3D), transient numericalmodel is developed for L-PBF additive manufacturing by solving the governing partial differentialequations of mass, momentum and energy conservation. The individual powder particles areresolved using the volume of fluid method (VOF) method with a fine mesh size of 3 m (thus atmeso-scale). The powder particle arrangement including particle size distribution and packingdensity are taken into account in placement of individual particles calculated using discreteelement method. Moreover, the model considers Marangoni shear stress, an important drivingforce for molten metal flow. The numerical model is used to quantitatively study the effect of laserpower, scanning speed, and powder size distribution on the bead geometry and formation of ballingdefect.Keywords: Particle size distribution, additive manufacturing, volume of fluid, powder bedfusion1. IntroductionLaser-powder bed fusion (L-PBF) additive manufacturing involves complex physicalprocesses such as beam absorptance, heat transfer and molten metal flow, phase transformation,and thermal stress and distortion; all these factors influence the final build quality and properties[1,2]. Absorbed beam energy in the powder bed melts the particles and causes strong fluid flow inthe molten pool which is driven by surface tension gradient (or Marangoni shear stress). Becauseof the highly dynamic fluid flow, the shape of the molten pool surface, which is a free surface, isconstantly evolving. The above physics is similar to that in laser beam welding. However, thepowder particles in L-PBF (as opposed to a solid metal in laser welding) add significant complexityto the process. In particular, the absorptance of laser beam depends on particle size distributionand particle arrangement (or stack-up). The weld pool shape as well as the heat transfer and fluidflow are also significantly affected by local arrangement of powder particles in the powder bedwhich can vary from location to location due to randomness of the particles size and distribution.In other words, the heat dissipation can become anisotropic, which in turn, can alter localtemperature gradient and fluid flow field.Give the extremely wide length scale of L-PBF physics, numerical models of L-PBFprocess can be approximately divided into two groups. The first group deals with phenomena at1154
the engineering scale (e.g., mesh size on the order of 1 mm). For instance, finite element method(FEM) based models are employed to describe the evolution of temperature, stress anddisplacement fields during L-PBF [3,4]. Obviously, given the coarse mesh resolution, melting ofpowder particles in individual tracks are not simulated in the FEM based models, although thosemodels can easily study the global variation of temperature, residual stress and distortion in theentire part. The second group comprises meso-scale models capable of resolving individualpowder particles (e.g., mesh size on the order of 1 µm). An example of such meso-scale models isthe two dimensional (2D) heat transfer and fluid flow model based on lattice Boltzmann method(LBM) developed by Korner et al. for single layer [5] and multiple layers [1]. The free surface wastracked using the volume of fluid method (VOF). The 2-D model was used to create a process mapwhich showed that the molten pool characteristics were considerably affected by laser scanningspeed, beam power and powder packing density. Three dimensional (3D) model based on LBMwas developed by Khairallah and Anderson [6] and by Gurtler et al. [7]. Consideration of particlesize distribution and stack-up varied from model to model from simple mono-size [7] to randomsize distribution [5]. It is noted that LBM is a newer method than the conventional finitedifference/volume method to solve the governing transport equations. Even at a mesh (cell) sizeof 3 µm, the LBM is computationally demanding, which can easily consume on the order of 10,000CPU hours. Moreover, it can be difficult to consider some important temperature dependentmaterial properties such as surface tension gradient and viscosity which can influence heat transferand fluid flow behavior.The present paper uses two models in sequence. The first model is a powder particlepacking model based on discrete element method (DEM). It provides the particle stack-upinformation (e.g., locations and radii of individual particles). Such information is then input intothe second model, which is a high resolution but computationally less demanding, heat transferand fluid flow model based on the finite difference method and VOF. This 3D transient model isapplied to understand the correlation of powder packing characteristics, process parameters, andmolten pool dynamics to the resultant surface quality (e.g., balling defect).2. Numerical modeling approach2.1. Discrete element method simulation of powder packingDEM is a well-established numerical method that is capable of simulating the motion of alarge number of individual particles including contact interactions between particles/particles andparticles/walls. In the present study, a powder packing model is developed based on Yade, an opensource software package for DEM. For brevity, only salient features of the DEM model aredescribed below and the details are available in Yade documentation [8].The powder particles are simplified as elastic spheres with different radii and the powdercontainer is treated as rigid walls. Each particle has six velocity components: three translationaland three rotational in the x, y and z axis of a Cartesian coordinate system. To efficiently track thelarge number of contact interactions, a Hertz based soft-contact formula is used which permits afinite overclosure locally at the contact point between particles. The normal contact force is thencalculated using the Hertz solution of force versus overclosure. The tangential forces are calculatedusing the Coulomb friction law. These contact forces are summed together with the gravitationalforce to obtain the total forces and moments exerting on a particle. The solution process in DEMis the following. At each time step, the total forces and moments for individual particles are1155
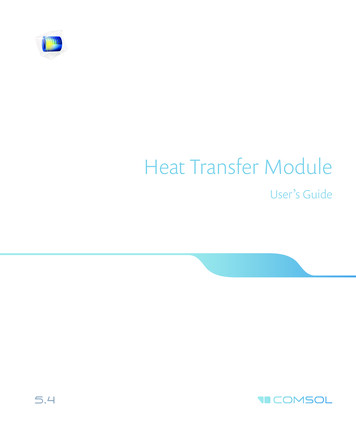
calculated based on the procedure above. Next, the velocities are calculated by solving Newton’ssecond law of motion. Finally, the particle positions are updated with distances traveled (i.e.,multiplication of velocities and time step size) and the calculation continues to the next time step.To study the effect of particle size on the molten pool dynamics, two particle sizedistributions (PSDs) are considered, as shown in Fig. 1. Both PSDs have the same range of particleradii from 10 µm (minimum) to 20 μm (maximum). Fig. 1(a) and 1(b) show a positively skewedPSD (abbreviated as PSD ) with a mean radius of 12.7 μm and a negatively skewed PSD(abbreviated as PSD-) with a mean radius of 17.3 μm, respectively. As shown in Fig. 1(c), PSD contains a higher fraction of small particles. For example, 90% of the particles in PSD have aradius less than 14 µm, while that fraction is only 8% in PSD-.The spherical particles considered in the present DEM simulation are made of INCONEL Alloy 718 (IN718), a nickel alloy with good high-temperature strength. The key material propertiesfor DEM include Young’s modulus 195 GPa, and friction coefficient between particles 0.3. Inthe DEM simulation, a cloud of particles with the given PSD is first generated inside a rectangularbox without any overclosure among particles. The particles then fall down onto the floor of thecontaining box by gravity and eventually settled down. In the DEM, the packed particles are thensubject to a roller with a clearance of 50 µm to create a nominally 50-µm-thick layer. The positions(i.e., x, y and z coordinates) and radii of the stabilized particle are then exported and used to definethe initial geometry in the subsequent heat transfer and fluid flow model described in the followingsection.Figure 1: Histograms of (a) positively skewed PSD, (b) negatively skewed PSD, and (c)cumulative size frequency for the two PSDs in (a) and (b).1156
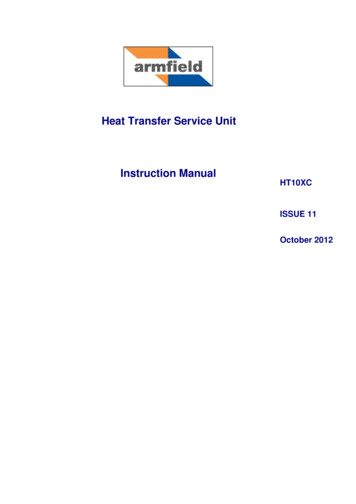
2.2 Governing equations for heat transfer and fluid flowThe L-PBF process simulation is preformed based on numerical solution of mass, energyand momentum conservation equations, which are given in Eqns. (1) through (3), respectively.Mass: ℎEnergy: 𝑡Momentum:⃗⃗ 𝑣 𝑡 𝑣⃗ 0.1 (𝑣⃗ )ℎ 𝜌 ( 𝜆 𝑇).1 (𝑣⃗ )𝑣⃗ 𝜌 𝑃 𝜇 2 𝑣⃗ 𝑔⃗[1 𝛽(𝑇 𝑇𝑚 )].(1)(2)(3)where 𝑣⃗ is molten metal velocity, h is enthalpy, t is time, ρ is fluid density, T is temperature, λ isthermal conductivity, P is hydrodynamic pressure, μ is viscosity, 𝑔 is gravitational acceleration inz direction, β is coefficient of thermal expansion, and Tm is melting temperature of material. InEqns. (1) and (3), the fluid is assumed to be incompressible and Newtonian with laminar flow.The position of molten pool surface is not known a priori. The VOF method is used totrack the position and shape of the molten pool surface (free surface). It solves a scalartransportation equation for the volume fraction of fluid in a cell (F) as:VOF: 𝐹 𝑡 (𝑣⃗𝐹) 0.(4)A cell is void when F 0, and completely occupied by the fluid when F 1. When thevalue of F is between 0 and 1, an interface between the fluid and void exists in the cell.The conversation equations (1) through (4) are discretized and then solved using thefinite difference method in Flow-3D, a commercial computational fluid dynamics (CFD) code.Details of the discretization and solution steps are available in the literature [9,10].2.3 Computational domain, boundary conditions and materials propertiesThe transient simulation is performed in a 3D computation domain with 1000 μm (length),270 μm (width) and 190 μm (height), as shown in Fig. 2. The domain comprises a 50-μm-thicklayer of powder particles laying on a 90-μm-thick substrate. The reminder of the domain is initiallyfilled with void. The powder layer geometry is initialized using the results from the previous DEMsimulation. To maximize spatial resolution while reducing the total number of cells, biasedmeshing is utilized where the mesh size reduces continuously from 9 μm to 3 μm in the substratetoward the substrate/powder layer interface. The mesh size is kept constant 3 μm in the powderlayer and the void above it. The total number of cells is 1.43 million.Figure 2: Schematic description of computational domain.1157
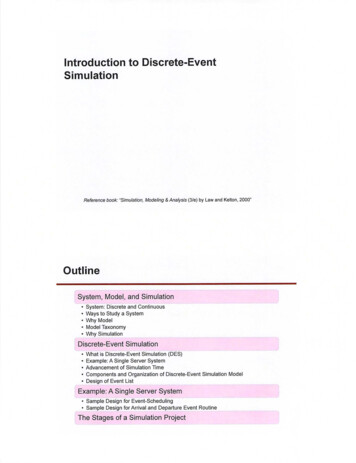
The primary boundary condition for solving the energy conservation equation is the heatinput from the scanning laser beam. The absorption of laser energy by the powder particles iscomplex. To make the simulation tractable, a prescribed heat flux boundary condition based onGaussian distribution is imposed on the top surface of the powder layer [11]. For the molten metalfluid flow, the temperature dependent surface tension and the resultant Marangoni shear stress areimportant driving forces for both the molten metal convection and the evolution of free surfaceshape. In the present study, the temperature dependency of surface tension is included with animproved surface tension model available in Flow-3D [9].The temperature dependent thermos-physical properties of IN718 including density,thermal conductivity, specific heat and liquid metal viscosity are plotted in Fig. 3 [9]. Additionalthermos-physical properties and L-PBF processing parameters are summarized in Table 1 [9].Figure 3: Thermos-physical properties of IN718. Note 1 erg 10-7 joules.Table 1: Additional thermos-physical properties of IN718 and L-PBF processing parameters.Property and ParametersValue [units]LiquidusSolidusSurface TensionTemperature Coefficient ofSurface TensionLaser Beam Spot SizeLaser PowerScanning SpeedPowder Packing Density1608.15 [K]1523.15 [K]1882 [g/s2]-0.1 [g/s2 K]100 [μm]150 and 200 [W]1.1 and 2.3 [m/s]38 and 45 [%]1158
As described previously, even for the fairly small computational domain shown in Fig. 2,there are more than 1 million cells in order to accurately resolve the individual particles. At thislevel of resolution, the transient simulation of about 600-microseconds-long L-PBF takesapproximately 40 hours clock time to finish in a moderately powerful workstation with Intel Xeon Processor E5335 and 4 GB RAM. Compared with thousands of CPU hours needed byLBM, the present model based on finite difference method and VOF, incorporating temperaturedependent surface tension, is more computationally efficient. Obviously, the current domain islimited to simulating a single linear track of laser melting. To consider more complex laserscanning patterns and multilayers, the present model will need to be scaled up by utilizingdistributed memory parallel computing in the future. Nevertheless, the present model allows thestudy of the correlation of powder packing characteristics, process parameters, and molten pooldynamics to the resultant surface quality, as discussed in the following.3. Result and discussion3.1 Stack-up of powder particles with different PSDsFig. 4 plots a 3D view of the stack-up of powder particles calculated using the DEM modelfor those two different PSDs in Fig. 1. The spherical particles are colored based on their respectiveradii. As shown in Fig. 4(a), the 50-µm-thick region filled with particles of PSD is made up withtwo layers of small particles at the majority of locations. This is due to the large fraction of smallerparticles in PSD . On the other hand, the region filled with particles of PSD- is mostly made upwith a single layer of larger particles, as shown in Fig. 4(b). The packing density, defined as theratio of the occupied volume by the particles to the total volume enclosing all the particles, is about38% for both PSDs.Figure 4: Stack-up of spherical particles with different particle size distributions calculated usingDEM: (a) PSD containing a high fraction of smaller particles, and (b) PSD- containing largerparticles. The radii are given in mm.3.2. Fluid flow and molten pool shapeFig. 5 plots the longitudinal section view (i.e., a section parallel to the laser travel direction)of temperature and velocity fields in the molten pool at time 55μs. The temperatures are plottedas color contours and the velocities as arrows. The magnitude of the velocity is represented by thelength of an arrow. The molten pool boundary is represented by the isotherm at 1608.15 K, which1159
is the liquidus temperature of IN718. As shown to the right side of Fig. 5, a particle is partiallymelted into the molten pool. Near the molten pool surface, the molten metal is pulled from thecenter location directly underneath the laser beam to the rear end of the pool. Such flow pattern isdriven by the temperature-dependent surface tension. In other words, the center directlyunderneath the laser is heated to a higher temperature than the rear end. As a result, the surfacetension is lower in the center than the rear end, which drives the molten metal flowing backwardnear the surface. Such backward flow is strong, resulting in an anticlockwise pattern as the moltenmetal returns from the rear end to the center inside the pool. Moreover, some of the molten metalpushed to the back flows radially and returns back to the front.The backward flow of molten metal near the pool surface produces a surface profile that isdepressed underneath the laser beam while it forms a hump toward the rear end of the pool. Asdiscussed in the following section, the humped shape can lead to the formation of balling.Figure 5: Longitudinal section view of heat transfer and fluid flow in the molten pool. Theparameters are scanning speed 1.1m/s, laser power 150W, packing density 45%, and PSD .3.3. Formation of balling defectBalling is a defect that can occur when the molten pool becomes discontinuous and breaksinto separated islands. Using the heat transfer and fluid flow model, it is quantitatively studied theeffect of various parameters, which include PSD, scanning speed, laser beam power and powderpacking density, on the formation of balling defect in L-PBF. The results are described as follows.3.3.1. Effect of particle size distributionA 3D view of the molten pool temperature field for the two different PSDs is shown in Fig.6. For clarify, the fluid velocities are not plotted. For either PSD, the molten pool is continuousand the balling defect does not occur. On the other hand, the molten pool shape appears smootherfor the case with PSD in Fig. 6(a) than that with PSD- in Fig. 6(b). As discussed previously,PSD contains a large fraction of smaller particles. For the same laser energy, smaller particlesare more likely to be melted completely due to their smaller volume/mass, whereas larger particlesare more likely to be partially melted. As a result, the molten pool formed by partially melted,large particles creates a more corrugated edge. This observed effect of PSD from the simulationresults is consistent with the literature data that smaller particles can help reduce the surfaceroughness [12,13].1160
Figure 6: Calculated temperature fields showing the molten pool profile for (a) PSD and (b) PSD-.The parameters are scanning speed 1.1 m/s, laser power 200W, and powder packing density 38%.3.3.2. Effect of scanning speedA faster scanning speed without defects is always desirable for higher productivity.However, if the scanning speed is too high, the molten pool may become so elongated that it canbreak into separate islands. Such formation of balling defect is illustrated in Fig. 7, for which theprocessing conditions are the same as those for Fig. 6(a) except that the scanning speed is increasedto 2.3 m/s from 1.1 m/s. As shown in this figure, there is a very shallow melting of the substratedue to the high scanning speed and the resultant low heat input per unit length. Small disconnectedislands (or balls) are formed in the trailing end of the molten pool. Such separate islands at the fastscanning speed are in contrast to the continuous, smooth molten pool at the slow scanning speedshown in Fig. 6(a).Figure 7: (a) 3D view and (b) 2D longitudinal section view of molten pool for the fast scanningspeed at 2.3 m/s. All other conditions, i.e., laser power 200W, powder packing density 38%,and PSD , are the same as those in Fig. 6(a).A mechanism for forming the disconnected balls in high speed laser melting is attributedto the Rayleigh instability [14]. In particular, it states that the instability is initiated when the lengthto width ratio of the molten pool is greater than π. As the laser scanning speed increases, the moltenpool length increases while the pool width would decrease slightly. Hence, the length to widthratio increases with faster scanning speed, which leads to a larger instability. Other factors forformation of balling defect in L-PBF include the local powder particle arrangement, wetting,Marangoni flow and gravity [5].To further understand the formation of balling defect in L-PBF, the transient evolution ofmolten pool profile is illustrated in Fig. 8. As shown in this series of images, the primary molten1161
pool directly underneath the laser beam is not stable and the rear end quickly breaks apart fromthe front to form a separate island. It is interesting to observe that the separation initiates from avoid in the middle of the molten pool, as shown in Fig. 8(c). This void expands as the lasercontinues to travel forward, eventually breaking the molten pool into two parts, as shown in Fig.8(e) and 8(f). The formation of void and its expansion are likely caused by the strong backwardflow driven by the surface tension described previously. The length to width ratio for the moltenpool shown in Fig. 8 is approximately 2.3, which is lower than the threshold ratio for Rayleighinstability. This indicates that the relatively low packing density (when compared to a solid) couldincrease the likeliness of forming the balling defect.Figure 8: Evolution of molten pool profile illustrating the formation of balling defect.3.3.3. Effect of laser powerFrom the perspective of heat input per unit length, a faster travel speed is equivalent to alower laser power. To examine the effect of lowering the laser power on the formation of ballingdefect, a laser power of 150W is considered while all other conditions are kept the same as thosein Fig. 6(a). As shown in Fig. 9, a reduction in the laser power indeed results in a discontinuousmolten pool and the formation of balling defect. On the contrary, a higher laser power is desirableto minimize the balling defect when faster travel speed is used. However, the literature data hasshown an overly high laser power can worsen the surface finish [13]. The effect of high laser poweron surface roughness will be the subject of a future study.1162
Figure 9: (a) 3D view and (b) 2D longitudinal section view of molten pool for the low laser powerof 150 W. All other conditions, i.e., scanning speed 1.1 m/s, powder packing density 38%, andPSD , are the same as those in Fig. 6(a).3.3.4. Effect of packing densityThe last factor to be examined is the powder packing density. Literature data has shownthat a higher powder packing density is desirable to produce dense parts with better surface finish[1,15]. Figure 10 shows the molten pool profile for a packing density of 45%. All other parametersare the same as those in Fig. 9. As shown in Fig. 10, an increase in packing density from 38% to45% eliminates the discontinuous molten pool and produces a smoother surface contour. Asdiscussed previously, the balling defect initiates from a void at the center of the molten pool (seeFig. 8). Higher packing density is expected to reduce the formation of such void due to a largermass to fill any new void. In addition, it is reported that a relatively lower packing density enhancesfluid convection especially in the downward direction driven by gravity due to higher porosity[16]. Such strong downward fluid convection can further increase the instability of the molten pool,resulting in formation of balling defect.Figure 10: (a) 3D view and (b) 2D longitudinal section view of molten pool for the high powderpacking density of 45%. All other conditions, i.e., laser power 150 W, scanning speed 1.1 m/s,and PSD , are the same as those in Fig. 9.1163
4. Summary and conclusionIn summary, the 3D transient simulation of heat transfer and fluid flow in L-PBF isconducted to provide a quantitative understanding of the effect of key processing parameters onbead geometry and formation of balling defect. The 3D model solves the continuum conservationequations at the meso-scale level with a mesh size of 3 µm to accurately resolve individual powderparticles. The initial powder stack-up is calculated using a DEM based model and inputted into the3D model. Through the numerical investigation of a variety of processing variables, the followingconclusions can be drawn: A positively skewed particle size distribution containing a high fraction of smaller particlesresults in a smoother contour of the melt pool than the negatively skewed one containing ahigh fraction of larger particles.The formation of balling defect initiates from a void at the center of the molten pool. Asthe void expands, the molten pool breaks apart into separate islands.A faster travel speed and lower laser power can increase the likeliness of forming theballing defect.In addition to Rayleigh instability designated by the length to width ratio of the moltenpool, the powder particle arrangement (i.e., the powder packing density) has a significanteffect on the formation of balling defect. A higher packing density is found to reduce thelikeliness of forming such defect.Although only a simple linear track is simulated, the present model shows the importance ofpowder level simulation in studying the meso-scale phenomena including molten pool surfaceprofile and formation of baling defect, which are important attributes of the final build quality.AcknowledgementsThe authors would like to acknowledge the grant from Office of Naval Research (ONR), AwardNo. N00014-14-1-0688, in support of the research.References1. Korner C, Bauereiss A, Attar E (2013) Fundamental consolidation mechanisms during selective beammelting of powders. Model Simul Mater Sci Eng 21(8):085011.2. Klassen A, Bauereiss A, Korner C (2014) Modelling of electron beam absorption in complexgeometries. J Phys D-Appl Phys 47(6):065307.3. King W, Anderson AT, Ferencz RM, Hodge NE, Kamath C, Khairallah SA (2015) Overview of modellingand simulation of metal powder bed fusion process at lawrence livermore national laboratory.Mater Sci Technol 31(8):957-968.4. Matsumoto M, Shiomi M, Osakada K, Abe F (2002) Finite element analysis of single layer forming onmetallic powder bed in rapid prototyping by selective laser processing. Int J Mach Tools Manuf42(1):61-67.5. Korner C, Attar E, Heinl P (2011) Mesoscopic simulation of selective beam melting processes. J MaterProcess Technol 211(6):978-987.6. Khairallah SA, Anderson A (2014) Mesoscopic simulation model of selective laser melting of stainlesssteel powder. J Mater Process Technol 214(11):2627-2636.1164
7. Gurtler FJ, Karg M, Leitz KH, Schmidt M (2013) Simulation of laser beam melting of steel powdersusing the three-dimensional volume of fluid method. Phys Proced 41:874-879.8. Šmilauer V, Catalano E, Chareyre B, Dorofeenko S, Duriez J, Gladky A, Kozicki J, Modenese C, ScholtèsL, Sibille L, Stránský J, and Thoeni K (2010) Yade documentation (šmilauer v, ed.), The Yade project,1st ed., http://yade-dem.Org/doc/9. Flow3d: Version 11.0.1.2 (2014): User manual, Flowscience, Santa Fe, NM, USA.10. Cho MH, Lim YC, Farson DF (2006) Simulation of weld pool dynamics in the stationary pulsed gasmetal arc welding process and final weld shape. Weld J 85(12):271S-283S.11. Boley CD, Khairallah SA, Rubenchik AM (2015) Calculation of laser absorption by metal powders inadditive manufacturing. Appl Optics 54(9):2477-2482.12. Spierings A, Levy G (2009) Comparison of density of stainless steel 316L parts produced withselective laser melting using different powder grades. In Proc of the Annual Int Solid FreeformFabrication Symp. University of Texas at Austin, Austin, pp 342-35313. Liu B, Wildman R, Tuck C, Ashcroft I, Hague R (2011) Investigation the effect of particle sizedistribution on processing parameters optimisation in selective laser melting process. In Proc of theAnnual Int Solid Freeform Fabrication Symp, University of Texas at Austin, Austin. pp 227-23814. Kruth JP, Levy G, Klocke F, Childs THC (2007) Consolidation phenomena in laser and powder-bedbased layered manufacturing. CIRP Ann-Manuf Technol 56(2):730-759.15. Spierings A, Herres N, Levy G (2011) Influence of the particle size distribution on surface quality andmechanical properties in am steel parts. Rapid Prototyping J 17(3):195-202.16. Attar E (2011) Simulation of selective electron beam melting processes. PhD thesis, University ofErlangen-Nuremberg, Erlangen, Germany1165
Mesoscopic Simulation of Heat Transfer and Fluid Flow in Laser Powder Bed Additive Manufacturing . Y.S. Lee and W. Zhang * Welding Engineering Program, Department of Materials Science and Engineering, The Ohio State University, Columbus, OH 43221 . Abstract . Laser-powder bed fusion (L-PBF) additive manufacturing involves complex physics such