Transcription
C O M P R E H E N S I V EH O U S I N GM A R K E TA N A L Y S I SProvo-Orem, UtahU.S. Department of Housing and Urban DevelopmentOffice of Policy Development and ResearchAs of October 1, 2012SummaryEconomyTooeleWyomingBox ElderRichernWebargMoDavisSalt sing Market eThe Provo-Orem Housing Market Area(HMA), approximately 35 miles south ofSalt Lake City, consists of Juab and UtahCounties. For purposes of this analysis,the HMA is divided into two submarkets:the Provo-Orem submarket, consisting ofthe Provo-Orem Census County Division(CCD), and the Remainder submarket,comprising Juab County and the area ofUtah County outside the Provo-Orem CCD.The HMA is the third largest metropolitanarea in the state, with a current estimatedpopulation of 554,400. Table DP-1 at theend of this report provides demographic datafor the HMA from 2000 to the current date.The two large postsecondary schools inthe Provo-Orem HMA, Brigham YoungUniversity (BYU) and Utah Valley University (UVU), had a combined economic impact of nearly 1.3 billion in2011. During the 12 months endingSeptember 2012, nonfarm payrolls increased by 4,600 jobs, or 2.6 percent, toan average of 186,100 jobs. During thesame period, employment gains in theHMA contributed to decreasing theaverage unemployment rate from 7.0 to5.6 percent. Table DP-1 at the end ofthis report provides employment datafor the HMA.Sales MarketSales housing market conditions in theHMA are soft, with a current estimated vacancy rate of 2.0 percent.During the 3-year forecast period,demand is expected for 7,940 newhomes in the HMA (Table 1). Demandis anticipated for 790 new homes in theProvo-Orem submarket and 7,150 newhomes in the Remainder submarket. Aportion of the estimated 3,625 othervacant units in the HMA may reenterthe market and satisfy some of theforecast demand.Rental MarketThe rental housing market in the HMAis tight, with an estimated vacancy rateof 3.6 percent. Demand is expected for1,390 new market-rate rental units inthe HMA during the 3-year forecastperiod (Table 1). In the Provo-Oremsubmarket, demand is anticipated forapproximately 610 rental units. In theRemainder submarket, the 240 unitsunder construction and the 460 additional planned completions will meetmost of the estimated demand for 780units during the forecast period.Market DetailsEconomic Conditions. 2Population and Households. 5Housing Market Trends. 7Data Profiles. 13
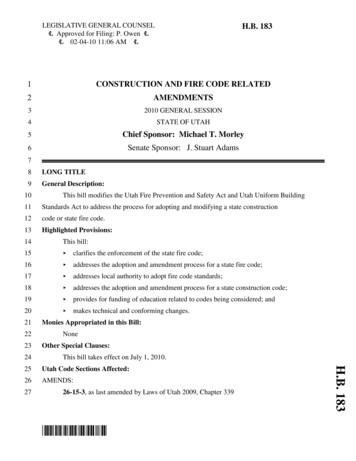
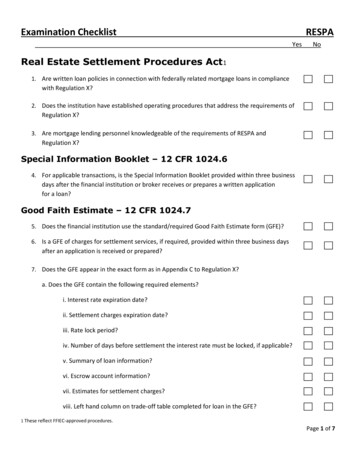
2Summary ContinuedTable 1. Housing Demand in the Provo-Orem HMA, 3-Year Forecast,October 1, 2012, to October 1, 2015Provo-Orem HMAP r o v o - O r e m , U T C O M P R E H E N S I V E H O U S I N G M A R K E T A N A LY S I STotal 4010030240Notes: Total demand represents estimated production necessary to achieve a balanced marketat the end of the forecast period. Units under construction as of October 1, 2012. A portionof the estimated 3,625 other vacant units in the HMA will likely satisfy some of the forecastdemand. Numbers may not add to totals because of rounding.Source: Estimates by analystEconomic ConditionsEconomic conditions strengthened in the Provo-OremHMA during the past year. Nonfarmpayrolls recorded a gain of 4,600 jobs,or 2.6 percent, during the 12 monthsending September 2012, to approximately 186,100 jobs. From 2008through 2010, payrolls declined by anaverage of 4,300 jobs, or 2.3 percent,annually, as the HMA suffered theeffects of the national recession. Thedeclines were concentrated in themining, logging, and constructionand the manufacturing sectors, withannual average losses of 2,550 and1,450 jobs, or 16.8 and 7.6 percent,respectively. By contrast, from 2000through 2007, nonfarm payrollsincreased by an average of 5,000 jobs,or 3.2 percent, annually, led by average annual gains of 1,050 and 1,275,or 9.1 and 4.3 percent, respectively, inthe mining, logging, and constructionand the education and health servicessectors. The goods-producing sectorsin the HMA have declined since2000, but additions in the serviceproviding sectors have more thanoffset those losses (Figure 1). Becauseof the economic growth from 2000through 2007, the unemployment ratedecreased from a high of 5.8 percentin 2002 to 2.5 percent in 2007. As theeconomy slowed in 2008, however,the unemployment rate began to rise,peaking at 8.0 percent in 2010 before declining to 6.6 percent in 2011(Figure 2). During the 12 monthsending September 2012, the laborforce in the HMA increased by 600,and resident employment increasedby 3,675, contributing to a decline inthe unemployment rate from 7.0 to 5.6percent.The three largest employers in theHMA are BYU, Utah Valley Regional Medical Center, and UVU, with17,000, 4,500, and 3,500 employees,respectively. Table 2 lists the largestemployers in the HMA. BYU andUVU provide stability to the HMAeconomy. According to a BYU economic impact analysis, the universitycontributed more than 750 millionto the HMA economy during 2010.The economic impact of UVU in2011 was 535 million, according
3Economic Conditions ContinuedFigure 1. Sector Growth in the Provo-Orem HMA, Percentage Change, 2000 to CurrentTotal Nonfarm Payroll JobsGoods ProducingMining, Logging, & ConstructionManufacturingService ProvidingTransportation & UtilitiesInformationFinancial ActivitiesProfessional & Business ServicesEducation & Health ServicesLeisure & HospitalityOther ServicesGovernment– 1001020403050Note: Current is based on 12-month averages through September 2012.Source: U.S. Bureau of Labor StatisticsFigure 2. Trends in Labor Force, Resident Employment, and Unemployment Rate in the Provo-Orem HMA, 2000 Through 00180,0002.0Unemployment Rate230,000Labor Force &Resident Employment170,0000.011102009Resident Employment20200807205062020042003Labor Force200220001202000160,00020P r o v o - O r e m , U T C O M P R E H E N S I V E H O U S I N G M A R K E T A N A LY S I SWholesale & Retail TradeUnemployment RateSource: U.S. Bureau of Labor StatisticsTable 2. Major Employers in the Provo-Orem HMAName of EmployerBrigham Young UniversityUtah Valley Regional Medical CenterUtah Valley UniversityWal-Mart Stores, Inc.APX Alarm Security Solutions, Inc.IM Flash Technologies, LLCNestle USA, Inc.ESG Administration, Inc.Macy’s Inc.Novell, Inc.Note: Excludes local school districts.Source: Economy.comNonfarm Payroll SectorNumber ofEmployeesEducation & Health Services17,000Education & Health Services4,500Government3,500Wholesale & Retail essional & Business Services 1,500Professional & Business Services875Wholesale & Retail Trade875Professional & Business Services875to a university study. The educationand health services sector, the largestemployment sector in the HMA,averaged 42,250 jobs during the 12months ending September 2012, anincrease of 1,000 jobs, or 2.5 percent,from the previous 12-month period.The educational services subsector,which includes BYU staff becausethe university is private, remainedrelatively stable, averaging 20,700jobs from 2006 through 2011. Thehealthcare and social assistancesubsector averaged 21,000 jobs duringthe 12 months ending September2012, an increase of 900 jobs, or 4.5percent, from a year ago.Nearly every payroll sector gainedjobs during the 12 months endingSeptember 2012. Gains in the professional and business services andmanufacturing sectors, which increased by 2,650 and 9,500 jobs, or11.4 and 5.8 percent, respectively, lednonfarm payroll growth (Table 3).The leisure and hospitality sector
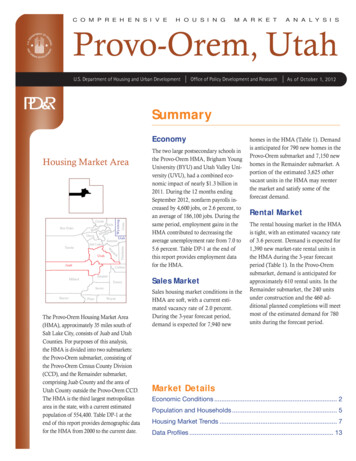
4Economic Conditions ContinuedP r o v o - O r e m , U T C O M P R E H E N S I V E H O U S I N G M A R K E T A N A LY S I STable 3. 12-Month Average Nonfarm Payroll Jobs in the Provo-OremHMA, by Sector12 MonthsEndingSeptember 201112 MonthsEndingSeptember .94.11.211.42.5– 7.6– 0.60.8Total Nonfarm Payroll JobsGoods ProducingMining, Logging, & ConstructionManufacturingService ProvidingWholesale & Retail TradeTransportation & UtilitiesInformationFinancial ActivitiesProfessional & Business ServicesEducation & Health ServicesLeisure & HospitalityOther ServicesGovernmentNotes: Based on 12-month averages through September 2011 and September 2012. Numbersmay not add to totals because of rounding.Source: U.S. Bureau of Labor Statisticsdeclined by 1,100 jobs, or 7.6 percent.Figure 3 shows the share of currentnonfarm payrolls by sector.During the 3-year forecast period, jobgains are expected to average 6,200,or 3.2 percent, annually. The professional and business services sector isexpected to lead employment growthduring the forecast period. Employment growth is anticipated duringFigure 3. Current Nonfarm Payroll Jobs in the Provo-Orem HMA,by SectorMining, Logging, & Construction 5.9%Government 14.8%Manufacturing 9.4%Other Services 2.3%Leisure & Hospitality 7.1%Wholesale & Retail Trade 14.7%Transportation & Utilities 1.5%Education & HealthServices 22.7%Information 4.5%Financial Activities 3.3%Professional & Business Services 13.9%Note: Based on 12-month averages through September 2012.Source: U.S. Bureau of Labor Statisticseach year of the forecast period, withthe strongest growth expected duringthe third year. Several major employers currently have expansion projectsin planning or under way. Nu SkinEnterprises, Inc., a skincare company,is building a 90 million innovationcenter in downtown Provo. Thebuilding, which is expected to becomplete in the summer of 2013,will house a research lab, retail space,and a café. As of the current date, itis unclear how many new jobs thisproject will create. Adobe SystemsIncorporated is currently constructinga 100 million campus in Lehi, whichwill employ 1,000 workers and isexpected to be complete by the endof 2012. In addition, eBay Inc. isexpected to complete constructionon a 192,000-square-foot facility inDraper in April 2013, the first ofthree construction phases that areexpected to add 2,200 jobs whencomplete by 2021.
Population and Households5s of October 1, 2012, thepopulation of the Provo-OremHMA is estimated at 554,400. Since2008, the population has increased by13,350, or 2.7 percent, annually compared with the increase of 19,750, or4.5 percent, recorded annually from2005 through 2007, primarily becauseof a decline in net in-migration afterFigure 4. Population and Household Growth in the Provo-Orem HMA,2000 to ForecastAverage Annual 02000 to 20102010 to CurrentPopulationCurrent to ForecastHouseholdsSources: 2000 and 2010—2000 Census and 2010 Census; current and forecast—estimatesby analystFigure 5. Components of Population Change in the Provo-Orem HMA,2000 to Forecast12,000Average Annual ChangeP r o v o - O r e m , U T C O M P R E H E N S I V E H O U S I N G M A R K E T A N A LY S I SA10,0008,0006,0004,0002,00002000 to 20102010 to CurrentNet Natural ChangeCurrent to ForecastNet MigrationSources: 2000 and 2010—2000 Census and 2010 Census; current and forecast—estimatesby analystFigure 6. Number of Households by Tenure in the Provo-OremSubmarket, 2000 to rent2010RenterOwnerSources: 2000 and 2010—2000 Census and 2010 Census; current—estimates by analystthe national recession. From 2005through 2007, as workers followedincreased employment opportunitiesin the HMA, net in-migration peakedat an average of 9,000 people annually, more than 3 times the average of2,850 people annually from 2000 to2005. Net in-migration has decreasedsharply since 2008, averaging 3,850people annually. During the next3 years, the population in the HMA isexpected to increase by an average of11,650, or 2.1 percent, annually as therecovering job market supports continued net in-migration into the HMA.Currently, 150,300 households residein the HMA. From 2000 to 2010,growth in the number of householdsaveraged 4,125, or 3.4 percent, a year.Since 2010, growth has decreased toan average of 2,650 households, or 1.8percent, a year. During the next 3 years,household growth is expected to increase slightly, to an average rate of3,025 households, or 2.0 percent,annually. Figures 4 and 5 illustratetrends in population and householdgrowth and the components of population change, respectively, from 2000through the forecast period. Figures 6and 7 depict the number of householdsby tenure in each submarket.Population growth trends differ significantly between the two submarketsbecause of differences in housingdevelopment patterns and householdcharacteristics. The Provo-Orem submarket, which includes the centralcities of Provo and Orem, is home toapproximately 203,700 people, or 37percent of the HMA population, downfrom 50 percent in 2000. Populationwithin the submarket increased by anaverage of 2,450, or 1.2 percent, annually from 2000 through 2006 beforedecreasing by an average of 1,275,or 0.6 percent, annually from 2007
6Population and Households ContinuedFigure 7. Number of Households by Tenure in the RemainderSubmarket, 2000 to Current80,00070,00060,00050,00040,000P r o v o - O r e m , U T C O M P R E H E N S I V E H O U S I N G M A R K E T A N A LY S I ces: 2000 and 2010—2000 Census and 2010 Census; current—estimates by analystthrough 2010. Since 2010, populationgrowth resumed at an average of 1,075people, or 0.5 percent, annually. Netout-migration from the Provo-Oremsubmarket averaged 4,775 peopleannually from 2005 through 2007,because many residents followed thegreater job creation in the Remaindersubmarket. Net out-migration decreased to an average of 3,375 peopleannually during 2009 and 2010 as jobgrowth in the Remainder submarketslowed. The number of households inthe Provo-Orem submarket increasedby an average of 470, or 0.9 percent,annually from 2000 to 2010. Since2010, household growth has declinedto 320, or 0.6 percent, annually. During the forecast period, the rate ofpopulation and household growth inthe submarket is expected to remainslow, averaging 1,275, or 0.6 percent,annually, and 380, or 0.7 percent,respectively.The Remainder submarket has acurrent estimated population of350,700, accounting for 63 percent ofthe HMA population. The population of the submarket increased byan average of 9,500, or 4.6 percent,annually from 2000 through 2005 andby an average of 18,600, or 6.9 percent,annually from 2006 through 2010.Since 2010, population growth hasslowed to an average of 9,950, or 3.0percent, annually. Net in-migration tothe Remainder submarket averaged13,800 people annually from 2005through 2007 before decreasingto average 5,650 people annuallyduring 2009 and 2010. The numberof households in the submarketincreased by an average of 3,650, or5.7 percent, annually from 2000 to2010. Since 2010, household growthhas declined to 2,325, or 2.6 percent,annually. The Remainder submarkethas experienced substantial residential building activity and in-migrationsince 2000, increasing its share of theHMA population. The submarket isexpected to benefit from continuedemployment growth and high levels ofsingle-family home construction during the next 3 years. The Remaindersubmarket’s population growth willoutpace the slower population growthin the Provo-Orem submarket duringthe forecast period, with populationand household growth expected toaverage 10,350 people, or 2.9 percent,and 2,625 households, or 2.8 percent,annually.
Housing Market Trends7Sales Market—Provo-Orem SubmarketP r o v o - O r e m , U T C O M P R E H E N S I V E H O U S I N G M A R K E T A N A LY S I SThe sales housing market in theProvo-Orem submarket is currentlysoft, with an estimated vacancy rateof 2.1 percent, equal the rate in April2010 (Table DP-2 at the end of thisreport). According to data from HanleyWood, LLC, sales of existing homesaveraged 5,050 annually from 2005through 2007 before declining sharplyto an average of 3,125 existing homessold annually from 2008 through 2010.During the 12 months ending June2012 (the latest data available), existinghome sales decreased by 180, or nearly6 percent, to 3,100 sales compared withthe number of sales recorded a yearago, but the number was equal to theannual average from 2008 through2010. During the same period, existinghome sales prices decreased more than1 percent, to an average of 196,300, adecline of more than 1 percent compared with the average of 199,100 ayear ago and of nearly 11 percentcompared with the average of 219,500from 2008 through 2010. Approximately one-third of the nearly 9,500existing homes sold during the past 12months in the Provo-Orem HMA werein the Provo-Orem submarket. Duringthe 12 months ending June 2012, newhome sales in the submarket totaled170, comprising 12 percent of total newFigure 8. Single-Family Building Permits Issued in the Provo-OremSubmarket, 2000 to 2012450400350300250200150100501211Notes: Includes townhomes. Includes data through September 2012.Sources: U.S. Census Bureau, Building Permits Survey; estimates by 020000home sales in the HMA. New homesales increased 27 percent from the 130sold during the previous 12 months butdecreased nearly 15 percent from theannual average of 190 sales from 2008through 2010. Sales prices for newhomes during the 12 months endingJune 2012 averaged 244,500, anincrease of 20,200, or 9 percent, froma year earlier and equal to the averageprice from 2008 through 2010. Theweak sales market is exacerbated bycontinued foreclosure activity. According to data from Hanley Wood, LLC,during the 12 months ending June2012, REO (Real Estate Owned) andforeclosure sales comprised 35 percentof existing home sales in the submarket, down from 36 percent a year earlierbut a significant increase from 5 percentin the second quarter of 2006, beforethe national recession.Less than 10 percent of new home(single-family and townhome) construction in the HMA during the past decadeoccurred in the Provo-Orem submarket,limiting the availability of new homesto purchase. Because of natural barriers,including Utah Lake and the UintaWasatch-Cache National Forest, andadjacent urban areas that are alreadybuilt out, developable land within thesubmarket is scarce. The lack of available land in the submarket causes mostdevelopment to occur in the northern part of the submarket, along theInterstate 15 corridor, which is alsonear Utah Transit Authority Frontrunner mass transit stops and other services. Despite the soft home sales market,builders recently increased constructionactivity for single-family homes. Duringthe 12 months ending September 2012,single-family permitting increased 23percent from a year earlier, to 200homes permitted (Figure 8). Singlefamily permitting, which includes
8Housing Market TrendsSales Market—Provo-Orem Submarket Continuedsingle-family homes and townhomes,averaged 360 homes per year from2000 through 2006 before declining toaverage 160 homes annually from 2007through 2011.P r o v o - O r e m , U T C O M P R E H E N S I V E H O U S I N G M A R K E T A N A LY S I SDuring the next 3 years, demand isexpected for an additional 790 newhomes in the submarket (Table 1).A portion of the estimated 1,175other vacant units that may reenterthe market will satisfy a portion ofthe expected demand. Demand is ex pected to concentrate in the 200,000to- 250,000 price range (Table 4).Table 4. Estimated Demand for New Market-Rate Sales Housing in theProvo-Orem Submarket, October 1, 2012, to October 1, 2015Price Range ( 98,999249,999299,999399,999499,999and higherUnits ofDemandPercentof Total14031020085401517.238.725.810.85.42.2Note: The 10 homes currently under construction and a portion of the estimated 1,176other vacant units in the submarket will likely satisfy some of the forecast demand.Source: Estimates by analystRental Market—Provo-Orem SubmarketRental housing market conditions inthe Provo-Orem submarket are tight,with an overall estimated vacancy rateof 3.3 percent, down slightly from3.6 percent in April 2010 (Figure 9).According to data from Reis, Inc.,the apartment vacancy rate increasedslightly from 4.0 percent in the secondquarter of 2011 to 4.3 percent in thesecond quarter of 2012. During thesame period, the average apartmentrent increased more than 1 percent,Figure 9. Rental Vacancy Rates in the Provo-Orem Submarket,2000 to ces: 2000 and 2010—2000 Census and 2010 Census; current—estimates by analystto 780. The average asking rentin the second quarter of 2012 was 690 for one-bedroom units, 810for two-bedroom units, and 910 forthree-bedroom units.The presence of BYU has a significantimpact on the rental market in thesubmarket, because nearly one-thirdof renter households are studenthouseholds. During the fall 2011semester, BYU enrolled 34,100students, down slightly from 35,000in 2006. The university has dormitorybeds for 6,900 students. UVU does notoffer on-campus housing for studentsbut promotes the private developmentof student apartments off campus.UVU, which is primarily a commutercollege, enrolled 32,650 students in thefall of 2010. According to universityrecords, approximately 40 percent ofthose students participate in online,
9Housing Market TrendsRental Market—Provo-Orem Submarket Continuedmultifamily units permitted averaged330 annually, with more than 90percent constructed as apartments(Figure 10). Most of the condominiums constructed from 2000 to 2007were intended for investors, who inturn rent primarily to the studentmarket. Based on preliminary data,during the 12 months ending September 2012, 70 multifamily units werepermitted (approximately 70 percentof which were condominiums), down80 percent from the 340 multifamilyunits permitted (nearly all of whichwere apartments) during the previous12-month period. Recent apartmentcompletions consist primarily of student housing, including the 236-unitJoaquin Village and the 68-unitThe Isles student housing projects.Siena Villas Apartments, an 81-unitproject in Orem, recently completedconstruction, with rents of 825 forone-bedroom units and 1,000 fortwo-bedroom units.After 3 years of reduced multifamilyconstruction activity, as measured bythe number of units permitted, builderinterest returned in 2010 becauseof the tightening rental market.Multifamily permitting averaged 450units annually from 2000 through2006, when permitting was nearlyevenly split between apartment andcondominium construction. From2007 through 2010, multifamilyconstruction slowed to an average of150 units annually, with condominiums accounting for approximately75 percent of units permitted duringthe period. Since 2010, the number ofFigure 10. Multifamily Building Permits Issued in the Provo-OremSubmarket, 2000 to 2012700600500During the forecast period, demand isanticipated for 610 new market-raterental units in the submarket (Table 1).Table 5 provides an estimate of demandfor new market-rate rental housing byrent level and number of bedrooms forthe period from October 1, 2012, toOctober 1, 40320202002012000020P r o v o - O r e m , U T C O M P R E H E N S I V E H O U S I N G M A R K E T A N A LY S I Sor distance, learning. Total enrollmentat UVU increased dramatically from23,300 in 2006, mostly because ofincreasing online learning options.Notes: Excludes townhomes. Includes data through September 2012.Sources: U.S. Census Bureau, Building Permits Survey; estimates by analystTable 5. Estimated Demand for New Market-Rate Rental Housing in the Provo-Orem Submarket, October 1,2012, to October 1, 2015Zero BedroomsOne BedroomTwo BedroomsThree or More BedroomsMonthly Gross Units ofRent ( )DemandMonthly Gross Units ofRent ( )DemandMonthly Gross Units ofRent ( )DemandMonthly Gross Units ofRent ( )Demand760 to 959960 to 1,1591,160 to 1,3591,360 to 1,5591,560 or more2010101010Total60825 to 1,0241,025 to 1,2241,225 to 1,4241,425 to 1,6241,625 to 1,8241,825 or moreTotal705555454515280Note: Numbers may not add to totals because of rounding.Source: Estimates by analyst1,000 to 1,1991,200 to 1,3991,400 to 1,5991,600 to 1,7991,800 to 1,9992,000 or moreTotal6050503535102401,250 to 1,4491,450 or more1010Total20
10Housing Market Trends ContinuedSales Market—Remainder SubmarketP r o v o - O r e m , U T C O M P R E H E N S I V E H O U S I N G M A R K E T A N A LY S I SThe sales housing market in theRemainder submarket is soft, witha current estimated vacancy rate of1.9 percent (Table DP-3 at the end ofthis report). According to data fromHanley Wood, LLC, during the 12months ending June 2012 (the latestdata available), existing home sales inthe submarket declined by 110 sales,or nearly 2 percent, to 6,450 sales,which represented approximatelytwo-thirds of the 9,500 existing homesales in the Provo-Orem HMA. Thenumber of existing home sales in thesubmarket during the past 12 monthswas down 30 percent from the average of 9,200 homes sold a year from2005 through 2007 and nearly equalto the 6,400 homes sold during 2008.During the same period, existinghome sales prices averaged 215,700,a decline of nearly 1 percent fromthe average of 217,600 a year ago.The current existing home sales pricewas 32 percent less than the averageof 318,900 from 2005 through 2007and 21 percent less than the averageprice during 2008. Sales of newhomes in the submarket, however,totaled 1,325 during the 12 monthsending June 2012, an increase of 24percent from the 1,075 sold during theprevious 12 months but more than 70percent less than the average of 4,850Figure 11. Single-Family Building Permits Issued in the RemainderSubmarket, 2000 to 20126,0005,0004,0003,0002,0001,000Notes: Includes townhomes. Includes data through September 2012.Sources: U.S. Census Bureau, Building Permits Survey; estimates by 0012020000sales annually from 2005 through2007. Sales prices for new homesduring the 12 months ending June2012 averaged 244,800, an increaseof 7,300, or 3 percent, from a yearago, but 17 percent less than theaverage price from 2005 through 2007.Mirroring conditions in the ProvoOrem submarket, foreclosure activitycontinues to affect the Remaindersubmarket. During the 12 months ending June 2012, REO and foreclosuresales comprised 35 percent of existinghome sales in the submarket, downfrom 49 percent a year earlier but asignificant increase from 5 percent inthe second quarter of 2006, before thenational recession.Since 2000, more than 90 percent ofsingle-family and townhome construction in the HMA has concentrated in the submarket. New homeconstruction in the submarket isprimarily concentrated in Lehi,particularly in the Traverse Mountainarea and the subdivisions of IvoryRidge and Thanksgiving Meadows.Ivory Ridge, a 285-unit developmentthat is nearly complete, primarilyconsists of townhomes, although theproject includes some single-familyhomes. Single-family construction,as measured by the number of homespermitted, slowed significantly to2,050 homes permitted annually from2007 through 2009, after averaging4,650 homes permitted annuallyduring 2005 and 2006. Single-familyconstruction has since rebounded,increasing during the 12 months ending September 2012 to 1,775 homespermitted, up from 1,175 homesduring the previous 12-month periodbut still much fewer than duringprerecession periods (Figure 11).
11Housing Market TrendsSales Market—Remainder Submarket ContinuedP r o v o - O r e m , U T C O M P R E H E N S I V E H O U S I N G M A R K E T A N A LY S I SDuring the next 3 years, demand isforecast for 7,150 new homes in thesubmarket. The 30 homes currentlyunder construction will meet a portionof that demand (Table 1). In addition,a portion of the estimated 2,450 othervacant units in the submarket thatmay reenter the home sales marketduring the forecast period will satisfysome of the demand. Prices for newhomes start at approximately 140,000.Table 6 presents detailed informationon the estimated demand for new saleshousing by price range in the submarketduring the forecast period.Table 6. Estimated Demand for New Market-Rate Sales Housing in theRemainder Submarket, October 1, 2012, to October 1, 2015Price Range ( )FromToUnits ofDemandPercentof ,999249,999299,999399,999499,999and .7Note: The 30 homes currently under construction and a portion of the estimated 2,450other vacant units in the submarket will likely satisfy some of the forecast demand.Source: Estimates by analystRental Market—Remainder SubmarketRental housing market conditions inthe Remainder submarket are tight,with an estimated overall vacancy rateof 4.1 percent, down from 5.1 percentin April 2010 (Figure 12). The low levelof apartment construction during thepast decade in the submarket contributed to the ongoing balanced-to-tightconditions. The apartment vacancyrate in September 2012 was estimatedat 2.2 percent, down slightly from 2.5percent a year earlier. During the sameFigure 12. R ental Vacancy Rates in the Remainder Submarket,2000 to ntSources: 2000 and 2010—2000 Census and 2010 Census; current—estimates by analystperiod, the average apartment rentincreased nearly 2 percent, to 935.Th
Utah County outside the Provo-Orem CCD. The HMA is the third largest metropolitan area in the state, with a current estimated population of 554,400. Table DP-1 at the end of this report provides demographic data for the HMA from 2000 to the current date. Economy .