Transcription
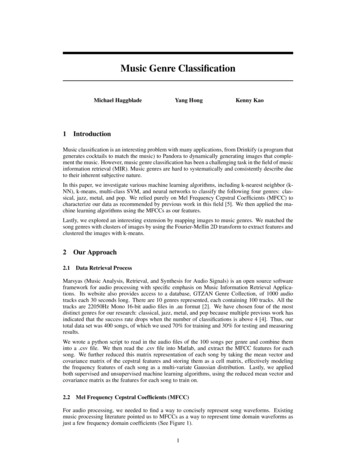
RELATED MUSIC, ENTERTAINMENTAND INFORMATION INDUSTRIESMusic pressRadio, TV, film and advertisingTheatre and dance sectorCORE ACTIVITIESRELATED ACTIVITIESArt and creative studiosManufacturing of audio hardwareManufacture and distribution ofmusical instrumentsPR companiesJingle producersPhotographersLive performanceProduction and sale ofsound recordingsAdministration of copyright incomposition and recordingsTELECOMMUNICATION AND ITMusic on demandMusic gamesInternet music salesMultimedia musicVirtual music networksmusic
067.09 MUSICSECTIONThsi anayssl i covers thecore musci businessactivities of liveperformances, theproductoni and saleof sound recordingsand printed musc,i andthe administratoni ofcopyrghtiin compositionsand recordngs.i
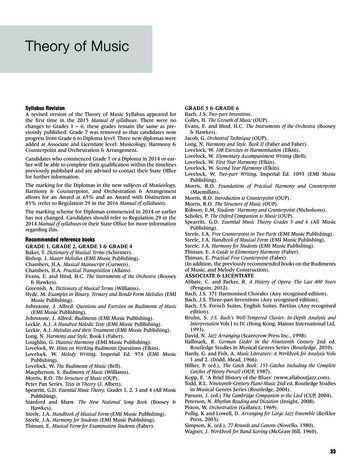
068.09 MUSICSECTIONINDUSTRY REVENUESValue of Sales ( m)1800Retail Sales160014001200Trade 921993199419951996Note1 Trade deliveries are sales by recordcompanies to retailers which excludeVAT and retailers’ marginsEstimated Value Added 1995Live Performance: Rock and Pop 300.0mLive Performance: Classical, etc. 146.0mOther Artists’ Earnings(including record royalties – UK and overseas, etc)Opera and Musical Theatre 525.0m 120.0mRecording:Record Companies 317.0mStudios 17.4mProducers 14.0mManufacturers 67.0mMusic Publishing 85.5mCollection Societies 23.3mRetailing and Distribution 334.1mManagers, Agents and Promoters 132.0mTotal 2,081.3mNoteTotal Value Added excludes spending onMusical Instruments (Production, Distributionand Retailing) and Education and TrainingEstimated Consumer Expenditure 1995Consumer Expenditure2 2.4bnPrivate Corporate Expenditure (including sponsorship) 168.0mPublic Sector Expenditure (including the BBC)3 198.0mTotal 2.6bnTotal revenues of the music industry in 1995 were 3.6bn.1The UK industry has been experiencing strong growth in sales over the past decade. Sales of recorded music have been growingat a 10% annual compound growth rate. This growth is attributable to: the strength of domestic releases; the extension of musicdemand across three generations; increased buying power among older income groups; and favourable economic conditions inthe UK. The CD format, which was introduced in 1983, has also had a big impact on sales growth. CDs have rapidly replaced vinyland cassettes and now account for 86% of recording sales.1 Equals consumer spend plus public expenditure and sponsorship plus exports – does not take imports into account. Source The Value Of Music and OverseasEarnings of the Music Industry.Note 2 Includes admissions to liveperformances and purchasesof sound recordings (new andsecondhand) and printed music.Note 3 The BBC is estimated to havespent 87m on music.Total Expenditure excludesconsumer spending on MusicalInstruments and Education andGovernment Spending on MilitaryBands and Music Educationand TrainingSource: BPI Statistical Handbook 1997,The Value of Music
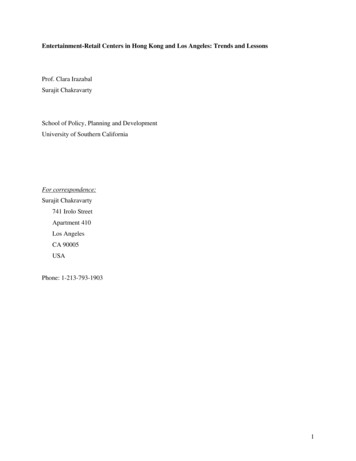
069.09 MUSICSECTIONUK MARKET SIZEConsumer expenditure on music in the UK in 1995, covering live, recorded and printed music, was estimated at 2.6bn.2World Leading Markets 1997Retail SalesShare of(US m)World y2,836.87.4%4.United rlands600.11.6%10. Spain600.11.6%11. Italy600.11.6%12. Taiwan472.81.4%13. Mexico457.01.2%14. Argentina381.01.0%15. Sweden381.01.0%Retail sales of recordings amounted to 1.8bn in 1997, accounting for 7.2% of the world market. The UK is the fourth largestmarket for recorded music but is far more important as a repertoire provider.The most popular genres were Pop, Rock, Dance and MOR/Easy Listening, which together accounted for 80% of album sales.Classical music’s share of the album market was steady at 7% in 1997, comparable to most other European countries. UK artistsaccounted for 58% of album sales, up from 53% the previous year, their highest share of the domestic market since 1986.People in the UK spend four hours per week listening to recorded music, making it the third most popular home-based leisureactivity after television and radio.3 Music-based radio continues to be a major media force.2 Expenditure on admissions to live performance, purchases of sound recordings (new and secondhand) and printed music. Source The Value Of Musicand Overseas Earnings of the Music Industry3 Source Henley Centre 1994
070.09 MUSICSECTIONRecorded Music as a Percentage of Leisure Spending4.8%4.9%4.9%4.4%4.3%Recorded music as a percentage of ‘In Home’ leisure ed music as a percentage of total leisure spending1996Spending on Records, Tapes and CDs as a Percentage of Total Consumer 988198919901991199219931994199519961997Recorded music accounts for just under 5% of in-home leisure spending and 1.3% of total leisure spending.Music maintains a steady 0.37% share of overall consumer spending despite increasing competition in the field of leisure.BALANCE OF TRADEValue of Imports / Exports of Finished Goods (Records, Cassettes, CDs) ts1341101017527828426072Exports8172Balance of Trade3715198819891990199119921993199419951996
071.09 MUSICSECTIONOverseas Earnings and Payments 1993Estimated gross earningsfrom overseas mEstimated grosspayments mNet Earnings mRecording628.1304.3 323.8Music Publishing259.6113.6 146.0Performance Income100.946.4 54.5Musical Instruments86.0112.6-26.6Musical Theatre and Misc.83.310.0 73.31,157.9586.9 571.0Total Invisibles799.1308.8 490.3Total Visibles358.8278.1 80.7Grand Totalof which:The UK music industry is one of the most important sources of creative talent in the world. It is estimated that UK artists shareof the world music market amounted to 16% in 1996.Total exports in 1993 (the last year for which reliable data are available) were 1,072m, more than double the valueof imports ( 472m).4Invisibles comprised almost 75% ( 800m) of exports and 82% ( 490m) of net earnings. Of these invisible revenues, royaltiesaccounted for 46% ( 367m) of exports and 45% ( 222m) of net earnings. Around 75% of net earnings on artistic royaltiescame from North America and the EU.The export of finished goods (records, cassettes and CDs) is also an important earner, and some of the UK companies involvedhave won the Queen's Award for Export Achievement, including Windsong International and Lightning Export.Peak Positions of UK Entries in Top 10 Album Charts in Leading Markets (1996 -1997 end June)USJapanGermanyFranceBeatlesAnthology 31499BeatlesAnthology 21442Bee GeesStill Waters––25BlurBlur–8––David BowieEarthling–––9Eric ClaptonChange The World–7––Joe CockerOrganic510Phil CollinsDance Into The Light––51CureWild Mood Swings–––3Depeche ModeUltra512East 17Around The World––10–JamiroquaiTravelling Without Moving–3–2Mark KnopflerGolden Heart––52Paul McCartneyFlaming Pie2–6–George MichaelOlder6432OasisWhat’s The Story, Morning Glory?51038Pet Shop BoysBilingual––7–Simply RedGreatest Hits––2–Spice GirlsSpice1761StingMercury Falling5723SupertrampSome Things Never Change––3–Take ThatGreatest Hits–713TexasWhite On Blonde–––2Roger WhittakerAlles Roger––6–Worlds ApartEverbody–––14 Excludes musical instruments. Source Overseas Earnings of the Music Industry
072.09 MUSICSECTIONThe relative importance of UK music in the rest of the world is reflected in the high number of UK artists in the charts in majormusic markets around the world.Parallel imports of cheaper CDs are now estimated at 15-20% of sales for some releases.It is estimated that by 1997 total exports (visible and invisible) had risen to 1.5bn. The balance of trade surplus is comparableto that of the steel industry. Few other UK industries produce greater contributions to the UK balance of payments.Piracy is a problem affecting export sales. The pirate market is worth billions of pounds worldwide. The IFPI estimate that onein three music formats sold around the world is illicit. Digital technology and the Internet may exacerbate the problem asit will enable easy access and reproduction of perfect copies.EMPLOYMENTEmployment in the Music Industry 1995Musicians and ComposersOtherTotal EstimatedEmploymentLive Performance: Rock and Pop31,000111,00042,000Live Performance: Classical, etc.4,8921,4916,383Opera and Musical Theatre1,9531,9353,888Composers not included rd 750750Manufacturers–3,0003,000Music Publishing–1,1951,195Collection Societies–971971Retailing and Distribution–18,89818,898Managers, Agents and ated full-time employment in 1995 was 90,601.5 Almost 50% (43,000) were musicians or composers, and of these31,000 were aspiring pop and rock performers. The next largest groups are retailing (19,000) and recording (15,000).Part-time employment in the industry is high, especially among musicians. Only 28,000 of the 43,000 musicians werein full-time employment. Total employment in the industry is estimated at in excess of 160,000.5 Excludes employment in education and training and the production, distribution and retailing of musical instruments.Source The Value of Music and BPI Statistical Handbook 1997Note 1 4,000 FTE performers have beenallocated to the recording industrySource: BPI Statistical Handbook 1997,National Music Council
073.09 MUSICSECTIONINDUSTRY STRUCTUREValue Chain Analysis of the Recording stributorsWrite songs,Exploit and protectCollect royaltiesPerform musicCreate and exploitWork with artistRecord music/ManufactureDistributecompose musiccomposers’ worksand payments for(pop artists usuallycopyright in soundwhile record iscreate mastersoundcarrierssoundcarriersAssign copyright toCollect royaltycomposers/write own materialrecordings bybeing madefrom masterto retailersmusic publishersfor songwriters/songwriters and foras well)signing artists andcomposers forrecord y record soldmaufacturing anddistribution activitiesMarket and promotenew releaseOwn copyright ofrecordings but canlicence or assignthem to othersThePlayersPRSOver 500 artists5 majors (73.2%1,000 active record360 independentOver 250 companies,Specialist chains (5),MCPSand groupsshare of albumsproducers, of whomstudios, but manybut the five majorsgeneral multiples (9),500 are full-timeare part of otherdistribute over 80%independentbusinessesof musicspecialists and ‘non (totalling app. 2,000sold in 1996) andindividuals) are600 indies.signed to majorsMajors are:and another 2,000150 companiestraditional’ outlets– Polygram (20.4%)Specialist chains:are signed to indies49.3% (HMV,– Sony (12.4%)Virgin, Our Price,– EMI and VirginMVC, Now)(12.5%)General Multiples:– Warner Music36.5% (WH Smith,(9.6%)Woolworths,Menzies, Boots,– BMG (8.3%)Asda, Sainsbury,(% of UK Market)Tesco, Safeway,Dixons and others)Independents: 14.2%Value Added 125.0m 85.5m 23.3m 111.6m 217.0m 14.0m 17.4m 67.0m 64.0m 507933,0002,20016,698Note 1 FTE Full-Time EquivalentThe market for recorded music in the UK is dominated by a small number of record companies and retailing chains.The major recording companies – BMG, EMI, Polygram, Sony and Warner (the five ‘majors’ ) supplied 71% of the albums soldin the UK in 1991. The remaining 29% was supplied by 800 independent record companies (“indies”), many of which releaseonly one or two records a year. The indies play an important role in the industry, discovering new sources of talent andestablishing new fashions. However, as a result they bear a disproportionate share of the risk of developing new repertoire.There is a current trend for establishing joint ventures between the majors and successful indies, preserving the “indie ethos”while providing more secure financial backing.Access to new and cheaper technology has significantly increased the number of so-called “bedroom acts” – musicians whowrite, perform, record and mix their own material in their home.The recording industry is high risk, requiring substantial upfront investment in new artists and repertoire (A&R). Record companiesinvest approximately 12-13% of revenues in A&R, one of the highest ratios of R&D expenditure of any industry. The industryrelies on a handful of “blockbuster” hits to cover the losses from the majority of recordings that do not sell enough copies tocover the initial investment. The total cost of making a record can be 1m or more for a pop album by a major recording artist.In addition to developing A&R, the other most important activities of record companies are marketing and promoting new releasesand distribution to retailers.Among the retailers, 10 specialist chains and multiples dominate the UK market, with over 85% of sales. Over 1,000 independentretailers account for the remaining 15%. The number of independent retailers has been declining, while non-specialist outletssuch as supermarkets and petrol stations have been taking an increasingly large share of sales. Supermarkets now account foralmost 10% of UK retail album sales.Source Value of Music, BPI StatisticalHandbook 1997, MMC Report,Spectrum Analysis
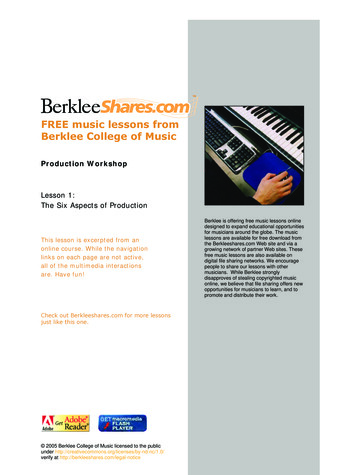
074.09 MUSICSECTIONINTERNATIONAL CRITICAL ACCLAIMThe Spice Girls are currently the most successful group in the world, with number one records in dozens of countries.They have sold over 9 million albums in the USA.Many other British artists have made a significant impact in overseas markets recently. Texas, The Verve, All Saints, Bush,Prodigy and Chemical Brothers have all enjoyed substantial success in important markets. The popularity of established actssuch as The Rolling Stones, Eric Clapton, Sting, Rod Stewart and Pink Floyd remai
Beatles Anthology 3 1 4 9 9 Beatles Anthology 2 1 4 4 2 Bee Gees – – 2 5 Blur Blur – 8 – – David Bowie – – – 9 Eric Clapton – 7 – – Joe Cocker _ _ 5 10 Phil Collins Dance Into The Light – – 5 1 – – – 3 Depeche Mode Ultra 5 _ 1 2 East 17 – – 10 – – 3 – 2