Transcription
A Close Look at Medi-Cal Managed Care:Statewide Quality Trends from the Last DecadeSEPTEMBER 2019AUTHORSAndrew B. Bindman, Denis Hulett, Isabel Ostrer, andTaewoon Kang
ContentsAbout the AuthorsThis report was produced by investigatorsassociated with the Philip R. Lee Institutefor Health Policy Studies at the Universityof California, San Francisco. Andrew B.Bindman, MD, is a professor of medicine andepidemiology and biostatistics; Denis Hulett,MS, is a statistician; Isabel Ostrer is a thirdyear medical student, and Taewoon Kang,PhD, is a research specialist.3 Executive SummaryBackgroundData SourcesKey FindingsOpportunities for Improvement5 IntroductionBackgroundThe Growth of Medi-Cal Managed CareAbout the FoundationMedi-Cal Managed Care Plan Quality AssessmentThe California Health Care Foundation isdedicated to advancing meaningful, measurable improvements in the way the health caredelivery system provides care to the people ofCalifornia, particularly those with low incomesand those whose needs are not well servedby the status quo. We work to ensure thatpeople have access to the care they need,when they need it, at a price they can afford.Auto-Assignment IncentiveCHCF informs policymakers and industryleaders, invests in ideas and innovations,and connects with changemakers to createa more responsive, patient-centered healthcare system.For more information, visit www.chcf.org.Improvement Plans10 FindingsMedi-Cal Managed Care Quality TrendsMinimum Performance LevelsManaged Care Plan Ownership and QualityCounty Model and QualityAuto-AssignmentSummary of Findings20 Opportunities for ImprovementStrengthen Data Collection and ReportingEstablish Positive Financial Incentives for ImprovementIdentify and Support Other Contributors toHigh-Quality CarePrioritize Continuous Quality Improvement22 MethodologyData and MethodsLimitations23 Endnotes24 AppendicesCalifornia Health Care Foundationwww.chcf.org2
Executive SummaryBackgroundData SourcesIn the 1970s, California was the first state to introduceMedicaid managed care.1 It is now mandatory in 57of 58 counties for most Medi-Cal enrollees. In 2018,approximately 10.4 million (80%) of Medi-Cal enrollees received services through one of 22 insurers whoprovided managed care plans (MCPs) specific to thecounties in which they operated.This report draws primarily from two sources of publicinformation provided by DHCS on the quality of careprovided to its members: the Healthcare EffectivenessData and Information Set (HEDIS), a set of standardized quality measures established by the NationalCommittee for Quality Assurance, and the ConsumerAssessment of Healthcare Providers and Systems(CAHPS), a survey designed to capture patients’ satisfaction with their health care. This report examines 41quality measure: 35 from HEDIS and 6 from CAHPS.This report examines the performance of Medi-CalMCPs over the past decade in quality of care providedto members. In addition to reporting on overall trendsin performance, this report also examines differencesby type of MCP ownership (public, nonprofit, forprofit) and model of managed care (County OrganizedHealth System, Two-Plan model, and a few differentmodels of competing commercial MCPs). These aredescribed below in greater detail.This analysis comes at an important time. First,California’s newly elected governor has expressedinterest in the quality of care for Medi-Cal enrollees,particularly after the state’s auditor found that millions of children enrolled in Medi-Cal aren’t receivingthe basic preventive health checkups required bythe program. Second, the California Department ofHealth Care Services (DHCS), which runs the MediCal program and oversees quality of care for Medi-Calenrollees, is preparing to launch a competitive reprocurement process to determine which for-profit andnonprofit commercial MCPs the state will contractwith in the future to deliver Medi-Cal managed careservices. Third, the federal government recentlyupdated regulations requiring states to improve howMedicaid programs hold MCPs accountable for theirperformance.Key Findings From2009 to 2018, quality of care in MediCal managed care was stagnant at best onmost measures. Among 41 quality measures collected in two or more years, more than half (59%)remained unchanged or declined. The picturelooks only slightly better when limited to the 31quality measures still collected by DHCS. Of those,52% remained unchanged or declined. Specifically,quality of care significantly declined for Medi-Calenrollees on 4 measures and was unchanged on 12measures. There was significant quality improvement on 15 measures. Whiledeclines in quality in some cases were relatively small on a percentage basis, the clinicalsignificance in all cases could be interpreted assubstantial, given the size of the impacted population. The same is true for observed improvementsin quality. Threeof the four current measures that declinedover time were related to the care of children.Six of the nine quality measures currently in usethat are related to children declined or stayed thesame; there was improvement in only three of thesemeasures.A Close Look at Medi-Cal Managed Care: Statewide Quality Trends from the Last Decadewww.chcf.org3
Medi-Calenrollees’ rating of their experienceswith their MCP were consistently below the50th percentile nationally. The only CAHPS measure that improved significantly over time was theone that asked enrollees to rate how well doctorscommunicate. Establish Medi-Cal SupportMCPs’ quality scores varied markedlywithin and across MCPs by ownership duringthe past decade. Most striking was the substantially lower quality scores of the for-profit MCPs, onaverage, relative to the nonprofit and public MCPs.These differences in quality scores by MCP ownership were not explained by observed demographicdifferences or the physician supply in the countiesin which they were operating.meaningful financial incentives thatare relevant for all its MCPs. One possibility isthe use of direct financial rewards for achievingimprovement targets and direct financial penaltiesfor consistently scoring below specified targets onquality metrics.the capacity of MCPs to make improvements through a collaborative learning processguided by robust comparative data and analysis. Incorporateeach MCP’s performance andimprovement over time into contracting decisions, and establish a process for replacing MCPsthat don’t meet expectations. Reconsider Whilethere was variation of MCP performancewithin each of the Medi-Cal managed caremodels, counties that rely on a single publicMCP (County Organized Health Systems) hadon average better quality scores than countiesthat furnish Medi-Cal services through either aTwo-Plan or competing commercial model. Thisremained the case after adjusting county demographics and physician supply, and was even truefor the quality measures used as the basis for theenrollment-based “auto-assignment” incentive incounties with competing MCPs.Opportunities for ImprovementThe collection and reporting of data by DHCS hasbeen helpful for monitoring access and quality buthas been insufficient for ensuring accountability anddriving consistent improvements over time. With thisin mind, California lawmakers and DHCS should consider the following actions: Establishspecific, measurable, and time-boundquality-improvement targets for each MCP andfor the Medi-Cal managed care program as awhole.California Health Care Foundationthe role of for-profit MCPs in furnishing Medi-Cal services, given that their qualityfor the most part lags behind public and/or nonprofit MCPs. Reconsiderthe role of MCP competition, withinput from counties and Medi-Cal enrollees.Although offering enrollees a choice of MCPs maybe seen as a way to promote value, it is worth considering whether the administrative complexity isjustified, given these models for delivering MediCal services achieve lower quality on average thanreliance upon a single MCP. Competition amongMCPs can also undermine collaboration amongMCPs for shared learning.State officials must take bold steps to further investin building California’s health care delivery systemto help ensure that all Medi-Cal enrollees, regardless of where they live, receive timely access tohigh-quality care. MCPs can be an important partof the solution, but they require additional guidanceand support. DHCS could contribute to building MCPcapacity to improve quality by working with MCPsto better understand the underlying factors thatcontribute to high-quality care and by creating a programmatic structure that fosters cooperation ratherthan competition among its contracted MCPs.www.chcf.org4
IntroductionBackgroundCalifornia’s Medicaid program (Medi-Cal) relies onmanaged care plans (MCPs) to furnish services to themajority of eligible enrollees. The Medi-Cal managedcare program has evolved and grown tremendouslysince it was introduced: Both the number of MCPs furnishing services and the number of Medi-Cal enrolleesmandatorily enrolled in these MCPs has grown overtime.Medi-Cal managed care was originally targeted towardlow-income children and their parents in a small number of counties. The presumed benefit of using MCPsto manage care for Medi-Cal enrollees is to increasethe value of the public’s investment in caring for theeligible population. The administrative investmentin MCPs has the potential to improve access to andquality of care while reducing health care costs byinvesting in prevention and reducing the amountspent on unnecessary care. Medi-Cal managed care isnow mandatory throughout the state for most MediCal enrollees. Among those exempted are enrolleeswho have a restricted scope of benefits and enrolleeswho have Medicare or another insurer as their primarysource of coverage.2 Nationwide, one in five Medicaidenrollees in managed care reside in California.3California uses MCPs to manage Medi-Cal services inone of three main types of county-level managed caremodels: (1) a single public MCP (County OrganizedHealth System), (2) a public MCP (local initiative) incompetition with a single commercial MCP (Two-Planmodel), or (3) multiple competing commercial MCPs(Geographic, Regional, and Imperial models). TheRegional model relies on the same two commercialMCPs to serve 18 rural counties. Among California’s58 counties, San Benito, a small rural county, is theone exception that furnishes Medi-Cal managed careservices on a voluntary basis through a single commercial MCP.4 Most commercial MCPs participatingin Medi-Cal managed care are for-profit, but a smallnumber are nonprofit.Unlike the commercial market for health care services,Medi-Cal MCPs do not compete for members on price.But in geographic regions in which there are multipleMCPs, they do compete on network composition,quality of care, and customer service. All MCPs arepaid capitation (per member per month) at rates setby the California Department of Health Care Services(DHCS). Historically, safety-net clinics have played alarger role in Medi-Cal enrollment for public MCPsthan they have for commercial Medi-Cal MCPs.5 Statepayments to MCPs are adjusted for beneficiary characteristics such as age, gender, and eligibility group,and are adjusted for risk based on use of prescriptiondrugs for certain chronic conditions. As a result, publicMCPs in a county are typically paid a higher rate thancommercial MCPs.6This review of quality trends in Medi-Cal managedcare and examination of the performance of the program’s different managed care plan types and modelscomes at an important time for several reasons. First,California’s recently elected governor has expressedinterest in Medi-Cal and the quality of care the program delivers for enrollees, particularly after the state’sauditor found that millions of children enrolled inMedi-Cal aren’t receiving the basic preventive healthcheckups required by the program. Second, DHCS,the administrator of the Medi-Cal program and theresponsible party for the quality of care deliveredthrough the program, will soon launch a competitivereprocurement process to determine which for-profitand nonprofit commercial MCPs California will useto deliver Medi-Cal managed care services. Third,the federal government recently updated regulationsrequiring states to improve how Medicaid programshold MCPs accountable for their performance.A Close Look at Medi-Cal Managed Care: Statewide Quality Trends from the Last Decadewww.chcf.org5
The variation in Medi-Cal managed care models acrossCalifornia counties and the diversity of MCP typesprovides an opportunity to build upon the analysis ofstatewide trends to examine several questions abouthow the program is structured and the elements thatcontribute to the delivery of high-quality services forMedi-Cal enrollees. For example:The Growth of Medi-CalManaged CareMedi-Cal enrollees receive higher-qualitycare in counties with a single public MCP (COHS)or in counties where a choice of MCPs is offered?Between 2009 and 2018, the number of Medi-Calenrollees in MCPs increased threefold, from 3.6 million to 10.4 million (see Table 1). This reflects growthin the population size of the Medi-Cal program, aswell as the expansion of eligibility groups required toreceive services through managed care, and the number of counties furnishing Medi-Cal services throughMCPs. Although the number of insurers participatingin Medi-Cal managed care increased only from 20 to22 during this time period, the number of countiesparticipating increased from 23 to all 58. Informationon which insurers were sponsoring Medi-Cal managedcare services in which counties over time is shown inAppendix A.The distribution of county models across geographicregions is not random, but by adjusting for measured differences in Medi-Cal population across theseregions, it is possible to strengthen the inferences thatcan be drawn from the comparisons.Currently, Medi-Cal enrollees are served by a singlepublic MCP (COHS) in 22 counties; have a choice in 14counties through a “Two-Plan” model between a forprofit MCP and a local initiative MCP that is typicallypublic; and in 21 counties, Medi-Cal enrollees have a Isthere a difference in the quality of care provided by MCPs based on their ownership? WithinTwo-Plan counties, are there consistentdifferences in the quality scores between publicand for-profit MCPs? DoTable 1. Medi-Cal Enrollment in Health Plans, 2009–18ENROLLMENT(N)INSURERS(N)COUNTIES(N)HEALTH PLANS(N)QUALITY 122585331201810,400,99722585331Notes: Enrollment in 2009 estimated from health plan enrollments in 2010. Year corresponds to reporting, not measurement, year.Source: Author analysis of the annual “Medi-Cal Managed Care External Quality Review Technical Report” released by the Managed Care Quality andMonitoring Division of the California Department of Health Care Services.California Health Care Foundationwww.chcf.org6
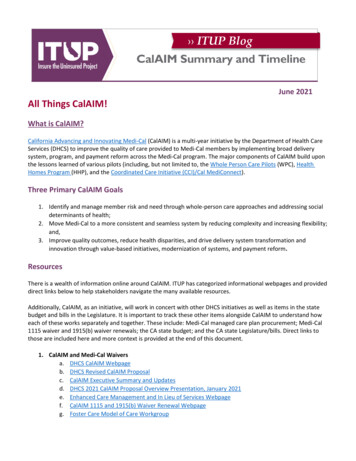
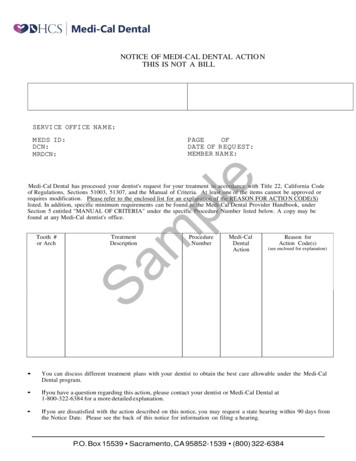
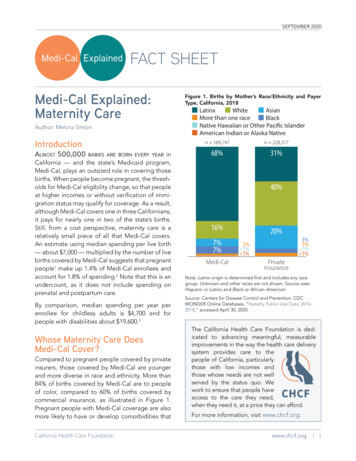
choice of two or more competing commercial MCPs(see Table 2). San Benito is the only county wheremanaged care remains voluntary, and enrollees caneither remain in fee-for-service care or choose a singlecommercial MCP.Figure 1. Medi-Cal Managed Care Models, by CountyDelNorteHumboldtThe geographic distribution of the different countymodels is reflected in the map of California (seeFigure 1). Aside from the densely populated countiesof Los Angeles, San Diego, and San Francisco, themajority of coastal counties, as well as the northernregions of the state, are served by COHS. Two-Planmodels are prevalent in the Central Valley, while competing commercial MCPs are mainly found in thesouthernmost counties and the rural counties alongCalifornia’s eastern cinoGlennPlumasButteSierraNevadaYubaPlacerSutterEl DoradoYoloSonoma NapaAlpineSacramento AmadorSolanoCalaverasMarinSanTuolumneContra JoaquinCostaSan FranciscoAlameda Stanislaus MariposaSan MateoSantaMercedClaraMaderaSanta CruzFresnoSanBenito County Organized Health System (COHS)Geographic Managed Care (GMC)Two-PlanRegionalOtherLake ColusaMontereyMonoInyoTulareKingsSan LuisObispoSanta BarbaraKernSan BernardinoVenturaLos AngelesRiversideOrangeSan DiegoImperialSource: California Department of Health Care Services, Managed CareCounty Map, June 2019. www.dhcs.ca.gov (PDF).Table 2. Health Plan and County Counts, by Plan Model Type, 2009–18SINGLE PUBLIC(COHS)COMPETING COMMERCIAL(GMC, IMPERIAL, REGIONAL)TWO-PLANHealth PlansCountiesHealth PlansCountiesHealth 26141520161122261420171122262018112226SINGLE COMMERCIAL(SAN BENITO)Health PlansCounties21111521111415211114152111Notes: Year corresponds to reporting, not measurement, year. COHS is County Organized Health System; GMC is Geographic Managed Care.Source: Author analysis of the annual “Medi-Cal Managed Care External Quality Review Technical Report” released by the Managed Care Quality andMonitoring Division of the California Department of Health Care Services.A Close Look at Medi-Cal Managed Care: Statewide Quality Trends from the Last Decadewww.chcf.org7
When Medi-Cal managed care was first piloted inCalifornia, the state contracted exclusively with public MCPs. With the expansion of Medi-Cal managedcare to more counties over time, nonprofit and forprofit MCPs were given a role as alternative choicesfor Medi-Cal enrollees. Kaiser Health Plan is one ofthe participating nonprofit MCPs, but its involvementin Medi-Cal managed care is only in a limited number of counties. Unlike other Medi-Cal MCPs, Kaiser isable to set a limit on the number of Medi-Cal enrollees it accepts and to be selective in who is allowed toenroll.7By 2009, approximately 35% of the Medi-Cal population in managed care was in for-profit MCPs, 4% was innonprofit MCPs, and 61% was in public MCPs.8 Overthe subsequent decade, the percentage of Medi-Calenrollees enrolled in for-profit MCPs decreased to27%, while the percentage in public MCPs increasedto 69%. However, with the expansion of Medi-Calmanaged care into more rural counties during this timeperiod, the number of Medi-Cal enrollees in managedcare who do not have the option to enroll in a publicMCP doubled to 1.6 million (see Table 3). More thana third of those without access to a public MCP alsodo not have the choice of a nonprofit Medi-Cal MCP.Medi-Cal Managed Care PlanQuality AssessmentCalifornia assesses and publicly releases informationon the quality of contracted MCPs. This is done annually using standardized measures of quality from theHealthcare Effectiveness Data and Information Set(HEDIS), and every three years using standardizedpatient-reported measures of health care experiences from the Consumer Assessment of HealthcareProviders and Systems (CAHPS). The annual report ispublicly released in April following the reporting year.For example, in April 2019, DHCS released the 2018report on services delivered in 2017.The unit of analysis for these assessments is the countyor, in more rural areas, groups of counties that MediCal has clustered together into a single regionalmarket. In those cases in which the same commercialTable 3. Medi-Cal Managed Care Enrollees and Choice of Public and Nonprofit Plans, 2009–18MEDI-CAL MANAGED CARE ENROLLMENTSTATEWIDENO PUBLIC CHOICENO PUBLIC OR NONPROFIT 400,9971,634,60615.7579,2045.6Notes: Year corresponds to reporting, not measurement, year. COHS is County Organized Health System; GMC is Geographic Managed Care.Source: Author analysis of the annual “Medi-Cal Managed Care External Quality Review Technical Report” released by the Managed Care Quality andMonitoring Division of the California Department of Health Care Services.California Health Care Foundationwww.chcf.org8
insurer covers enrollees in different counties, DHCShas specified a requirement for quality reporting eitherat the county or regional level.MCPs submit information on their HEDIS measureswhich is audited by a third party on behalf of the statebefore it is made public. HEDIS scores are derivedfrom either administrative data alone or a hybrid ofadministrative data and sampling of eligible medicalrecords. Over time, California has made some changesin the measures that Medi-Cal MCPs are required toreport. Scoring is in the form of a percentage.CAHPS measures patient experiences with MCPs aswell as providers. It is administered to a sample ofMCP enrollees by a third party on behalf of DHCS.DHCS publicly reports CAHPS scores for its differentmeasures on a scale between one (lowest quality) tofive (highest quality) stars. Each star corresponds to aperformance percentile based on national results forMedicaid MCPs: 1star: 25th percentile 2stars: 25th percentile to 50th percentile 3stars: 50th percentile to 75th percentile 4stars: 75th percentile to 90th percentile 5stars: 90th percentileAccording to the 2009 report (corresponding toservices delivered in 2008), there were 19 qualityreporting regions for the 23 counties participating inMedi-Cal managed care, indicating that the reportingregion was almost always a single county. By 2018(corresponding to services delivered in 2017) therewere 31 quality-reporting regions for the 58 participating counties (see Table 1 on page 6).9 This is becauserural counties began participating in Medi-Cal managed care more recently than urban counties, and inthese rural counties the same MCPs were selected toprovide services across a region of relatively less populous counties. The sampling of Medi-Cal enrollees toassess quality for these MCPs is from the multicountyregion and is not county-specific as it is in the largerurban counties.Table 4. Medi-Cal Enrollment, by Type of Insurer, 2009–18FOR ,53634417,08215237,130,379Notes: Enrollment in 2009 estimated from health plan enrollments in 2010. Year corresponds to reporting, not measurement, year. Regions represents thenumber of regions that reported on quality of Medi-Cal.Source: Author analysis of the annual “Medi-Cal Managed Care External Quality Review Technical Report” released by the Managed Care Quality andMonitoring Division of the California Department of Health Care Services.A Close Look at Medi-Cal Managed Care: Statewide Quality Trends from the Last Decadewww.chcf.org9
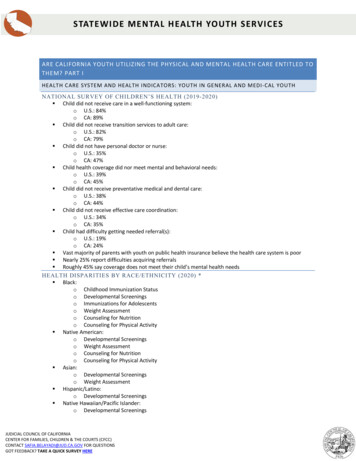
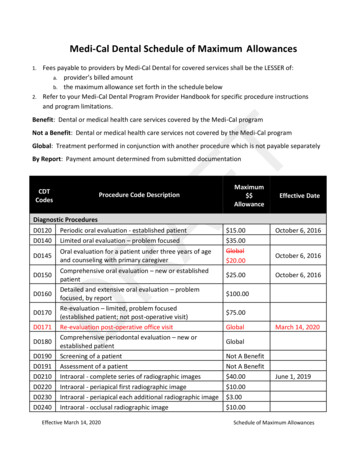
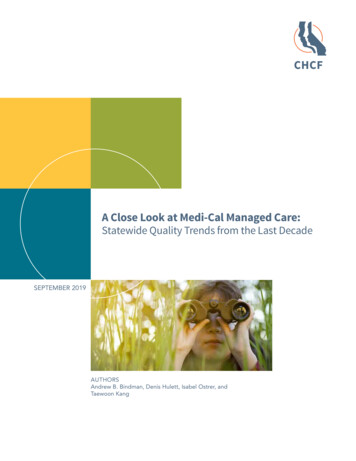
A quality-reporting region will include results fromone or more MCPs depending on the model of MediCal managed care in that region. Given the growth ofmanaged care and the varying ways it was expandedacross California, the number of MCP-specific assessments increased from 38 in 2009 to 53 in 2018. Theincrease reflects primarily a growth in regions ratherthan an increase in the number of participating insurers. For example, while the number of for-profitinsurers increased only from three to four between2009 and 2018, because the number of counties inwhich they are operating increased, the numberof county-based regions for which there are quality assessments increased from 19 to 26 in this timeperiod (see Table 4, page 9). This primarily occurredwith expansion into rural counties along California’seastern border through the Regional model, whichrelies on competing commercial MCPs. During thissame time period, the number of public insurersincreased from 13 to 15, but because the expansionincluded MCPs that covered multiple counties, thenumber of county-based regions in which they operated increased from 14 to 23 during this time period.Auto-Assignment IncentiveDHCS has encouraged quality competition in multiple-MCP county-based markets by assigning a greatershare of enrollees who do not make a plan choicethemselves to the MCP in that county that demonstrated the highest scores on a predetermined subsetof quality measures in the prior year. An MCP benefits financially from auto-assigned enrollees not onlyby gaining a greater number of enrollees, but alsobecause these patients tend to use services at a lowerrate than those who actively choose an MCP. Thus,they are lower cost relative to the fixed capitatedamount DHCS pays the MCP to provide and managetheir care.California Health Care FoundationImprovement PlansDHCS requires MCPs to create performance improvement plans for measures that fall below its minimumperformance level (MPL). Until 2019, DHCS set theMPL at the 25th percentile among Medicaid MCPsnationally. MCPs are exempt from this requirementduring the first year they are required to report agiven measure. DHCS has also on occasion waivedrequirements for improvement plans, as they did forthe four Children and Adolescents’ Access to PrimaryCare Practitioners measures beginning in 2013. Theimprovement plan process has evolved over time andis currently comprised of Plan-Do-Study-Act (PDSA)cycle worksheets, which each MCP completes andsubmits every four months. These improvement plansdetail the MCP’s strategy to improve its performance,including what the MCP will test, how it will measureimprovement, the measurable target for that PDSAcycle, and the MCP’s analysis of results.FindingsMedi-Cal Managed CareQuality TrendsAmong 41 quality measures collected over time usingHEDIS (35 measures) and CAHPS (6 measures), 19significantly improved on average across all MCPsbetween 2009 and 2018, 5 declined, and 17 remainedunchanged (Appendix B). A similar distribution isobserved after excluding 10 HEDIS measures no longer reported by DHCS (see Figure 2 on page 11).Two HEDIS measures (appropriate use of asthma medications, and diabetes control defined as HbA1c lessthan 7%) phased out in 2010 did not lend themselves toevaluation over time. While the statistically significantimprovement was in some cases relatively small (ranging from 3.2 to 32.1 percentage points), the clinicalsignificance in all cases could be interpreted as substantial, given the corresponding size of the impactedpopulation. For example, even though scores for thebreast cancer screening measure improved only from50.1% to 56.2% between 2009 and 2018, the numberwww.chcf.org10
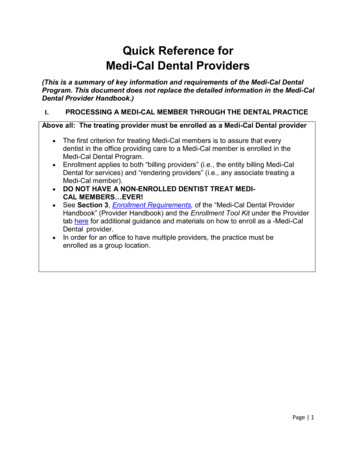
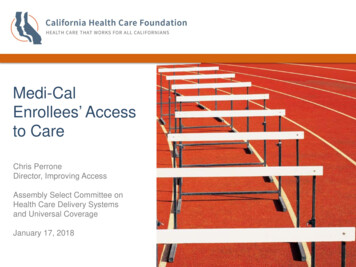
Figure 2. C urrent Quality Measures, by Change Over Timein Statewide Average Score, 2009–18of women in Medi-Cal managed care eligible for thisexam is in the millions, suggesting that tens of thousands of women experienced improvements in theircare over time. Of course the same could be said formeasures with significant declines. Small differencesin measured performance could reflect worseningcare for substantial numbers of Medi-Cal enrollees. Itis also notable that Medi-Cal enrollees’ consistentlyrated their MCP below 2.0 stars, indicating an averageperformance among Medi-Cal MCPs that is below the50th percentile nationally.NUMBER OF MEASURES Retired Active451512Three of the four measures that declined over time onaverage across all MCPs were related to care of children: “Childhood Immunization Status,” “ChildhoodAccess to Primary Care ages 12 to 24 months,” and“Childhood Access to Primary Care ages 25 monthsto 6 years” (see Figure 3). Of the other six qualitymeasures still in use by DHCS in 2018 that are relatedto children, three showed improvement and threeshowed no change in quality.14ImprovedNo ChangeDeclinedAFFECT ON QUALITY OVER TIMENote: See Appendix B for details.Figure 3. C urrent Childhood Quality-of-Care Measures, Change Over Time in Statewide Average Score, 12–24months*–1.9–0.2–1.3Access to Primary Care25 monthsto 6 years*7–11years–3.3Immunization Status*12–19yearsCombination Combination23Counseling*NutritionWell-Child VisitsPhysicalActivity3rd–6th Yearsof Life*Change is statistically significant.Notes: Not every measure was reported every year. Change over time represents percentage points. See Appendix B for details.Source (Figures 2 and 3): Author analysis of the annual “Medi-Cal Managed Care External Quality Review Technical Report” released by the Managed CareQuality and Monitoring Division of the California Department of Health Care Services.A Close Look at Medi-Cal Managed Care: Statewide Quality Trends from the Last Decadewww.chcf.org11
In addition to examining individual MCP performanceover time, it is possible to assess trends in quality ofcare for Medi-Cal managed care enrollees statewideby weighting results by the number of enrollees ineach MCP. Statewide, 21 measures improved overtime, 9 declined over time, and 11 were unchangedover time (Appendix C). In addition to the threechildhood measures noted to decline over time inthe unweighted analysis of MCPs, the populationweighted results also reveal declining performance inwell-child visits in the third through sixth years of life.The timeliness of prenatal care also declined slightlybut significantly over time. Three measures that weredeclining over time, related to monitoring of patientson digoxin and medication management of patientswith asthma, were dropped from ongoing assessmentafter 2015. The only CAHPS measure that improvedover time asked enrollees to rate how well doctorscommunicate.Minimum Performan
A Close Look at Medi-Cal Managed Care: Statewide Quality Trends from the Last Decade. California Health Care Foundation www.chcf.org 2 Contents 3 Executive Summary Background Data Sources Key Findings Opportunities for Improvement 5 Introduction Background The Growth of Medi-Cal Managed Care