Transcription
Loss Harvesting: What’s It WorthTo The Taxable Investor?Investment Management Reflectionsby Robert D. ArnottAndrew L. Berkin, PhDJia Ye, PhDInvestmentManagementReflectionsFQ PERSPECTIVELOSS HARVESTING:WHAT’S IT WORTH TO THETAXABLE INVESTOR?1*@36CE C?@EEManaging Partner ?5C6H % 6C :? )9Associate Director #:2 16 )9Director M First Quadrant, L.P. M '@ Past performance is no guarantee of future results. Potential for profit is accompanied by possibility of loss.
Loss Harvesting: What’s It Worth To The Taxable Investor?Loss Harvesting:What’s It Worth To The Taxable Investor?INTRODUCTION . 1GOOD TURNOVER AND BAD TURNOVER . 3THE NATURE OF THE SIMULATION . 4“TAX ALPHA” IN LOSS HARVESTING STRATEGY . 5WHAT ABOUT THOSE DEFERRED TAXES? . 7LOSS HARVESTING TURNOVER . 9TAX RATES . 10CONCLUSION . 11FQ PERSPECTIVEREFERENCES . 122This article appeared in the Journal of Wealth Management, Spring 2001.
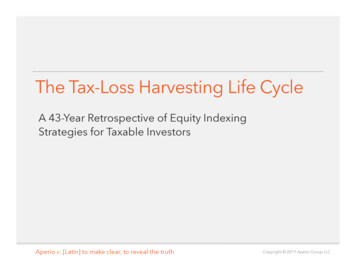
Loss Harvesting: What’s It Worth To The Taxable Investor?AbstractLoss harvesting has become a well-known tool for the management of taxableportfolios. By “harvesting” losses, we realize capital losses which, for tax purposes,can be offset against any gains an investor may have. Often, this can bring the capitalgains taxes down to zero or even create loss carryforwards for future tax years. Howmuch is it worth to the taxable investor? Specifically, if we assume no stock selectionskill whatsoever, how much can we increase the after-tax returns on a portfolio bycombining loss harvesting with otherwise passive portfolio management? The answeris that loss harvesting adds a great deal of value, far more than most active strategiescan hope to achieve, net of trading costs and capital gains taxes. We find that lossharvesting is remarkably robust, adding substantial value over time, whether marketsare volatile or quiet, strong or soft.Loss Harvesting:What’s It Worth To The Taxable Investor?Adding value in actively managed portfolios is a difficult challenge: the investmentideas must have value which is greater than the round-trip trading costs, and theremust be a willing counter-party on the other side of the trade, who will necessarilylose that same relative return and pay their own trading costs in the process. Findingalpha for taxable investors through tax avoidance and tax deferral, on the other hand,is remarkably easy. Yet, assured alpha through tax savings is too often tossed asidein the quest for uncertain alpha in active management.Numerous studies have shown that is takes 2%-3% of pretax alpha for a conventionalactively managed portfolio to match the after-tax returns of “plain-vanilla” indexing.Put another way, the first 2%-3% of alpha goes straight to the government (and farExhibit 110 Year Pre-Tax and After-Tax Growth of 1 Investedin Various Mutual Funds (1982-1991)*1098Dollars7CGM CapitalMagellanPre-TaxClosed-End Index 5006Vanguard Index 5005After Capgains tax*After cpgains dv tx*Aft def cpgains tx*43FQ PERSPECTIVE23Windsor*40% Income and28% Capital Gains1Rank
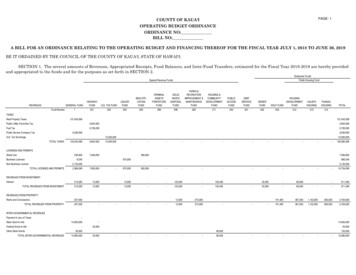
Loss Harvesting: What’s It Worth To The Taxable Investor?gfmore than that during a bull market!). Few managers can add that much valuereliably over the very long run. Less well-known is the fact that tax-advantagedinvesting can consistently add roughly another 60 basis points of after-tax alpha perannum, over and above index fund results, without any stock selection skillwhatsoever!We’ve seen tangible evidence of this in the mutual fund arena. Jeffrey and Arnottwrote an article in the Journal of Portfolio Management in 1992, in which the graphin Exhibit 1 appeared. It shows the ten-year pre-tax and after-tax growth of onedollar invested in various mutual funds. You can see the Vanguard Index fund beatsabout three-fourths of all mutual funds, but what’s interesting is that the after-taxreturn beats better than 90% of the 71 mutual funds in the study. Worse, only twofunds beat the index funds by any meaningful margin during this decade. Identifyingjust two out of 71 funds in advance would be a neat trick. The average margin ofgain for the six winners is a slender 90 basis points. The 65 that lost value relativeto the index, underperformed by a lofty 310 basis points per annum, for a decade.Results for longer spans are even more compelling, as we can see in Exhibit 2 (drawnfrom Arnott, Berkin and Ye, Journal of Portfolio Management, 2000).Exhibit 215 Year Pre-Tax and After-Tax Growth of 1 Investedin Various Mutual Funds (1984-1998)*2520Vanguard Index 500Pre-tax15DollarsAfter Capgains taxAfter Div Capgainstax10After all tax50RankFQ PERSPECTIVE*Note: 204 funds of over 100M included. Only every fourth fund is plotted here.4Basically, to succeed in taxable investing, an investor must avoid taxes that can beavoided, defer taxes that can be deferred, add value in areas where they have skill,avoid trading in areas where they lack skill, and avoid errors in each of these decisions.Surely, this is a daunting challenge, no? Actually, it is not as difficult as it sounds.To succeed in taxable investing, the central paradigm of active management needsto be reversed. Instead of incurring quantifiable and significant tax costs in the questfor uncertain gains (which all-too-often turn out to be losses), the successful taxadvantaged strategy places taxes first (see Stein and Narasimhan, 1999; Arnott,
Loss Harvesting: What’s It Worth To The Taxable Investor?Berkin and Ye, Journal of Investing, 2000). Losses are harvested, triggeringreductions in the customer’s tax bill, hence delivering a reliable and measurable “taxalpha” for the client’s after-tax returns. The quest for pretax alpha, through effectivestock selection, is, for the most part, limited to the reinvestment of proceeds fromthe harvesting of losses. The tax savings are actually tax deferrals: the taxes musteventually be paid. But, if we are, in effect, owing future moneys to the government,at least we are not incurring interest charges for the continued use of this money. Forthis reason, tax deferral strategies are sometimes characterized as an “interest-free loanfrom the government.”The only “hook” on this “free loan” from the government is that it must remaininvested in the same asset in which the gain accumulated. Suppose a stock hasdoubled in price. 50% of the asset is now an accumulated capital gain. In a 40%bracket, this means that 20% of the total value of the asset is “on loan” at zero interestfrom the government. If the long-term return for retaining that asset is at least 80%of the market return available on reinvestment, the taxable investor is ahead of thegame by retaining that stock. Of course, while individual assets may perform betteror worse than the market, it would be difficult to make the case that a portfolio ofthe “kept winners” would perform so drastically worse than the reinvestmentalternatives as to justify trading them. The obvious exception would be if individualstocks become such a large part of the portfolio as to disrupt the diversification.The relationship between turnover and holding period is an inverse relationship.When you have 50% turnover, your average holding period is two years. At 50%turnover, the first year’s gain is still in your portfolio, tax-deferred, for one additionalyear. If you have gained 10%, and therefore owe 4% in tax, you have been “loaned”4% by the government for one additional year, interest-free; this is a benefit worthwhatever the investor can earn on that 4% in the second year, presumably a few tensof basis points. Nice, but not worth deferring the sale of an overpriced stock. At33% turnover, the average stock is now held for two additional years. Taxes on thatfirst year’s gain of 10% are deferred for an additional year, plus taxes on the secondyear’s return also are deferred, both earning another year’s return. When you get to10% turnover, your average holding period is ten years. At 5% turnover, you havea 20 years average holding period, and so forth. Stated in this fashion, it’s quiteobvious that the average holding period and the benefit of tax-deferred gains does notincrease materially until you get to very low levels of turnover. A ten- or twenty-yearinterest-free loan is obviously very interesting, and should cause pause in selling anybut the most vulnerable issues that are held at a profit.FQ PERSPECTIVEGood Turnover and Bad Turnover5The issue of efficient taxable management is not as simple as turnover and holdingperiods, however. In effect, there is both “good turnover” and “bad turnover.” Goodturnover, from a taxable investor’s perspective, is turnover which reduces the year-endtax burden by realizing a capital loss. Most typically, the best is a transaction thatrealizes a short-term capital loss, although long-term capital losses are also helpful.This is because a realized loss triggers a tax savings, which delivers a near-termreduction in taxes. If that reduction in taxes is viewed as an indirect form of “alpha,”it means that it is remarkably easy to deliver a “tax alpha” to the portfolio. Thesetax savings can indeed be reinvested into the portfolio, further expanding the taxableinvestor’s portfolio wealth. Turnover which generates tax savings is generally referredto as “loss harvesting.”
Loss Harvesting: What’s It Worth To The Taxable Investor?“Bad turnover” is trading which realizes a capital gain, especially a short-term capitalgain, thereby triggering an increased year-end tax bill. Unless the relative success ofthe subsequent investment of sales proceeds is more successful than the liquidatedasset, by a margin which more than covers the tax bill, that turnover has damagedinvestor after-tax wealth. Because the taxes on a realized gain can often be quite large,it would require an excessive degree of stock selection skill to overcome this tax drainon after-tax returns.The Nature of the SimulationWe wanted to gauge how much benefit one could derive from simple loss realization,and to measure how the rewards of loss harvesting might depend on the characteristicsof market returns in the years ahead. The easiest way to do this is with a stochastic“Monte Carlo” simulation. Since the tax impact of trading is really the only aspectof active management that we can measure with any precision, the simulation focuseson a zero-skill investor, with no ability to discern which stocks were likely to performwell or badly. However, this zero-skill investor has a great deal of skill in lossharvesting.Since the tax impact of trading can be measured with precision and can be managed,we can use it to deliver a reliable “tax alpha”. The way we can do this is by harvestingthe losses, reducing the investor’s taxes, and reinvesting these tax savings into theportfolio. This is not a far-fetched assumption. Tax savings are a near-immediatecash flow benefit. Whether we are dealing with corporate quarterly tax estimates oran individual investor’s quarterly tax estimates, one can garner the benefit of taxsavings from loss harvesting almost immediately.FQ PERSPECTIVEWe simulate the returns for 500 assets (in effect, a simulated S&P 500), generatinga random 25-year life history for each asset. For each month, we assume 0.12%average dividend yield plus 0.54% average market gain, plus or minus a randomizednormal 4.3% volatility for the market. Effectively, this gives us an annual yield of1.44%, roughly matching current levels, plus a 6.48% annual price return, for a7.92% total return, plus or minus a normal 15% average annual market volatility.For each individual stock, we assumed that the return for each month is the marketreturn, plus or minus a random-normal 9% stock-specific volatility, equivalent toabout 31% annualized stock-specific risk, which again is fairly typical. We repeatthis exercise for 500 simulations of 300 months on 500 assets. Furthermore, withreinvestment of dividends and loss-harvesting, this quickly involves as many ashundreds of individual tax lots for each of the 500 assets in each of the simulations.In short, the simulation involves approximately ten billion simulated returns onindividual tax lot holdings for each simulation run1 .6It is also important to note that the composition of any index will change over time.This can often occur as a consequence of corporate actions. Companies go bankrupt,are taken over, or merge. It may also be a consequence of decisions made by themanagers of the index itself. Standard & Poor’s will sometimes make consciousdecisions to delete smaller or less important companies in order to make room fornew large-capitalization and bellwether companies. The same happens on an evenlarger scale in the Russell indexes, where the composition changes annually as aconsequence of market capitalization. This means that dozens and even hundredsof companies may be added to or deleted from one of the Russell indexes every single1 Ten years ago, thissimulation would haverequired a supercomputer.Today, it requires anordinary Sun workstationand about one weekendper simulation.
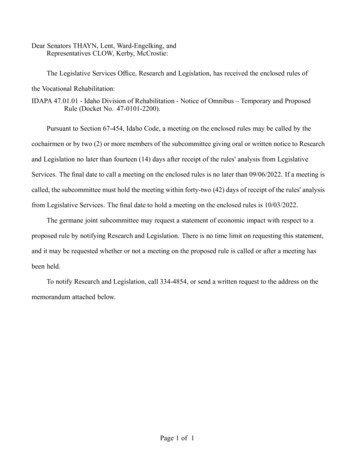
Loss Harvesting: What’s It Worth To The Taxable Investor?Qyear, solely because of the price movement and capitalization level changes relativeto one another. In our simulation, we examine the impact of corporate actions. Wemake the base case assumption that one company disappears from the index everymonth, corresponding to an average of 2.4% annualized turnover in indexcomposition.Lastly, we assume the 35% tax rate as our base case. Some investors (most of thereaders of this journal, for instance) pay as much as 50% marginal tax in combinedfederal, state and local taxes. 2 Other taxable investors (qualified NuclearDecommissioning Trust portfolios and some classes of insurers) pay as little as 20%.The 35% assumption is “not too far wrong” for both extremes. Suffice it to say thatthe 50% taxpayer should care more about taxes than we suggest, and the 20%taxpayer should care somewhat less, as we verify later.FQ PERSPECTIVE27In fact, the top U.S. taxbracket is north of 50%, afact which is not widelyrecognized. The top taxbracket of 39.6% does notinclude Medicare tax,which is uncapped at 2.9%(1.45% for employee andfor employer). State taxesin most states are 7%-10%;even after considering thedeductibility againstfederal taxes, the effectiveincremental tax from statesis 4%-6%. While it doesnot affect the most highlycompensated individuals,Social Security tax andemployer matching addsan effective 14.2% (7.65%is paid by you and another7.65% of your income isnever seen by you, but ispaid directly to thegovernment: 15.3% taxover 107.65% “true”income equals 14.2%).Then, deductions arephased out in federal taxesand most state tax plans asan additional “hidden” tax.For the federal taxes, theloss of deductions at a rateof 3 for every 100 ofreported income translatesinto an additional 1.2%tax. The same arithmeticon state phase-outs in moststates adds about another0.4%. All of this pushesthe top marginal taxbracket to approximately50%-54%, depending onthe state of residence.In each simulation, we have two portfolios: one is simple buy-and-hold and theother is tax-advantaged. In the tax-advantaged portfolio, we sweep through theportfolio each month, find all assets that have losses, sell those, and then buy themback immediately. For simplicity we ignore the “wash rule”; we have done simulationsthat include the wash rule as well, but differences are marginal. Once every quarter,we take any tax obligations from taxable gains out of the portfolio and reinvest anytax savings from loss harvesting back into the portfolio. Because the tax savings area “cash flow event,” money must be paid out for tax obligations and money isavailable from tax savings.By carrying out 300 Monte Carlo simulations, we cover scenarios ranging from theGreat Depression years (and far worse!) to the spectacular 50-fold cumulative totalreturns from stocks over the last 25 years (and far better!). In other words, the entirespectrum of likely market outcomes is covered in these simulations. Exhibit 3illustrates just one simulation drawn from the hundreds that went into this study.What we can see is the performance of a passive index fund in a randomly selectedsimulation, and the performance of the same assets under the loss harvesting rulesdetailed above. The loss harvesting portfolio, by reinvesting the associated tax savings,shows steady growth relative to the passive indexed portfolio.“Tax Alpha” in Loss Harvesting StrategyExhibit 4 shows the cumulative value-added for our base case set of assumptions. Foreach simulation, in each month, we compute the ratio of portfolio value for the lossharvesting portfolio, relative to the buy-and-hold portfolio. For each month, we findthe median ratio, the 25th percentile and the 75th percentile, out of the 300simulations. So, this exhibit shows how much value is added from a simple lossharvesting program, due to reinvestment of tax savings.A great deal of loss harvesting is possible in the first few years, and the earnings onthe associated tax savings leads to an immediate and dramatic increase in relativeportfolio value. After the first five years or so the pace of gain added begins todiminish rather sharply. Yet, even after 25 years, the “tax alpha” is still adding about0.5% per annum to portfolio wealth, an alpha that most active managers can’t addreliably pretax, let alone after-tax. After 25 years, the cumulative gain from lossharvesting is roughly 27%. This graph also shows the 25th percentile outcome andthe 75th percentile outcome, which basically represents the range of tax savings indifferent market conditions.
Loss Harvesting: What’s It Worth To The Taxable Investor?Exhibit 3Sample Simulation10.0Portfolio Value ( M)5.0Tax thsExhibit 4Portfolio Value RatiosBase Case: Median, 25th and 75th Percentiles1.351.30Ratio1.251.2075th Percentile1.15Median25th Percentile1.101.05FQ PERSPECTIVE1.0080.95050100150200Months250300350
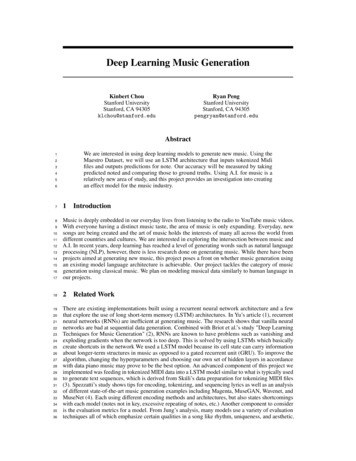
Loss Harvesting: What’s It Worth To The Taxable Investor?Exhibit 5 shows the month by month annualized “alpha” associated with a lossharvesting strategy. This graph tells a similar story to what we saw in Exhibit 4. Thetypical alpha in the first year of a loss harvesting program can be as large as 7%, fora portfolio that is funded initially with cash. However, it quickly falls off, fallingbelow 2% per annum before three years is finished and below 1% per annum beforefive years is finished. Even so, the early alpha sets the stage for a long-termaccumulation of value-added from tax-loss harvesting.Exhibit 5Portfolio Value Alphas10.009.008.00Alpha (%)7.0075th Percentile6.005.00Median4.0025th thsWhat About Those Deferred Taxes?FQ PERSPECTIVEThere’s a problem, however. If we harvest losses, we are cutting the cost basis of theholdings in the portfolio every opportunity we have, while the market typically isgrowing. What about the deferred tax obligation? Isn’t it much higher in the taxadvantaged program than in the benchmark? Absolutely. This should not beverlooked, because the deferred tax eventually needs to be paid unless one takesadvantage of the step-up in cost basis on death. Accordingly, Exhibit 6 showsprecisely the same numbers as Exhibit 4, but subtracts the deferred tax obligationfor each month in the simulation, showing the relative after-tax liquidation value ofthe portfolios.9For each month we ask the question, “What is the relative value of the loss harvestingstrategy, net of any deferred tax obligation, relative to the buy-and-hold strategy, netof its deferred tax obligation, if both portfolios were liquidated today?” Here, we finda much more moderate early benefit from tax loss harvesting, but it quicklycompounds and builds over time. Why is this? Because an interest-free loan for 20years is worth far more than an interest-free loan for five years, which is worth morethan an interest-free loan for a single year. If we view each loss harvesting opportunityas an opportunity to take out an interest-free loan, most of these loans are taken outin the early years (Years 1-5), thereby accumulating more benefit after 20 years thanafter just five.
Loss Harvesting: What’s It Worth To The Taxable Investor?gfExhibit 6Liquidation Value RatiosBase Case: Median, 25th and 75th Percentiles1.201.1575th PercentileRatio1.10Median25th xhibit 7 shows the annualized alphas net of all liquidation taxes, based on the ratioof the liquidation value of the tax-advantaged portfolio, as compared with theliquidation value for the buy-and-hold benchmark. Because the 25th percentile lineis mostly negative, we can see that there will actually be a slight negative liquidationvalue alpha in just over 25% of the portfolio in any given month. This short-termdrop occurs when the market falls, since the money saved by loss harvesting isinvested back in the market. That said, since the market tends to go up in the longrun, we note that over the full 25-year period even the 25th percentile outcome is wellahead of the benchmark, as seen in Exhibit 6.Exhibit 7Liquidation Value Alphas2.001.50Alpha (%)1.0075th PercentileMedian0.5025th PercentileFQ 300350
Loss Harvesting: What’s It Worth To The Taxable Investor?The median first-year alpha in Exhibit 7 is slight. Why is this? This is because withloss harvesting, we realize the loss; lowering the immediate tax obligation of theinvestor, but also lowering our cost basis by a near-identical amount. So, the benefitof a lower immediate tax bill is almost exactly offset by a higher tax bill owed uponliquidation. If we then subtract the liquidation tax to calculate the alpha, net ofliquidation taxes, of course the alpha net of liquidation taxes is near-zero. However,the accumulation of returns earned on those immediate tax savings accumulatespowerfully over time, still adding over 50 basis points per annum even after 25 years.Loss Harvesting TurnoverWhat about turnover? Turnover in a loss harvesting strategy is high at first, averaging50%, since we find that almost half the stocks in the starting portfolio fall. As thoseassets fall and the loss is harvested, the proceeds are reinvested in new assets, almosthalf of which fall, and so forth. There are two implications to this pattern. The firstis that an assiduous effort to harvest losses is highly rewarding. The so-called taxsensitive investment manager, who only engages in loss harvesting once a year at theend of a fiscal year, has probably seen numerous loss harvesting opportunities appearand disappear during the course of a year. The second implication is a “virtuouscycle” in any sort of assiduous effort to harvest losses whenever they occur andwhenever the tax alpha is large enough to justify the round-trip trading costs for theExhibit 8Loss Harvesting Turnover10.175th PercentileMedian25th Percentile0.010.001050100150200250300350FQ PERSPECTIVEMonths11investor. The more careful we are about pouncing on any meaningful loss harvestingopportunity, the longer the loss harvesting opportunities linger into the future, dueto the new loss harvesting opportunities created from the reinvestment of lossharvesting proceeds. This shows up in Exhibit 8 which shows substantial annualizedturnover for the first year of a loss harvesting program, diminishing sharply over thenext five years, and then, remarkably, stabilizing over the next 20 years at a levelwhich is higher than the level explained by corporate actions.
Loss Harvesting: What’s It Worth To The Taxable Investor?Tax RatesFinally, we test the impact of marginal tax rates in Exhibit 9. It is not surprising thatthe tax advantages associated with loss harvesting are roughly linearly related to taxrates. The 25-year benefit of simple loss harvesting yields 14% more wealth for aninvestor in a 35% tax bracket than simple passive investing, an impressive gain. Forthe investor in a 50% marginal tax bracket (see our earlier footnote for ademonstration that 50% tax brackets in the US are routine for those in the topExhibit 9Impact of Tax RatesMedian Liquidation Value Ratios, Base Case:Tax Rates of 50%, 35% and 20%1.251.2050% tax rateRatio1.1535% tax rate20% tax rate1.101.051.00050100150200250300MonthsFQ PERSPECTIVEincome brackets), this marginal improvement in wealth leaps to 20% in 25 years.Keep in mind that this translates into an 80 basis point annualized benefit. But, toachieve that 80 basis point benefit with conventional active investing one would haveto earn a 160 basis point alpha, with no capital gains taxes on those trades, whichmost observers of active investing would consider nearly impossible. Even for theinvestor in a modest 20% tax bracket (some categories of insurers and NuclearDecommissioning Trusts), the marginal benefit of loss harvesting is still a lofty 800basis points in just 25 years. Keep in mind that this is relative to a plain-vanillapassive portfolio, which in turn sharply exceeds the after-tax returns of the vastmajority of active managers.12350
Loss Harvesting: What’s It Worth To The Taxable Investor?ConclusionWe have simulated returns for 500 assets over 25 years to examine the benefits of lossharvesting for taxable portfolios, and found a huge advantage over the passive case.By rigorously realizing losses, the median portfolio would add about 27% comparedto a pure buy and hold strategy in typical market conditions. Even after liquidation,net of all deferred taxes, this advantage is still an impressive 14%. We have also stresstested these results under a variety of assumptions about the market, and while thefinal numbers change, the general conclusion is robust. In every case, loss harvestingadds significant value.There is nothing “magical” about this value added; we are not attempting to exploitany market inefficiencies. We are merely taking advantage of the U.S. tax code, byrealizing losses when available which can then be offset against gains from both insideand outside the portfolio. In this sense, loss harvesting acts as an interest free loanfrom the government, and when compounded over 25 years, that is a powerfuladvantage.In conclusion, how do we cut portfolio taxes? First, a roster of don’ts:·Don’t sell any existing portfolio just to buy an index fund. Sometimes peoplewill ask, “Should we just liquidate what we have and turn it over to a taxadvantaged manager?” The answer is, “Absolutely not.” It triggers the verytaxes you want to avoid.·Don’t handle manager transitions in a conventional fashion. Transitions,when you fire Manager A and hire Manager B, should be handled in as taxsensitive a fashion as portfolio management itself.·Don’t allow equity sales at a profit unless (1) there is an offsetting loss thatcan save you from being hit with a large tax bill, or (2) the valuation basisfor trade is exceptionally strong.·Don’t engage in active management without regard to tax consequences.This is an easy way to achieve a modest alpha which may or may not bepositive, less a massive tax haircut on your long-term accumulation ofwealth.There’s also a list of do’s:FQ PERSPECTIVE·13Do harvest losses. What Exhibits #4 and #6 show is just the “tax alpha” fromharvesting of losses. That tax alpha from harvesting of losses is material. Overa 25-year span, assuming modest 8% returns on stocks, we earn an averageof almost 1400 basis points of cumulative alpha just from harvesting thelosses. And that’s net of all of the taxes that you would face at the end of theperiod for liquidating the portfolio. It’s a very important source of after-taxalpha, and it’s a reliable, predictable source of after-tax alpha.
FQ PERSPECTIVELoss Harvesting: What’s It Worth To The Taxable Investor?14This material is for your private information. The views expressed are the views of First Quadrant, L.P. only through this period and are subject to change based on market and other conditions.All material has been obtained from sources believed to be reliable, but its accuracy is not guaranteed.FIRST QUADRANT, L.P. 800 E. COLORADO BLVD. SUITE 900, PASADENA, CALIFORNIA 91101MARKETING SERVICES INFO@FIRSTQUADRANT.COM OFFICE 626 683 4223 WEB FIRSTQUADRANT.COMCopyright by First Quadrant, LP, 2014, all rights reserved.
Loss harvesting has become a well-known tool for the management of taxable portfolios. By "harvesting" losses, we realize capital losses which, for tax purposes, can be offset against any gains an investor may have. Often, this can bring the capital gains taxes down to zero or even create loss carryforwards for future tax years. How