Transcription
HARP Manual v1.0Table of ContentsI.Quick Reference ChecklistsA.B.C.II.III.IV.V. .p2Pre- FlightIn- FlightPost- FlightDescription of InstrumentsVNC interfaceRoutine MaintenanceSpectrometer Control Software (LabVIEW) .p5 .p9 .p10 .p11A. StartupB. Data AcquisitionC. CalibrationsD. Set ParametersE. IRIG Timing .p12 .p15 .p16 .p17VI. Data Processing – Actinic Flux (Matlab)VII. Data Processing – Irradiance (Matlab)VIII. Calibrations .p18 .p21 .p24Appendix A – Internal DSM component layout p301
I.Quick Reference ChecklistsA. HARP Spectrometer Preflight Checklist1) Power on rack, power switch on black Tripplite power strip –red button behindmetal guard. Check that all DSM power switches are on (2 per box for a total of12 switches). The HARP DSM’s are designed to automatically start datacollection after bootup.2) Make sure spectral irradiance caps have been removed from light collectors.3) Allow LabVIEW to start all six spectrometers, check for spectra on all. VPNrequires several minutes or more to establish contact with laptop.4) Stop HARP LabVIEW software5) Check calendar date on computer (not set by IRIG! All six spectrometers)6) Use IRIG button on LabVIEW main menu to sync computer clock to IRIG time(all six spectrometers).7) Check integration times and dark current frequency and sample count are correct(integration times all six, dark current on the four spectral irradiance).8) Check setup in parameters to see that the shutter is active for spectral irradiancespectrometers (VIS and NIR, four total)9) Check shutters are switched to TTL mode on spectral irradiance spectrometers(four total)10) Move non-flight data to OLD directory for each instrument (six total).11) Pump down spectral irradiance light collectors (two total)2
a. Valve and Swage attachment located on top and aft outboard edge of rackb. Remove Swagelok cap (finger tight)c. Attach hand pump (finger tight)d. Open Valvee. Pump to 20 (or more) if possiblef. Close Valveg. Remove hand pumph. Replace Swagelok cap12) Power up Stabilized Platforms as described in Enviscope proceduresB. In Flight Checklist13) During flight check for flashing red LED (all six spectrometers) on front panel ofDSM. LED will toggle between lit and unlit every scan if working and freeze ifcomputer freezes. If frozen, wait 1 minute for self-correction software to clearerrors. Cycle power on any spectrometer which appears not to be collectingspectra.14) Monitor Stabilized platforms for correct motion (restart procedure)3
C. HARP Postflight Checklist1) Create flight folder (yymmdd [Flight ID] [Instrument ID] and move all flightdata to folder.2) Copy data from DAT directory to memory stick or laptop (six total).3) Shutdown computers via VPN link4) Power off main rack power.5) Place cap on nadir spectral irradiance (zenith, if possible).4
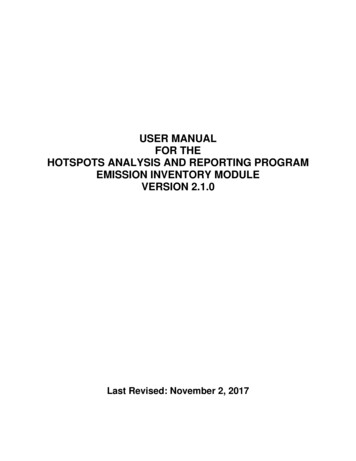
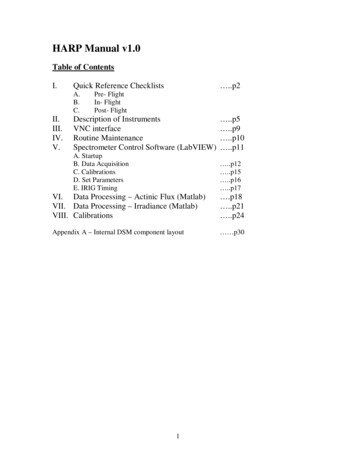
II. Description of InstrumentsThe HARP instrument package consists of six spectrometers for the measurement ofactinic flux and spectral irradiance. Each spectrometer is controlled with a PC-104 basedData-Sampling-Module (DSM) with wiring specific for each type of spectrometer. Thespectrometers are:Zenith Actinic FluxNadir Actinic FluxZenith Irradiance – NIRZenith Irradiance - visibleNadir Irradiance – NIRNadir Irradiance – visibleThe spectrometers and DSM’s are distributed on four shelves on the HARP rack. Eachactinic flux system is on its own shelf. The irradiance zenith (NIR and VIS) and nadir(NIR and VIS) systems are contained on two separate shelves with their respectivespectrometers and DSMs.Harp Instrument Rack5
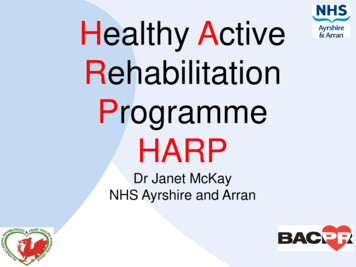
Actinic Flux System – CCD/optics in silver box, electronics in black boxIrradiance System – NIR and VIS spectrometers share shelf, the black boxes each containoptics and electronics. The two DSMs are in frontIn addition, the optical heads for the irradiance system are mounted on computercontrolled stabilized platforms to maintain a parallel orientation to the ground regardlessof airplane movement. The stabilized platform’s control systems run independently ofthe spectrometer control systems. All computer systems can be controlled via internetthrough the rack’s Ethernet switch and a laptop computer with a VNC connection.The actinic flux systems have a zenith optical collection head located on the top of thetail and a nadir optical collection head below the fuselage.6
Nadir and Zenith Optical CollectorsThe actinic flux heads transmit light to the spectrometers via fiber optic cable run from 1)the tail down to the rear of cabin and 2) through the underbelly to the port side of thecabin. These fiber optic runs from head to cabin are designed to be a permanentinstallation on the GV. The fibers are considerably more brittle than standard fiberoptics used on the aircraft. Therefore, extra care should be taken to ensure thefibers are not damaged. These two fibers are enclosed by PFA tubing to protect thesefiber runs.Zenith Fiber: Bare fiber entering cabin, Routed behind galley to protect fiber union7
Nadir Fiber: Entering cabin in port service tray, Fiber union in service trayThe two permanent fibers will be coupled to in-cabin fibers to complete the connection tothe spectrometers - with routing determined by the location of the HARP instrument rackfor each particular mission.The spectral irradiance systems consist of a nadir and zenith optical head mounted onstabilized platforms and a fiber running from each head that splits and is fed into twospectrometers (one in the visible and one in the near IR range). The zenith optical headand stabilized platform are mounted in the zenith viewing port with the optical fiber,purge line, and platform control cables being routed under the ceiling panels to the HARPrack.Fiber and purge line entering ceiling on Zenith Platform, Cables entering ceilingThe nadir stabilized platform is installed in the nadir viewing port with the cables andfiber entering the cabin and run to the HARP rack along the service tray. The irradiancefibers do not always have the protection of the PFA tubing when routed through thecabin. When not in use, the Zenith irradiance fiber may be stored under the ceiling panelbecause the glue and tubing used to create a seal in the stabilized platform is too large topass easily through the tubing run down to the service tray.8
Six individual DSM’s with PC-104 architecture control the HARP spectrometers. Theseconsists of a standard PC104 motherboard, a Diamond Systems A/D card that also hasdigital switching outputs, a Brandywine IRIG card to receive a timestamp from theaircrafts GPS timing computer, and two power supplies – one for the PC104 stack andone for the spectrometer. (Specs are listed in the Appendix)The DSM are powered by standard 60Hz 110V and provide the spectrometers and controlelectronics with their power through a 28V DC power supply that is individuallyswitched by the switch on the faceplate on the DSM. The spectrometer itself has anadditional relay to control power via software – this is used to ensure proper conditionsfor powering the sensitive spectrometer unit. Temperature sensors and RH sensors(Actinic flux only) are monitored via the A/D card and active regardless of thespectrometer’s status.The stabilized platforms are controlled via a separate computer system and control box,which receive data from an iMAR GPS/INS system mounted on the bottom of the HARPrack. The iMAR unit requires a unprocessed GPS signal from the aircraft’s GPS antennato function properly. The platforms will need to be initialized and calibrated prior toevery flight according to the startup instructions provided in a separate manual.III. VNC interface connectionAs an alternative to using a direct connection via a monitor, mouse and keyboard tocontrol the HARP DSM’s and the stabilized platform computer, the user can access theHARP package computers via a VNC connection using a laptop connected to the HARPrack’s Ethernet Hub (currently a separate network from the aircraft network) . The user’scomputer should have its IP address set to 192.168.1.10 (Do not obtain IP addressautomatically) and a VNC Viewer such as TightVNC installed. The HARP computersstartup with a VNC client running and are preset to the following IP address (nopassword is required):Zenith UV192.168.1.1Nadir UV192.168.1.2Zenith NIR 192.168.1.3Zenith VIS192.168.1.4Nadir NIR192.168.1.5Nadir VIS192.168.1.6Platform CPU 192.168.1.100iMar Nav Unit 192.168.1.199 (only for maintenance)Often, the VNC software will not update the all the graphics on the display screen for theremote computer in real time – it is necessary to click on the VNC window to force adisplay update.9
IV. Routine Maintenance (Actinic Flux Only)The Actinic Flux CCD spectrometers need to be run in a low humidity environment. TheLabVIEW software has a safeguard that only powers the spectrometer when the boxeshave a RH of below 10 %. The CCD box should be purged with dry N2 when the RH inthe box approaches 8%.Purge Port for Actinic Flux InstrumentTo purge the CCD box: Ensure spectrometer power switch is off. Run the LabVIEW program, RH Monitor . Insert a 1/16” tubing into the brass purge port on the rear panel and purge with N2at 20-40 PSI. Do not seal the port, as the port is both the input and output. TheRH should begin dropping immediately. Monitor the RH level in the LabVIEW program - Run N2 for approximately 20minutes after RH reaches a constant value. Remove the tubing and immediately close the port.Routine Maintenance (Irradiance Only)Both irradiance heads should be pumped down before each flight as described in the PreFlight Checklist:a. Valve and Swage attachment located on top and aft outboard edge of rackb. Remove Swagelock cap (finger tight)c. Attach hand pump (finger tight)d. Open Valvee. Pump to 20 (or more) if possiblef. Close Valveg. Remove hand pumph. Replace Swagelock cap10
V. Spectrometer Control Software (LabVIEW)The HARP spectrometer control software is a LabVIEW program that will start dataacquisition automatically when there is a shortcut to the HARP program in the WindowsStartup folder. The LabVIEW control software is the same for all six instruments, withthe specific type of spectrometer and other options selected with the “Set Parameters”function. To run other computer functions, or other LabVIEW programs, the user shouldexit from data acquisition.StartupAfter a short countdown, the program will automatically start flight data acquisition in‘autorun’ mode, unless the user selects ‘manual’ mode on the countdown screen.When manual is selected, the user is presented with the HARP main menu:11
Data Acquisition Modes-Flight – Default data acquisition mode. Can be started by the user at any time from theMain Menu or will start automatically upon Windows boot-up with no user present. InFlight mode, the data display is disabled to improve efficiency, but can be toggled on/offby pressing the “Show Data” button-Ground – currently the same as Flight Mode, with data display enabled by default.The data acquisition routine starts with a check of the housekeeping variables to ensurethey are within an allowable range. These ranges can be checked or modified with theSet Parameters function. The actinic flux systems monitor both internal humidity andtemperatures, while the spectral irradiance systems monitor temperatures only. Thesystem will only power the spectrometers when the housekeeping values ranges are met.If the actinic flux systems do not meet the humidity requirement, the spectrometer boxesshould be purged with N2 gas (see section Routine Maintenance).12
If the housekeeping tolerances are met, the HARP program then powers thespectrometers (provided that the DSM power output switch is also on). It may take up to30 seconds to establish USB communications to the spectrometer and its controlhardware. This wait is necessary any time the spectrometer power is reset.13
The Data acquisition screen is the same for Flight, Ground, and Calibration Modes. TheHARP program continuously monitors the Housekeeping Variables and will suspend dataacquisition if they move outside tolerances. The graph of the raw data can be toggled onand off with the show data switch. The HARP spectrometers are designed to runautomatically in flight mode upon boot-up of the DSM. It will run without a user andwithout a keyboard and monitor connected. The DSM box has a red indicator LED thattoggles on/off after each successful scan. If the indicator is not flashing with a frequencyequal to the scan frequency (typically 2-10 seconds, see Set Parameters), the system islikely hung up. Wait 1 minute to allow the software to clear any errors, then restart ifnecessary. Wait 5 min after restart for the data acquisition to begin.Spectral data and housekeeping data is saved to a new directory in the specified data patheach time the CCD is powered or reset. Both IRIG and CPU timestamps are logged tothe data files. All data will be saved to a directory in the folder c:\missionname\Dat\, in aseparate folder for each session labeled with the start date, start time, instrument ID, andintegration time (e.g. C:\2007TC4\Dat\070717 1243-40 z01 400\). The subfoldercontains all the spectral data and housekeeping data for that session, if the systemrequires a restart, the data for a flight will be in separate folders. Please see Post-Flight14
Instructions and Data Processing for requirements on organizing the output data forprocessing.Spectral and Wavelength Calibrations use the Data Acquisition Interface describedabove and require the user to log information on the calibration lamp and type. SeeCalibration Procedures, page X, for detailed instructions on performing field calibrations.Depending on the type of calibration, the HARP program will display a countdown timerto allow the required lamp to warm-up. If multiple calibrations are performed on thesame lamp, in succession, this countdown can be bypassed.After completion of a calibration, the program will return to the main menu.Angular Response Calibrations of the optics must be performed in the NCAR/ARIMprimary calibration lab at FL0.15
Set Parameters – this function allows the user to set parameters controlling the dataacquisition routine.On a flight to flight basis, the only parameters that should be changed are scannumber/integration time(s). The integration time(s) should be chosen so that theinstrument count rate never saturates. This will vary depending on the type(s) of fiberoptics used or whether there are colored glass filters to filter parts of the spectrum.Expected solar zenith angles and environmental conditions should also be considered.The time/scan parameter sets a regular time grid for the software to start a scan –integration time and number of hardware averages for each integration time should be setto fall within the time/scan. The software also allows for multiple integration times ineach scan.Project Directory and other information should be filled out for each mission. Longitude,latitude, and altitude are not necessary parameters for aircraft based data - theseparameters are obtained from the IRIG feed.The spectrometer S/N should match the installed hardware system – the software uses thesettings from spectrometer setting tab to initialize the different types of spectrometers.These settings should not be changed unless the DSM is moved from spectrometer tospectrometer – note that spectral irradiance DSM’s and actinic flux DSM’s are wiredsomewhat differently and cannot be interchanged.16
Calibration Lamp List contains a listing of all calibration lamps to be used. Newcalibration lamps should be added to this list.Calibration Field Stand contains a listing of all field stands lamps to be used. No newcalibration stands are expected to be added at this time.Diamond and IRIG addresses should not be changed.The spectral irradiance systems use a shutter to perform in-flight dark calibrations. TheShutter toggle should be activated for the Irradiance Systems and deactivated for theActinic Flux systems.Sync to IRIG – this function changes CPU time to match the IRIG time. Please note thatthe date (day, month, year) are not kept by IRIG so the CPU date must be set manually bythe user using the Windows clock. The software logs two timestamps – IRIG and CPUtime. In the event that the IRIG timestamp is unavailable, an accurate CPU timestamp isvery desirable.17
The HARP software logs both the CPU and IRIG time to its data files, but the CPU clockshould be synchronized to the IRIG time before each flight – if IRIG signal is lost for anyreason during flight, the CPU timestamp needs to be as accurate as possible to match thetimestamps across the instruments.VI. Data Processing – Actinic FluxHARP actinic main Path: ‘C:\HARP\Matlab\HARP actinic\Flux\HARP Main v2.m’Data output from the HARP LabVIEW data acquisition software is in binary format. TheHARP Matlab processing software applies the instrument sensitivity – which is derivedfrom the primary calibrations in the ARIM lab and from the secondary field calibrations –and the spectrometer specifications for wavelength assignments for each pixel.-File OrganizationData should be organized into a separate folder for each flight and each spectrometer. Ifan instrument ran smoothly for the entire flight, this folder will contain one subfolder:C:\2007TC4\Dat\070717ScienceFlight2 UV Z \070717 1243-40 z01 400\If the spectrometer was reset for any reason, there will be multiple subfolders:C:\2007TC4\Dat\070717ScienceFlight2 UV Z\070717 1243-40 z01 400\C:\2007TC4\Dat\070717ScienceFlight2 UV Z \070717 1447-42 z01 400\C:\2007TC4\Dat\070717ScienceFlight2 UV Z \070717 1512-08 z01 400\The processing software must be given data organized in the manner to correctlycombine multiple data sessions.-Running the Processing ProgramThe MATLAB program ‘CAFS Main v2.m’ takes parameters from a driver file andoutputs the results to the Results directory of the mission specified in the driver file. Toavoid overwriting processed data, these results are written to a new subfolder each timethe processing program is run. The file path of the driver file is specified by theDriverPath variable in the MATLAB and is the only user changed input in MATLAB.DriverPath 'C:\jvdata\2007TC4 DC8\txt\flx\TC4 DC8 entire mission.dvr';The HARP processing Drive File:18
A template driver file is provided with the software.Driver Fields for MissionmissionDirzeissSN ZzeissSN Npcaldist, teOutputsFlagsdirectory for each mission - must end with ‘\’serial number for each instrumentserial number for each instrumentunused at this time (primary cal related)uses all wvls below this to calculate in-flight backgroundshould be set to 290unused at this time (cal related)first wavelength to output (if valid pixel)last wavelength to output (if valid pixel)should be set to [1 1 1 0]19
outDirNameCommentNumFlightsUsed in name of Results Subfolder for processing runinteger number of flights to processDriver Fields for each imeZlogCommentZ1 run data, 0 don’t runflight data directorydark calibration data directorysensitivity fileselect time source 1 for IRIG, 2 for CPUintegration time for data/dark filesUsed in name of each Flight Subfolder in Results SubFolderAll fields need to be complete for the driver file to load properly. To run data for just oneinstrument, set either RunDataZ or RunDataN to 0.For each flight, the user must specify:a data directorya dark calibration file with the same integration time as the data filea sensitivity file (instructions on creating a sensitivity file below)the Time Source – should be 1 for IRIG unless IRIG failedthe Integration Timea Name for the individual flight SubdirectoryActinic Flux Results are saved in Tab delimited format and Matlab format, with acorresponding log file detailing pertinent instrument and processing parameters. Tabdelimited raw counts data and housekeeping data are saved in the data folder along withthe original binary data files.-Creating Sensitivity Files from Field CalibrationsCalibration tools path: ‘C:\HARP\Matlab\HARP actinic\Cals\’The MATLAB program ‘DialogMakeSensitivityFullGUI.m’ is used to create theinstrument sensitivity file used in Actinic Flux processing above. It requires data from aset of calibrations done in the field – spectral, dark and straylight – using the fieldcalibration lamps provided by and calibrated by the ARIM group. ARIM also provided aflux calibration file for each field lamp specific to the field stand configuration used onHIAPER.The program will prompt the user to select, using a GUI, a mission directory and then aspectral calibration file. Based on the spectral calibration selected, the user will then beprompted to select an integration time, stray light file, dark cal file, and Oriel file (this isthe calibrated flux file for the field lamp created with the ARIM calibration system). Anerror box will pop up if there are no appropriate cal files found. Check that there is acomplete set of dark, stray, and Oriel files for the lamp, instrument, and integration timespecified by the chosen spectral calibration file.-Notes on Calibrations and Choosing Integration Times20
At a minimum, a set of calibrations must be performed before each mission, as the fiberconfiguration and placement of the HARP rack can change each install, which will havean effect on the overall sensitivity of the actinic flux instruments. If possible, calibrationsshould be performed between every flight to ensure the instruments sensitivity does notchange and that there is no damage to the system. In particular, this is necessary toconfirm throughput on the irradiance instruments optical heads which have beendamaged in the past.The sensitivity file is time independent, so the integration time for calibrations can varyfrom the in-flight integration times. However, the dark characteristics of each instrumentchange at different integration times. Thus, a dark calibration is necessary at eachintegration time used in flight to correctly process the data. For the actinic flux system,performing one thorough calibration (with longer integration times and more averaging)after install, then performing shorter calibrations between flights is sufficient for theactinic flux system if tail access (zenith instrument) is limited.-OtherTo track instrument sensitivity (from individual spectral cals), the Matlab program‘DialogSensitivityPlot.m’ has been provided. The GUI will prompt the user for missiondirectory and instrument ID (which have the form of z01, n02, z03, n04, z05, n06), andwill then will let the user select which sensitivity files to track. Hold CTRL to selectmultiple files.21
VII. Irradiance Processing (MATLAB)Irradiance Path: ‘C:\HARP\Matlab\HARP irradiance\Main\HARP irradiance.m’Also provided is a MATLAB routine to convert the output from the four IrradianceInstruments into a single spliced spectrum for each the Nadir and Zenith Stabilized heads.The data format and processing is very similar to the Actinic flux program. TheIrradiance processing also runs from a simple driver file. The user must specify a datafolder and response file for both the NIR and VIS data, as well as specify the integrationtime and serial number for each spectrometer. The program will not work unless bothVIS and NIR data is specified. The serial numbers assignments are:Zenith VIS 044118Nadir VIS 044119Zenith NIR 044839Nadir NIR 044840Fig. Driver file for HARP irradiance – typically located in [MissionDir]\txt\ folder22
Remember that the data directory will contain the subdirectory or subdirectories createdby the instrument. It will not run properly if the binary data is placed directly in the datadirectory specified in the driver file. The program will automatically combine data insubdirectories of the given data directory. The HARP irradiance instrumentsautomatically open and close shutters at a regular interval in flight to take dark scans.The Labview program writes these in the binary data directory and the MATLAB codeautomatically handles the dark subtraction. Output is a tab delimited text file written inthe Results subfolder of the mission directory, with the timestamp being seconds aftermidnight on the start date .Creating Irradiance Response FilesCalibration tools for irradiance: ‘C:\HARP\Matlab\HARP irradiance\Cal\’The irradiance response files are created from a field and dark calibration for each of thepaired spectrometer systems using the Matlab program‘CreateResponseFromBinaryField.m’. For both the VIS and NIR systems, the user mustspecify the Spectra Cal Data Path, the Dark Cal Data Path, the Field Lamp File (providedby ARIM, from a primary calibration in the ARIM lab), the spectrometer serial number,the integration time, and the output file name/path. The secondary lamp files have asuffix of .S2 and a filename of the form ‘OS77 zen z04 nir 044839 from 1018.s2’denoting the secondary lamp used, the instrument name, the instrument serial number andthe NIST traceable primary lamp used in the ARIM lab.Fig. Matlab program to create irradiance instrument response functions23
The output is an single column ascii text file with the response – the wavelengthassignments are provided for each spectrometer in the ‘wavelength’ folder of the sampledata. The output filename has the form:RespFromFieldBin 070503 2100-00 z04 044839 OS77.asciiVIII. CalibrationsThe following components are required for calibrations and should be stored in the silverbox provided by ARIM:Field StandBlack Cloth cover for StandOriel Power SupplyCalibrated Osram LampsJelight Power SupplyMercury LampPost to hold Mercury Lamp2” square WB 360 optical glass filter5/32” ball driver3 10-32 screws to attach stand to aircraftEthanol and Wipes to clean optical headAdapter for stabilized platforms (with other screws, size?)A laptop connected via a long Ethernet cable to the HARP ethernet hub on board isrecommended to control instruments from the exterior of the aircraft during calibrations.Clean Optical HeadWipe head with ethanol on Kimwipe. Follow with a dry Kimwipe to removestreaks. Be careful - Ethanol can dissolve the black paint finish on the actinic fluxshadow ring and weaken the sealing o-ring.Attach the Field StandThe field stand is designed to attach directly to the shadow ring on the actinic fluxsystems. Use the three 10-32 screws to secure the stand to the aircraft.The two lamp leads should be inserted into the socket with the gray writing onthe lamp facing the optical head.Gently rock the lamp back and forth so that both leads touch the back of thesockets. The lamp must be perpendicular to the socket base. Only one lamp at a24
time should be removed from its labeled box, as they are indistinguishable, buthave different spectral outputs.Enclose Field Stand with black cloth coverMake sure cover is secured tightly to block out all exterior light and that thepower cord(s) are accessible. Attach white cord to Oriel Power supply.Operating the Oriel Power SupplyThe Oriel Power supply delivers a highly consistent power level to the Osramlamp during the spectral calibrations. It takes five minutes for the supply andbulb to heat up and reach equilibrium. In extremely cold ambient conditions, alonger warmup and insulation may be necessary.To start a spectral calibration1. Turn on the lamp power supply with the orange switch behind theprotective shield.2. Press the METER/ITEM SELECT key to check the current setting. Itshould be set to 10.20 Amps. If not, you will have to reset it using theprocedure below.3. Press the Lamp On button. The amp reading on the display should beginto rise.4. Note the OS lamp used and start time in the logbook.5. Ensure that the power supply reaches/stops at 10.20 Amps – we noticedthat the outlets on the RAF scissors lift, used to calibrate the ZenithActinic Flux system located on the tail, cannot deliver enough current ifany other electrical device (such as a laptop) is drawing power from thelift’s power supply. Calibrations are invalid if the current is not 10.20A6. Wait 5 minutes before beginning the calibration to allow the lamp to heatup. The LabVIEW program has a built in 5 minute timer to allow for thiswarm-up time.See Actinic Flux Calibration Procedure and Irradiance Calibration Procedurebelow for instructions on each method.Turning off Oriel PS1. Turn off the lamp by pressing LAMP OFF/SETUP on the power supply.2. If all calibrations are complete, allow current to ramp down to zero beforeturning off the power supply via the orange switch – turning off thepower supply without turning the lamp off first can damage thecalibrated lamp3. Open cloth cover to allow lamp to cool.4. When lamp is cool ( 5min), remove the lamp using the plastic sheath(without touching it) and place it in the appropriate box.Actinic Flux Calibrations25
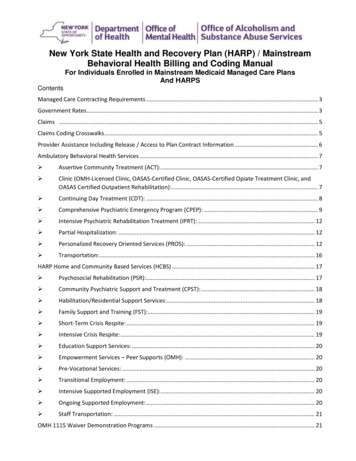
The Actinic Flux systems require three types of calibrations scans with each lamp– spectral, stray light, and dark. Time permitting, doing the calibrations withmultiple lamps will ensure that measured sensitivity changes are not due tochanges in an individual lamp’s output. Integration times (set in Set Parameters)in the 500-1000ms range are recommended along with 10 scans and 10 hardwareaverages.-Ensure no optical filters are inserted in the stand.-Ensure black cloth is secured tightly to block out all outside light-Turn on Lamp on Oriel PS-Select ‘spectral’ from Main Menu of HARP software in LabVIEW-Enter Lamp ID and Calibration type as ‘Field’ on pull down menus-Allow 5 min countdown timer to elapse, wait for spectrometer to start-Log Start Time, Type and Lamp used-Verify shape of spectra and check for saturation-Program will return to Main Menu when completeSpectral Calibration Above. Spectra shape affected by colored glass filter type.Multiple Integration times used in this calibration.26
Stray Light F
The HARP spectrometer control software is a LabVIEW program that will start data acquisition automatically when there is a shortcut to the HARP program in the Windows Startup folder. The LabVIEW control software is the same for all six instruments, with the specific type of spectrometer and other options selected with the "Set Parameters"