Transcription
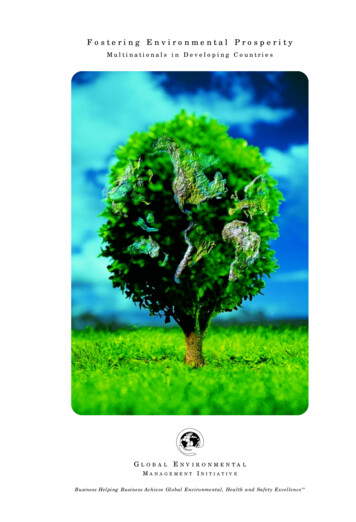
Fostering Environmental ProsperityMultinationals in Developing CountriesGLOBAL ENVIRONMENTALMANAGEMENT INITIATIVEBusiness Helping Business Achieve Global Environmental, Health and Safety ExcellenceTM
The Global Environmental Management Initiative (GEMI) is a nonprofit organizationof leading companies dedicated to fostering environmental, health and safety excellenceworldwide through the sharing of tools and information in order for business to helpbusiness achieve environmental excellence.
GEMI MEMBERSAnheuser-Busch CompaniesAshland, Inc.Bristol-Myers Squibb CompanyBrowning-Ferris IndustriesBurlington Northern andSanta Fe Railway CompanyThe Coca-Cola CompanyColgate-Palmolive CompanyCoors Brewing CompanyThe Dow Chemical CompanyDuke EnergyThe DuPont CompanyEastman Kodak CompanyElf Atochem North AmericaGeorgia-Pacific CorporationG o o d y e a r Ti r e a n d R u b b e r C o m p a n yHalliburton CompanyJohnson & JohnsonKoch Industries, Inc.Lockheed Martin CorporationM e r c k & C o m p a n y, I n c .MotorolaNovartis CorporationOccidental PetroleumOlin CorporationPharmacia & UpjohnPhillips Petroleum CompanyThe Procter & Gamble CompanyThe Southern CompanyTe m p l e - I n l a n dTe x a s I n s t r u m e n t s I n c o r p o r a t e d
The world’s national economiesare increasingly and inextricablyinterconnected. When largecompanies operate across international borders, theevidence shows that international companies are positiveforces for both economic development and environmentalhealth and safety performance.No country is an economic island. The signs are allaround us: In 1998, tens of thousands of American workerslost their jobs as Asia’s economic downturn erased exportdemand for their employers’ products; mergers andacquisitions routinely take on an international flavor;short-term economic turmoil on one continent causescompanies based on another continent to revise earningsestimates; electric and natural gas utilities, traditionallylimited to highly regulated domestic markets, are crossingborders to expand their businesses; and, the mediaroutinely report as important daily news the closingprices of major stock indexes around the world.1
Share of Sales in Local Markets:Majority Owned Non-Bank U.S. Affiliates100%Multinational corporations(or MNCs) – those that are head-80%quartered in a home country and60%operate in many countries aroundthe world – account for a large and40%growing share of business across20%the globe. In fact, among largecompanies headquartered indeveloped countries, those that donot operate across internationalborders are exceptions to the more0%1985 19951985 19951985 1995AfricaAsiaLatin AmericaSource: U.S. Direct Investment Abroad:1994 Benchmark Survey, U.S. Dept. of Commercegeneral practice of operating inmultiple markets.Despite their significant contri-environmental damage in developingbutions in fostering internationalcountries. Because MNCs have oper-commerce – or perhaps because ofated for a long time and in so manytheir role – MNCs are controversial.countries, there undoubtedly haveMNCs, critics claim, are sociallybeen cases where these criticismsand environmentally destructiveare accurate.forces of economic exploitation inThe overwhelming preponderancedeveloping countries. The essenceof the evidence today, however, supportsof the critics’ claim is this: MNCsexactly the opposite assessment:extract the raw materials of devel-Leading MNCs consistently areoping nations, pay substandardpositive forces for both economicwages to overseas workers, operatedevelopment and environmental healthwithout regard to local communi-and safety quality in the developingties, and then transfer what criticscountries in which they operate.regard as illegitimately gainedThe United Nations Conferenceprofits to MNCs’ home countries.on Trade and Development (UNC-In addition, critics allege thatTAD) concludes, in its 1998 WorldMNCs have – in part due to theirInvestment Report, that developingsheer size – caused significantcountries “are striving to promotethemselves” by adopting policies toattract MNCs. In addition, the report2
Advances inhave helpedtechnologyt h e e n v i r o n m e n t.3
Managementintegratesenvironmental and quality-of-life concernsinto4core businessdecisions.
Leading MNCs consistently arepositive forces for both economicdevelopment and environmentaland improved environmentalhealth and safety quality in theperformance. The first evidencedeveloping countries in whichthey operate.consists of analytical data on theimportant role that investment byMNCs plays in foreign direct investment in developing countries, thesays, many of the economic reformsmany respects in which MNC invest-that developing countries must makement lifts local economies, and –to attract MNC investment are nec-importantly – the superior environ-essary for such countries’ long-termmental performance of MNCs whensuccess. Developing countries recog-compared to that of indigenous firms.nize that MNC investment not onlyThe evidence includes a unique,provides near-term economiccomprehensive data set, assembledbenefits, but also provides a crucialfor GEMI by International Resourcesfoundation for economic prosperity.Group, Ltd., from factory-level WorldThe economic data and caseBank data, that shows MNCs instudies in the following reportdeveloping countries outperform allsimilarly show how MNCs positivelyother firms on environmentalinfluence industry’s environmentalgrounds.health and safety performance inIn addition to this statisticaldeveloping countries. Leadinganalysis of MNCs’ environmentalMNCs clearly hold themselves tohealth and safety performance,much higher environmental healththis report also presents a series ofand safety standards than those ofanecdotal studies of operations oftheir indigenous competitors. It alsoGEMI-member companies in devel-stands to reason that indigenousoping countries. The case studies,companies can be forced byreporting on both those companiescompetition with MNCs to improvethat are new to international marketstheir environmental health andand those with long internationalsafety performance.experience, point to the dramaticTwo types of evidence – analyticalpositive effects that MNCs have inand anecdotal – are presented inthis report to support the fact thatMNCs foster economic prosperity5
Leading MNCs clearly holdthemselves to much higherenvironmental health and safetyvating to reduce the use of heavystandards than those of theirmetals and recycle wastewater.indigenous competitors.Finally, the case studies show oneU.S. oil company almost reinventingpetroleum extraction in Ecuador todeveloping countries. The cases showreduce its “footprint” in remoteone U.S. pharmaceutical companyjungle areas, and another companyintroducing EH&S systems andtraining students in China to teststandards to a Russian pharmaceuticalfor and monitor water quality; andplant that had none, and anothera consumer products company soentering into agreements to preserveimproving the environmental healththreatened habitat in Costa Rica;and safety practices of an acquiredU.S. consumer-products companiesplant in the Czech Republic thatworking in China and Brazil tothat country’s president cited it asreduce water use and improve watera model for other companies.quality; and major U.S. chemicalCoupled with the rapidlycompanies combining new plantaccumulating statistical evidencedevelopment with habitat restorationdemonstrating the superiorand preservation in Spain, and alsoenvironmental health and safetyupgrading wastewater treatment inperformance and positive economicVenezuela so well that the qualitycontributions of MNCs in develop-of the effluent from the plant faring countries, the examples outlinedexceeds the quality of the waterin this report lead to an inescapabledrawn in from a major lake. Theconclusion: Once one recognizescases also describe a U.S. oil ser-that economic developmentvices company building a landfill forinevitably will take place in thesenot only its wastes but also those ofcountries, it becomes clear that itthe Brazilian community in which itis to developing nations’ distinctoperates;economic and environmentalthe world’s leading maker of photo-advantage to foster environmentalgraphic film setting an example forprosperity by orienting theirMexican firms on waste minimiza-policies to attract MNCs. tion and resource conservation; anda semiconductor manufacturer inno-6
Knowledge and informationtransfert o t h e l o c a l e c o n o m y,improving the quality of life7
Companies becomeembeddedinlocal communities as they shift to servinge m e r g i n g m a r k e t s.8
Economic ReportMultinational Corporations’ Economic andEnvironmental Impact in Developing Countriesfigure 1In order to quantify the impacts of MNCs indeveloping countries, GEMI commissionedInternational Resources Group, Ltd. (IRG) tosurvey the current economic and relatedenvironmental literature and to provide freshanalysis based on its own databases. The resultssuggest that MNCs collectively have significant, positive environmental,A social, andeconomic impacts in the developing world.Moreover, the quality of MNCs’ environmental performance and their contributionsto economic growth in host countries often aresuperior to those of domestic firms.B Directforeign investment (DFI) – defined by theWorld Bank as net inflows of capital toacquire a lasting management interest (morethan 10 percent of voting stock) – by MNCs issteadily rising, having reached 350 billionCby 1996.[31] The resulting output of MNCaffiliates in developing countriesD is well inexcess of the GDP of India[31] (see figure 1).We examine the impacts of MNCs indeveloping countries under three broad topics:1. National and regional influences ofMNCs’ DFI.2. Economic impact of MNCs’ operations,according to indicators on trade,employment, incomes, and transfer ofintellectual capital.3. Environmental performance.A.B.C.D.Total Value of Outputfrom Foreign Affiliates(in billions of U.S. dollars)GDP of ChinaGDP of India 445GDP of Mexico 283 150198219901994Source: U.S. Direct Investment Abroad: 1994 Benchmark SurveyFinal Results, U.S. Department of CommerceD ATA S OURCESExisting data on MNCs, while ample, arescattered among many different sources, andtherefore IRG was required to extract andreorganize a great deal of information fromother studies and databases. The most widelyavailable and reliable data are on U.S. MNCs,from which larger conclusions may be drawnabout MNCs globally when no other data exist.Data sources used include U.N. Conferenceon Trade and Development (UNCTAD) WorldInvestment Reports (1992-1997); U.S.Department of Commerce Benchmark Surveysof U.S. Direct Investment Abroad (1982,1989, 1994); Organization on EconomicCooperation and Development (OECD)Reports; World Bank World DevelopmentIndicators (1997); academic studies; our ownsurvey of GEMI member companies; andInternational Resources Group’s proprietarydatabases.In this report, the term “environmental” can be understood to include health and safety.The terms “host country,” “domestic,” and “local” are used interchangeably throughout this report.All figures in this report and case studies are in U.S. dollars unless otherwise noted.In this report we define “developing countries” as low-income economies (GNP per capita of less than 765) and middle-incomeeconomies (GNP per capita between 766- 9,386). These cutoff points are based on the World Bank’s World Development Report 1997.9
figure 2The scale and concentration of theseinvestments is significant. Developing countriesnow receive nearly 40 percent of global inflowsof DFI.[31] These investments are heavilyconcentrated in Asia and Latin America withjust 14 countries receiving 80 percent of DFI(see figure 2).[31] China alone accounted for 43percent of the DFI received by those 14 countries in 1996, including Hong Kong.[20] Giventhe two regions’ large population share andrapid economic growth in recent years, thesedata may not be surprising. Under liberalizedtrade rules, these emerging markets naturallyattract investment.Regional Distribution of the DFIin Developing Economies(In millions of U.S. dollars) 81,241 80,00060,000 38,56340,00020,000 12,261 4,949South- Latin Central/ AfricaEast America EasternAsia& the EuropeCaribbean 1,893 1,149 571 0Middle Central Devel.EastAsia EuropeSource: World Investment Report 1997, OECDMNC I NVESTMENTS L IFT L OCAL E CONOMIESMNC’ S M AKE L ONG -T ERM I NVESTMENTSIN E MERGING M ARKETSThere are six important mechanisms toassess MNCs’ economic effects in developingcountries:It is important here to distinguish the types ofinvestments most relevant to MNCs from otherDFI. Foreign funds can be seen as either nondirect foreign investment – typically short-termportfolio investments – and direct foreigninvestment. Our analysis focuses on DFI innon-financial sectors, such as trade, manufacturing and resource industries, that are mosttypical of MNC activity. As shown in figure 3,DFI – the mechanism most often used byMNCs in the developing world – is much lessvolatile than portfolio investment.[31] MNCsmake long-term investments in people, plantand equipment.1. Employment and wages2. Local capital formation3. Penetration of host-country markets4. Contribution to host-country exports5. Public revenue gains6. Transfers of intellectual capitalBecause MNCs typically incorporate in theirforeign operations advanced technologies andmanagement concepts developed and finetuned in MNCs’ home countries, the resultingefficiencies would be expected to cause rela-figure 3Direct Investment v. Portfolio InvestmentCapital Inflows to East Asia as a Percent of GDP18%1614121086420-2-4-6(6 Year Avg.)1983-881989-95Direct Investment19911993Portfolio InvestmentSource: World Investment Report 1997, UNCTAD1019921994199519961997
figure 4Export of U.S. MNCs as Percentage of Total Host-Country ExportsAverage Export Share 13.7%60%50%40%30%20%IndiaChinaKoreaSouth oNigeriaJamaicaPeruCosta Rica10%Source: U.S. Direct Investment Abroad: 1994 Benchmark Survey, U.S. Department of Commercemarkets are more mature. In addition, U.S.MNCs have become significant contributors tohost-country international trade. As shown infigure 4, they account for nearly 14 percent ofhost-country exports; manufacturing firmsenjoy nearly identical export share.Economic investment on such a large scalehas obvious positive effects on host countries’tax revenues. This is a very complex subjectthat receives extensive, ongoing study byOECD and the United Nations. Significantdifferences in tax policies, the difficulty ofmaking fair comparisons of tax payments, andother challenges make it difficult to comparetax effects of MNC investments among different countries and companies. Here we simplyfigure 5Employment Effects of DFIin Developing Economies40%Sri LankaSHARE OF TOTAL WAGEStively low MNC employment per unit of outputas compared to local firms. This result obviously may cause some short-term economicdislocations in local markets, but in the longerrun – as recent U.S. experience shows – thenet result is a higher living standard for thepopulation as a whole.[20]Yet total employment of MNCs in developingcountries is estimated to be between 30 millionand 36 million people, or about the same sizeas Mexico’s entire workforce.[20] In addition,foreign firms in developing countries accountfor a greater share of manufacturing wagespaid than would be expected from their shareof the workforce (figure 5).[31] MNC employmentappears to make positive contributions to developing countries’ economies.As one might expect at this point, DFI is amajor source of capital in developing countries, comprising about 10 percent of fixedcapital – and growing.[31]In a historic shift, an increasing amountof this capital appears to be focused ondeveloping local markets. Indeed, as shown inthe graph on page 2, U.S. majority-owned firmsare increasing the share of their productionoutput sold in host-country markets.[33] Thetrend is most pronounced in Asia and Africa,where U.S. MNCs nearly doubled their localmarket share of production; the trend is lessdramatic in Latin American because ARE OF MANUFACTURING SECTOR EMPLOYMENT02%4%6%8%10%Source: U.S. Direct Investment Abroad: 1994 BenchmarkSurvey Final Results, U.S. Department of Commerce11
figure 6effects that result.D Indeed, as shown in figure6, a significant share of the environmentalpatents in large, developing economies likeBrazil, China, and India comes from OECDcountries.[12]A study of MNCs’ impact in Mexico examines data from 20 industry sectors from 1965to 1984. It finds that the productivity level inMexican and U.S. industries were mergingover time and that the degree of foreignparticipation was a major factor.[3] As shownin figure 7, this implies that, without foreigninvestments, Mexico would have had lowerproductivity gains.There is evidence of increasing investmentsby U.S.-owned MNCs in research anddevelopment, one key indicator of intellectualcapital. Between 1989 and 1994, as shownin figure 8, R&D spending in host countriesby U.S.-owned MNCs more than doubled inLatin America and more than quadrupled inAsia.[34,35] This trend may well feed on itself,with R&D investments continuing to increaseas technical expertise improves in thedeveloping world. Already, data reportedby a number of GEMI members stronglyindicates that EH&S spending by MNCs iscomparable, as a percentage of sales, tohome-country levels.On a human dimension, MNCs consciouslyare fostering transfer of intellectual capitalthrough the ordinary flow of informationwithin their global corporate structures andthrough training programs. MNCs systematically transfer advanced management skillsShare of Environmental PatentsOriginating from OECD 8Brazil1971-88TOTALSource: Taxes, Tariff and Transfer Pricing in MNC DecisionMaking, Grubert and Mutti, 1991note that total tax payments by majority-ownedU.S. MNCs is approximately 6 billion annually – enough money to replace Venezuela’stotal annual government revenue.[34]Finally, perhaps the single most importanteconomic contribution of MNCs to developingcountries is the transfer of “intellectualcapital,” which includes technology andknow-how. We admittedly draw inferenceshere because intellectual capital by its verynature is difficult to quantify. But there is noquestion that a nation may position itself forsustainable growth by fostering increasedefficiency of labor and capital, to which growthof intellectual capital is key.The most common means to transfer intellectual capital is the direct supply of advancedtechnologies, research and development, training of local employees, and the spilloverfigure 7Productivity Growth in MexicoProductivityGap in 1970{}Productivity growthfor MNCsProductivity growth fordomestic firms with theeffects of foreigninvestmentIndication ofConvergenceProductivitygrowth for domesticfirms without the effectsof foreign investmentTime PeriodSource: Convergence of Productivity, Baumol, Nelson, Wolff (eds.)A. Strategic behavior might influence transfer of technologies, such as a perceived need to protect intellectual propertyfrom expropriation. It is not clear whether such behavior is socially or privately sub-optimal.12
figure 8R&D Expenditure of Majority-OwnedU.S. MNCs in LDCS(In millions of U.S. dollars)43 770%213In%Icreancrseeas 408e 476 15219891994Asia & the PacificLatin America & Other Western HemisphereSource: U.S. Direct Investment Abroad:1994 BenchmarkSurvey Final Results, U.S. Department of CommerceMNC S D EPLOY I NTELLECTUAL C APITAL TOS UPPORT E NVIRONMENTAL S TEWARDSHIPDeployment of intellectual capital is a keyto MNCs’ strong environmental performancein developing countries. MNCs are majorsources of pollution-control technologiesand environmental management concepts.As a result, not only do MNCs generallyproduce less pollution per unit of output thansimilar domestic firms, but they also serveas catalysts for economy-wide environmentalperformance improvements.This assessment of MNCs’ environmentalperformance is based on four fundamentalindicators:1. Investment patternsto host-country personnel, as illustrated infigure 9. When trained workers eventuallymove from MNCs to domestic firms, they canbe expected to spread their knowledge.Another indicator of investment inintellectual capital is the degree to whichcompanies adopt international standards inenvironmental management systems. MNCsare among the first to adopt ISO 14000 inMexico, for example.[10]2. Adoption of clean technology andpollution prevention3. Compliance performance4. Quality of environmental management systemsDeveloping countries usually have weakerenvironmental regulatory systems comparedto those of industrialized nations. Does itnecessarily follow that MNCs will go “permitshopping” among developing countries infigure 9Modes of Management Training by Foreign Affiliates in Czech RepublicOn-the-jobTraining abroadNew or promoted managers are paired with experiencedmanagers to learn management practices while on the jobUsed for exposing local managers to an internationalenvironment. However, as business climate has changedwithin the region, this sort of training has been increasinglyreplaced with in-country trainingCorporate trainingCustomized, in-house training in specialized countriesInternship abroadUsually held in a Western European affiliate for three to sixmonthsManagement centersMNC-funded institutions providing courses ranging from fullMBA programs to company specific classesPublic workshopsAfter-workUsed by MNCs to supplement in-house training programsMany MNCs provide tuition reimbursement for classes takenafter-hours to improve skills13
AN INDEPENDENT STUDY BYTHE SOUTHERN COMPANYE NVIRONMENTAL AND H EALTHI MPROVEMENTS AS FACTORS INM ARKET A NALYSISThe Southern Company studied China notonly in terms of market potential but also interms of environmental health improvementsfrom deployment of advanced power-generation in place of widespread direct use of coal.The results of Southern’s study offer a uniqueglimpse at how one MNC assessed the environmental potential of a developing market.In evaluating the People’s Republic of China as amarket for electric power generation facilities, theSouthern Company devoted considerable attentionto the market need for improved air quality andother environmental health issues.The World Bank, among others, has identifiedpoor air quality, especially indoor air quality,as China’s most serious environmental problem.Most of the air quality concerns are a result ofparticulate matter emissions. A major source ofparticulate matter generation is direct householdand plant-level use of coal for fuel, whereburning is less efficient and generates a higherdegree of emissions than in large electric powergeneration plants. For example, coal is the primary fuel for cooking in Chinese cities. Only 25 percent to 33 percent of Chinese coal consumption isfor electricity generation, compared to 85 percentof coal use in the United States.In addition, less than 40 percent of China’sthermal power capacity comes from units with acapacity in excess of 200 megawatts, while theaverage among industrialized nations is 60 percent. Smaller generation plants tend to be lesscost-efficient and energy efficient than largerplants, and they tend to have greater environmental impact per unit of output.The public health consequences of poor environmental quality are severe: According to theWorld Bank, smoke and particulate pollution fromburning coal causes more than 50,000 prematuredeaths and 400,000 new cases of chronic bronchitis each year in 11 large Chinese cities.Southern Company concluded that, if managedproperly, electrification can reduce the environmental impacts created by the direct combustionof primary fuels in the developing world, improvepublic health, and support economic growth.14order to avoid home-country environmentalregulation? A detailed review of existing studies revealed no evidence that U.S. and otherOECD direct foreign investment is affected byso-called “pollution havens.” In addition,strict U.S. regulation does not appear toencourage MNCs to go permit shopping.[2]Economic openness makes it possible forinvestments in intellectual capital to flourish,while comparatively lower wages in developing countries obviously help to attract investments in new markets. One study of LatinAmerican economies, covering the period1960-1988, strongly suggests that over thelong term more-open economies will attract acleaner set of industries.[20]figure 10Environmental Performancein IndonesiaFirms with foreign share have superiorratings compared to the private domesticand government-owned esticStateOwnedWith ForeignShareWorstNo effortto complyBestNot inIncompliance complianceBetterthancomplianceMNCs tend to bring their higher pollutioncontrol and energy-efficiency standards withthem when setting up operations overseas.Clean technologies learned and developed inthe United States or other MNC headquartersmarkets are built into production processesthat are exported. There are several probablereasons for this, among them: to ensureproduct quality, to avoid the costs of changingproduction processes, to reduce productioncosts, and to assuage shareholders’ concerns.When skilled and workers from MNCs moveto domestic firms, they can be expected todisseminate this knowledge.
figure 11Environmental Performance in IndonesiaFirms with foreign share generate lower organic waste compared to the firms with no foreign share.100% Domestic FirmsWith Foreign ShareAVERAGE BOD CONCENTRATION IN THE EFFLUENT300 mg/L250200150100Meeting high standards requires more thanadvanced pollution-control technology, however. Efficient use of production inputs plays anequally important role. Perhaps not surprisingly, a World Bank study of environmental performance in Venezuela concludes that foreignfirms are more likely than domestic firms touse energy-efficient production technologies.[2]The same study also found that foreign firmsare more likely than their domestic counterparts to use clean fuels, such as natural gas.Market factors, not regulation, appear todrive these trends. Environmental regulationsin developing countries tend to be poorlyenforced. If MNCs’ environmental behaviorwere motivated by the presence or absence ofregulation, then there would be virtually nocompliance difference between domestic firmsand MNCs. But in fact, enterprise-level dataindicate that firms with foreign ownershiphave significantly better compliance recordsthan do domestic firms.Our results are based on factory level datafrom Indonesia’s environmental ratings program, called PROPER. Under PROPER, factoriesare assigned color codes based on their performance relative to regulatory standards.A black rating is assigned to factories that donot invest in any effort to comply, while red isfor factories that apply some effort but notTextilePulp & paperMSGPalm oilOtherPlywoodRubberPharmacyBeverage50adequate for full compliance. Similarly, goodperformance has three categories – blue, greenand gold. Compliant factories get blue ratings;green is for significant over-compliance, whilegold is reserved for factories that use cleanproduction and that are close to zero emission.An analysis of the 1996 ratings (thelatest available) of nearly 300 Indonesianenterprises by ownership shows that for thegroup that had some foreign ownership,80 percent of the factories had blue or greenratings. In comparison, fewer than 50 percentof the private domestic plants of comparablesize and type had blue or green ratings.Comparison of the pollution levels in wastestreams confirmed that the enterprises thathad foreign ownership had superior performance compared to the private and stateowned firms (see figures 10 and 11).AS TUDY C ONCLUSIONThe evidence is clear: When today’s leadingmultinationals operate in developing countries,on balance they not only bring the financialbenefits of long-term investment but also raisethe bar for environmental performance andserve as sources of advanced management andtechnical know-how for host countries.A. For further information on PROPER, see the Indonesian environmental agency (BAPEDAL) website, www.bapedal.go.id andthe World Bank’s website, www.worldbank.org/nipr.15
CASE STUDY IA N H E U S E R -B U S C H C O M PA N I E SExpansion designed around global standards in the People’s Republic of ChinaIn 1995, Anheuser-Busch acquired an 80percent majority interest (since increased to87 percent) in a brewery in Wuhan, People’sRepublic of China. Since then, the companyhas invested 100 million in the plant todouble its capacity, to an estimated 2.1 millionbarrels of beer annually. Budweiser spentmore than 3.8 million on environmentalupgrades alone during the first three yearsof the joint venture.The expansion of the Budweiser-Wuhanbrewery is designed around Anheuser-Busch’sglobal environmental health and safety standards, perhaps most significantly involving theplant’s use and treatment of water. During thefirst two to three years, Budweiser-Wuhan cutits water use in half through water-conservationBudweiser-Wuhan International Brewery’s investment in wastewatertreatment technology helped reduce by 50 percent the quantity ofwaste solids for disposal.16awareness programs and projects. The expansion included building an anaerobic pretreatment system for the existing aerobic wastewater treatment plant (WWTP). The anaerobicsystem, or Bioenergy Recovery System (BERS),turns wastewater constituents into methane andreduces by approximately 50 percent the quantity of waste solids for disposal. The met
for GEMI by International Resources Group, Ltd., from factory-level World Bank data, that shows MNCs in developing countries outperform all other firms on environmental grounds. In addition to this statistical analysis of MNCs' environmental health and safety performance, this report also presents a series of anecdotal studies of operations of