Transcription
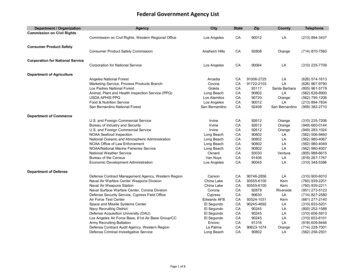
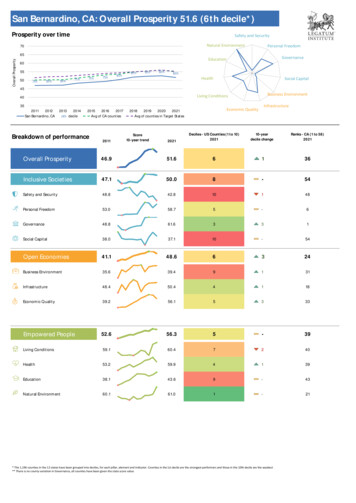
San Bernardino, CA: Overall Prosperity 51.6 (6th decile*)Prosperity over timeSafety and SecurityNatural Environment70Personal FreedomOverall th7th6th6th6th6th6thHealthSocial Capital45Business EnvironmentLiving Conditions403520112012San Bernardino, CA20132014nth decile201520162017Avg of CA countiesBreakdown of performance2011Score10-year trendInfrastructureEconomic Quality2018201920202021Avg of counties in Target States2021Deciles - US Counties (1 to 10)202110-yeardecile changeRanks - CA (1 to 58)2021Overall Prosperity46.951.66136Inclusive Societies47.150.08-54Safety and Security48.842.810148Personal Freedom53.058.75-6Governance48.861.6331Social Capital38.037.110-54Open Economies41.148.66324Business conomic Quality39.256.15333Empowered People52.656.35-39Living 8.143.69-43Natural Environment60.161.01-21* The 1,196 counties in the 12 states have been grouped into deciles, for each pillar, element and indicator. Counties in the 1st decile are the strongest performers and those in the 10th decile are the weakest** There is no county variation in Governance, all counties have been given the state score value
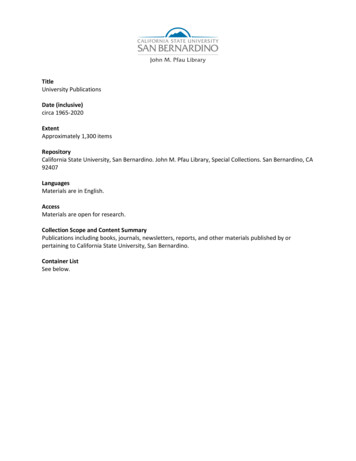
San Bernardino, CA (6th decile*): Pillar and element scores2011Safety and SecurityOverall Prosperity10-yr trend2021US Counties Decile10-yr decile chng.2021CA Rank202148.842.8101482011Personal FreedomOverall Prosperity10-yr trend2021US Counties Decile10-yr decile chng.2021CA Rank202153.058.75-6Mass Killings and nt Crime50%44.342.29-36Freedom of Association and Speech15%29.514.4911Property Crime35%33.231.59146Absence of Legal Discrimination25%60.561.1211Social Tolerance30%75.880.71-82011GovernanceOverall Prosperity10-yr trend2021US Counties Decile10-yr decile chng.2021CA Rank20212011Social Capital48.861.633131Personal and Family RelationshipsOverall Prosperity10-yr trend2021US Counties Decile10-yr decile chng.2021CA Rank202138.037.110-5425%50.060.97144Political Accountability30%56.863.35Rule of Law35%42.558.5421Social Networks25%30.021.910252Government Integrity35%48.163.1341Institutional Trust20%45.940.210-55Civic and Social Participation30%29.427.910-512011Business EnvironmentOverall Prosperity10-yr trend202135.639.4US Counties Decile10-yr decile chng.2021CA Rank202191312011InfrastructureOverall Prosperity10-yr trend48.4202150.4US Counties Decile10-yr decile chng.202141CA Rank202118Financing 2-11Domestic Market 0Burden of abor Market Flexibility10%41.427.010-1Price Distortions10%32.258.310-12011Economic QualityOverall Prosperity10-yr trend2021US Counties Decile10-yr decile chng.2021CA Rank202139.256.1533329.251.77338Fiscal Sustainability25%Productivity and 428Labor Force Engagement30%23.636.99-322011Living ConditionsOverall Prosperity10-yr trend2021US Counties Decile10-yr decile chng.202159.160.472CA Rank2021Health402011Overall Prosperity10-yr trend2021US Counties Decile10-yr decile chng.2021CA Rank20212011Overall Prosperity10-yr trend2021US Counties Decile10-yr decile chng.2021CA Rank202153.259.94139Material Resources25%58.860.76-41Behavioral Risk entative Interventions15%42.352.06-57Water Services15%45.344.18-35Care l ysical Health20%56.648.25-57Protection from cationOverall Prosperity10-yr trend2021US Counties Decile10-yr decile chng.2021CA Rank20212011Natural rall Prosperity10-yr trend2021US Counties Decile10-yr decile chng.2021CA Rank202160.161.01-2163.763.91-21Pre-Primary Education5%Primary Education20%33.135.310-40Exposure to Air Pollution25%55.160.17131Secondary Education25%33.048.59143Forest, Land and Soil20%50.247.95254Tertiary ult Skills25%34.540.17-41Preservation Efforts10%70.370.31-1* The 1,196 counties in the 12 states have been grouped into deciles, for each pillar, element and indicator. Counties in the 1st decile are the strongest performers and those in the 10th decile are the weakest** There is no county variation in Governance, all counties have been given the state score value
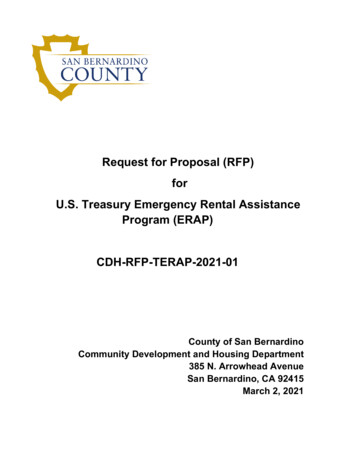
San Bernardino, CA: Safety and Security (10th decile*): Element and indicator scoresItalics: Indicator contains imputed valuesSourceUnit2011Mass Killings and Injuries(10th)15%US CountiesDecileValueWeight10-yr trend100.0202170.92011SourceUnit20211201110 Violent Crime (9th)US CountiesDecileValueWeight10-yr trend20212011202150%44.342.299NACJDdeaths pulationMass shooting 0 errorism 110 Aggravated 110 rceUnitWeightMass shooting deathsTerrorism injuriesTerrorism events1.50.02011Motor vehicle theftLarceny theftIdentity theftValue10-yr trend2021110 MurderUS .81,368.877reports 2011#N/AValue10-yr Property Crime (9th)Burglary0.9US CountiesDecile20112021#N/A ## ##* The 1,196 counties in the 12 states have been grouped into deciles, for each pillar, element and indicator. Counties in the 1st decile are the strongest performers and those in the 10th decile are the weakestValue10-yr trend#N/ASourceUnitWeight2011#N/A2021US CountiesDecile20112021#N/A ## ##Value10-yr trend2021US CountiesDecile20112021#N/A ## ##
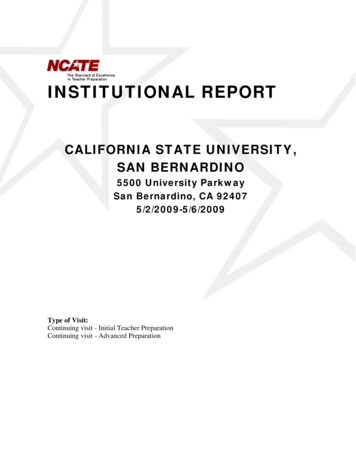
San Bernardino, CA: Personal Freedom (5th decile*): Element and indicator scoresItalics: Indicator contains imputed valuesSourceUnit2011Agency (6th)Fatal police shootings of unarmed civiliansStatewide death row populationStatewide adult incarceration30%35.810-yr 1.0111.01.851.869NCSL0.50.00.078BJSnumber /100,000adult population1.0750.0650.033 Statewide press suppressionUSPFTnumber /100,000state population0.50.0380.190760.5129.652.597 Statewide invasive cell phone ports e of LegalDiscrimination (2nd)Statewide LGBT non-discrimination laws10Freedom of Association and6Speech (9th)US CountiesDecileValue2011NAACPPOLStatewide LGBT relationships & parenthoodrecognition2021coding,0-1Statewide traffickingStatewide affirmative action in public servicesbanned56.82011Weightnumber /100,000populationCJRPStatewide government discrimination basedon sex prohibited2021UnitWaPoStatewide youth incarcerationStatewide employment anti-discriminationlaw10-yr trendSourcedeaths /100,000populationprisoners/100,000 youthpopulationStatewide religious freedom restoration actenactedUS CountiesDecileValueWeight25%0.0Value10-yr trend60.5202161.1101 Statewide free speech in public places10 Statewide right-to-work8US CountiesDecile201120211SourceUnitWeight20112 Social Tolerance (1st)Value10-yr trend2021US CountiesDecile2011202130%75.880.711number 633Catocoding,0-1Catocoding,0-11.01.01.011 Ethnic slur google trafficCatocoding,0-11.00.50.522 Statewide same sex marriage 52.02.01Statewide LGBT non-discrimination 0.0Unit2011#N/A0.0Value10-yr trend202145 Hate group concentrationUS CountiesDecile20112021#N/A ## ##* The 1,196 counties in the 12 states have been grouped into deciles, for each pillar, element and indicator. Counties in the 1st decile are the strongest performers and those in the 10th decile are the r trend2021US CountiesDecile20112021#N/A ## ##
San Bernardino, CA: Governance (3rd decile*): Element and indicator scoresItalics: Indicator contains imputed valuesSourceUnit2011Political Accountability (5th)Statewide Elections Performance IndexMITindex score,0-1US CountiesDecileValueWeight10-yr trend20212011Source201130%56.863.325 Rule of Law (4th)1.50.520.621010 Statewide Justice IndexCAWPpercentage0.528.330.825 Statewide judicial integrityStatewide state campaign disclosureNIMPindex,0-11.00.90.836Statewide term wide illegal corruption perceptionsStatewide Corruption Reflection IndexStatewide State Integrity InvestigationStatewide public record request complianceStatewide Online Spending TransparencyIndex2021US xpert survey,3-151.09.55.091ICSindex score,0-10.50.43960.313887CPIindex 8USPIRGindex lue10-yr trend2021US CountiesDecile20112021#N/A ## ##* The 1,196 counties in the 12 states have been grouped into deciles, for each pillar, element and indicator. Counties in the 1st decile are the strongest performers and those in the 10th decile are the weakest** There is no county variation in Governance, all counties have been given the state score value20212011202135%42.558.564index rank ht201135%10-yr trendNCAJSourceexpert survey,3-15Government Integrity (3rd)Statewide legal corruption perceptionsValue10-yr trendUS CountiesDecileValueWeight2021Statewide gender balance in legislaturesSourceUnitValue10-yr trend#N/ASourceUnitWeight2011#N/A2021US CountiesDecile20112021#N/A ## ##Value10-yr trend2021US CountiesDecile20112021#N/A ## ##
San Bernardino, CA: Social Capital (10th decile*): Element and indicator scoresItalics: Indicator contains imputed valuesSourceUnit2011Personal and FamilyRelationships (7th)US CountiesDecileValueWeight10-yr trend20212011Source201125%50.060.967 Social Networks tances /1,000female 69Shared meals with household members0percentage0.590.687.42Frequently hear from family and friends0percentage1.074.183.8108Close friends0average1.05.55.588Children in unmarried householdsTeen birthsStatewide parent's attendance of tional Trust (10th)Confidence in corporationsConfidence in the mediaStatewide trust in federal .01.00.5Value10-yr AValue10-yr .033.821.177 Frequently talk with neighbors0percentage1.065.539.821064 Trust in people in neighborhood0percentage1.541.050.81066 Statewide supportive neighborhood for a childNSCHpercentage1.045.449.110104 Statewide trust in peopleANEScoding,0-10.50.50.566US Civic and Social Participation(10th)Value10-yr on1.00.32CNCShours,per capita0.5Censushours,per capitaCensusStatewide helping the communityStatewide helping the community (microdata)US 51.872.1374Censuspercentage0.52.35.217Censusnumber /1,000population1.00.1640.20598Religious membership organizationsUSRCnumber /1,000population0.50.60.61010Religious organization participation0percentage0.515.016.499Sport or recreation organization participation0percentage0.510.99.968School, neighborhood or communityassociation participation0percentage0.512.311.18910 Statewide volunteer rate10 Statewide volunteering intensity4 Statewide volunteering intensity (microdata)(Non-religious) membership organizationsUnit10-yr trendFavors between neighborsStatewide active in neighborhoodSourceUS ationStatewide divorceUnitUS CountiesDecile20112021#N/A ## ##* The 1,196 counties in the 12 states have been grouped into deciles, for each pillar, element and indicator. Counties in the 1st decile are the strongest performers and those in the 10th decile are the weakestSourceUnitWeight2011#N/AValue10-yr trend2021US CountiesDecile20112021#N/A ## ##
San Bernardino, CA: Business Environment (9th decile*): Element and indicator scoresItalics: Indicator contains imputed valuesSourceUnit2011Financing Ecosystems (1st)Venture capital investedUS CountiesDecileValueWeight10-yr c Market1Contestability (10th)131.1499.111 Statewide low-income licensed occupationsInst JustUS CountiesDecileValueWeight10-yr 0NVCA /capita1.0Number of venture capital dealsNVCAnumber/1,000,0001.017.332.111 Statewide occupational licensing training costInst Just 1.0486.0486.01010Assets under managementNVCA /capita1.01,083.51,948.311 Statewide occupational licensing training timeInst Justdays1.0827.0827.099Venture capital fundraisingNVCA /capita1.088.8238.311 Statewide age requirements for licenseInst Justyears1.015.015.099New foreign direct investmentBEA /capita1.01,291.3575.414 Statewide regulation density indexCatoindex score1.0-0.025-0.030810Bank branch accessFDICnumber itWeight2011Burden of Regulation (2nd)10%Value10-yr trend41.7202145.5Statewide Federal Regulation and StateEnterprise IndexQuantGovindex score1.00.930.89Statewide state regulationQuantGovpercent1.01.8661.859US CountiesDecile20112021620112 Labor Market Flexibility (10th)3Statewide collective bargaining agreement2coverageFI99 Statewide employee health insurance costHJKWorkers Compensation Premium RateState ORStatewide minimum wageSourceUnitUnit2011Price Distortions (10th)Statewide subsidies to the private sectorStatewide Corporate Tax ScoreBEATax FoundValue10-yr trend2021US 60.171010index score1.04.434.9296* The 1,196 counties in the 12 states have been grouped into deciles, for each pillar, element and indicator. Counties in the 1st decile are the strongest performers and those in the 10th decile are the weakestDOLSourceValue10-yr trend202110%41.427.0percent1.019.5 0.5 per 100 UnitUS .52.71.59101.08.012.0109Weight2011#N/AValue10-yr trend2021US CountiesDecile20112021#N/A ## ##
San Bernardino, CA: Infrastructure (4th decile*): Element and indicator scoresItalics: Indicator contains imputed valuesSourceUnit2011Communications (2nd)40%US CountiesDecileValueWeight10-yr trend63.0202163.32011Source220112 Resources (8th)BBNMbps1.5108.4108.422 Customers affected by electricity outagesUltra-fast internet accessBBNpercent1.023.223.244 Statewide net electricity generationFast internet accessBBNpercent1.099.599.533 Water usageInternet providers (Business)FCCnumber0.547.049.011 Electricity outage durationElectricity outage frequencyUnitWeight2011Transport (10th)Value10-yr trend202135%37.837.20.50.0US CountiesDecile2011202110100.088Statewide number of airportsBTSnumber /squaremileRoad conditionBTSpercent1.54.84.899AARmiles /squaremile1.00.00.099BTSmiles /squaremile0.50.20.222Public road densityBTSmiles /squaremile1.00.30.388Bridge conditionBTSpercent0.52.634.8946Distance to airportBTSkm1.0116.2116.299Statewide railroad lengthBus transit route mileageSourceUnitUnit2011#N/AValue10-yr trend2021US CountiesDecile20112021#N/A ## ##* The 1,196 counties in the 12 states have been grouped into deciles, for each pillar, element and indicator. Counties in the 1st decile are the strongest performers and those in the 10th decile are the weakestUS CountiesDecileValueWeight2021Mean download speedSourceUnit10-yr trend20212011202125%39.848.498number /10,000population0.50.100.0077EIAkWh /capita1.00.00540.00521010USGSMgal er e10-yr trend#N/ASourceUnitWeight2011#N/A2021US CountiesDecile20112021#N/A ## ##Value10-yr trend2021US CountiesDecile20112021#N/A ## ##
San Bernardino, CA: Economic Quality (5th decile*): Element and indicator scoresItalics: Indicator contains imputed valuesSourceUnit2011Fiscal Sustainability (7th)Statewide government credit ratingStatewide state reserves capacityGovernment revenue to expenditure ratioUS CountiesDecileValueWeight10-yr trend20212011Source25%29.251.7102011Productivity and7Competitiveness (3rd)2011202125%57.175.6330.52.05.0109 Export value (goods)BIEM /capita1.01,577.81,812.3880days1.0-22.455.3106 Export value (services)BIEM /capita0.51,054.51,195.144Censusratio1.01.151.0225 Labor productivityBLS per hour1.568.781.1111.0-699.8365.613Statewide state pension 12.2087SourceUnitWeight2011Value10-yr trend2021US 5120.989.613 UnemploymentStartup early job creationKauffmannumber /1,000population1.05.166.345Startup early survival rateKauffmanpercent0.578.581.3Opportunity-driven startupsKauffmanpercent1.072.8Kauffmannumber /100,000population1.5number /1,0001.0USPTOSourceUnitUnitWeight2011number /1,000businessesDynamism (2nd)Patent applications2021rating /capitaRate of new entrepreneurs10-yr trendBallotpedia0Startup concentrationUS CountiesDecileValueWeight2021Statewide state budget balanceDebt-to-GDP ratioUnit2 Labor Force Engagement (9th)Value10-yr trend2021US .59.49102 Youth unemploymentCensuspercent1.025.319.79921 Employee EngagementGalluppercent0.529.034.05770.569 Statewide underemploymentBLSpercent1.08.15.699278.0478.794 Labor force nit2011#N/AValue10-yr trend2021US CountiesDecile20112021#N/A ## ##* The 1,196 counties in the 12 states have been grouped into deciles, for each pillar, element and indicator. Counties in the 1st decile are the strongest performers and those in the 10th decile are the weakestSourceUnitWeight2011#N/AValue10-yr trend2021US CountiesDecile20112021#N/A ## ##
San Bernardino, CA: Living Conditions (7th decile*): Element and indicator scoresItalics: Indicator contains imputed valuesSourceUnit2011Material Resources (6th)US CountiesDecileValueWeight10-yr trend2021201158.860.7629.226.576 Food 616.07Deep povertyCensuspercentage1.07.737.017Liquid asset povertyPros Nowpercentage1.045.945.9Statewide high risk loansTalk Povpercentage1.05.35.7Weight2011Water Services (8th)Statewide clean and safe water15%0Value10-yr trend45.3202144.16 Nutrition (5th)15%52.362.3451.081.889.373FApercentage7 Statewide borderline food securityUSDApercentage1.094.996.4517 Fruit consumptionBRFSSpercentage0.566.5060.201599 Vegetable consumptionBRFSSpercentage0.579.671.021012US CountiesDecile201120218SourceUnitWeight20118 Shelter (10th)Value10-yr trend202115%32.326.80.510.1US CountiesDecile20112021101012.04894.066 HomelessnessHUD1.01.01.057 Unsheltered homeless rateHUDpercentage0.562.173.66101.099.0499.0165 Households with overcrowdingHUDpercentage1.07.978.661010units / 100extremely lowincome tenants1.011.49.669HUDpercentageAvailability of affordable housingUnitUnit2011Connectedness (1st)15%Census202194.5Complete kitchen and plumbing facilitiesHouseholds with a smartphone20110.5CHRFCC2021percentagePublic drinking water violationsAccess to broadband10-yr trendnumber / 10,000populationScore,0 or 1SourceUS Low .074.8Value10-yr trend202192.796.284.7US CountiesDecile20112021122UISourceUnitWeight20111 Protection from Harm (2nd)3 Fatalities from unintentional injuries1 Traffic deaths* The 1,196 counties in the 12 states have been grouped into deciles, for each pillar, element and indicator. Counties in the 1st decile are the strongest performers and those in the 10th decile are the weakestValue10-yr trend2021US CountiesDecile2011202115%83.176.012CDCnumber /100,000population1.09.610.411CDCnumber /100,000population1.012.416.625
San Bernardino, CA: Health (4th decile*): Element and indicator scoresItalics: Indicator contains imputed valuesSourceUnit2011Behavioral Risk Factors (2nd)ObesityCDCpercentageUS CountiesDecileValueWeight10-yr ative Interventions2(6th)1.027.730.644 Adult dentist visitsBRFSSUS CountiesDecileValueWeight10-yr 954CHRpercentage1.517.115.041 Adult doctor visitsBRFSSpercentage0.566.571.278Alcohol use disorderDUH NatSrvypercentage0.56.35.547 Colorectal cancer screeningBRFSSpercentage0.561.867.676Illicit drug use disorderDUH NatSrvypercentage0.53.063.1399 Statewide child medical visitsNSCHpercentage0.587.264.155Pain reliever misuseDUH NatSrvypercentage0.54.24.277 Statewide HPV immunizationsNCIRDpercentage1.049.156.414Pap smear testBRFSSpercentage0.584.477.846Statewide child immunizationNCIRDpercentage1.054.168.654Statewide child dentist Weight2011Care Systems (5th)Statewide child mental health accessAdults with no health care coverageAvoided medical care due to costHospital ratingPreventable hospitalizations for epercentage1.00.51.0Value10-yr trend26.9202158.663.636.126.211.715.714.2US 15 Drug overdose deathsCDCdeaths / 100,000population0.57.011.43456 Serious mental illnessDUH NatSrvypercentage1.03.983.8822IMHEyears / .011.913.77483 Suicide0.571.871.27CHR1.07,535.84,170.055 Self-reported mental health not goodSourceUnitUnit20%56.648.2US CountiesDecile2011202171.2discharges /100,000Physical Health (5th)202115%percentage2021Value10-yr trenddeaths / 100,000population105 Mental Health (1st)HCAValue10-yr trendWeight2011Statewide disability weighted prevalence from7mental illness2011UnitUS CountiesDecile201120215SourceUnitWeight20115 Longevity (4th)Value10-yr trend2021US BRFSSpercentage1.028.930.345 Under 5 mortalityCDCdeaths / 100,000under 5populationCDCpercentage1.08.010.356 5-14 mortalityCDCdeaths / 100,0005-14 population0.513.911.853Heart attackBRFSSpercentage1.04.303.9055 15-64 mortalityCDCdeaths / 100,00015-64 population2.0279.9300.845Statewide disability weighted prevalence ofinfectious diseasesIMHEyears / 100,000population0.5350.5370.634 Maternal mortalityIMHEdeaths / 100,000population0.50.360.3365Self-reported poor physical healthCHRpercentage1.013.115.288 Mortality risk 65-85IMHEpercentage1.057.750.375High blood pressureDiabetes* The 1,196 counties in the 12 states have been grouped into deciles, for each pillar, element and indicator. Counties in the 1st decile are the strongest performers and those in the 10th decile are the weakest
San Bernardino, CA: Education (9th decile*): Element and indicator scoresItalics: Indicator contains imputed valuesSourceUnit2011Pre-Primary Education (8th)Pre-primary enrollmentStatewide state pre-K qualityCensuspercentageNIEERindex score,0-10US CountiesDecileValueWeight10-yr trend2021201139.440.282.040.438.974.04.78 Primary Education (10th)7 Math grade 4 level77 Statewide science grade 4 scorePrimary enrollmentUnitWeight2011Secondary Education (9th)Math grade 8 levelStatewide science grade 8 scoreValue10-yr trend202125%33.048.5US CountiesDecile2011202110SEDAgrade level1.56.606.649NAEPscale score,0-5001.0136.6142.810English, language and arts grade 8 levelSEDAgrade level1.56.437.2210High school graduation rateCHRpercentage1.064.687.897 Community college graduation rateCensuspercentage1.096.697.156Secondary enrollmentSourceUnitUnit2011Adult Skills (7th)Value10-yr trend202133.135.3US CountiesDecile2011202125%34.540.177Adult population with at least a high schooldiplomaCensuspercentage1.077.580.089Adult population with bachelor's degree orhigherCensuspercentage1.018.421.055* The 1,196 counties in the 12 states have been grouped into deciles, for each pillar, element and indicator. Counties in the 1st decile are the strongest performers and those in the 10th decile are the weakest201120211010grade level2.02.902.53910NAEPscale score,0-3001.5136.3140.51010SEDAgrade it9 Tertiary Education (2nd)Statewide university quality for enrolled9students202120%Weight201110 Statewide college graduation rate10-yr trendSEDASource9 College enrollmentUS CountiesDecileValueWeight2011English, language and arts grade 4 levelSourceUnit20215%1.0SourceValue10-yr trend2021US stitute score1.00.3280.30932percentage1.042.534.528QS RankNCESSourceUnitWeight2011#N/AValue10-yr trend2021US CountiesDecile20112021#N/A ## ##
San Bernardino, CA: Natural Environment (1st decile*): Element and indicator scoresItalics: Indicator contains imputed valuesSourceUnit2011Emissions (1st)US CountiesDecileValueWeight10-yr trend20212011Source201125%63.763.911 Exposure to Air Pollution (7th)EPA2.01.000.7114 Life expectancy loss from air pollutionJBENNitrous oxide emissionsEPAindex,0-10.50.730.8522 PM2.5 emissionsCarbon monoxide emissionsEPAindex,0-10.50.780.9311 Lead emissionsSulfur dioxide emissionsEPAindex,0-10.50.9440.96222 Toxic air releasesOzone 2011Forest, Land and Soil (5th)Toxic land releasesStatewide rural parks and wildlife areasStatewide compliant underground storagetanks facilitiesEPAUSDAlb / square milepercentageValue10-yr trend2021US CountiesDecile201120210.299EPAton / square mile1.00.980.4331EPAlb / square mile1.00.3910.36089EPAlb / square mile1.024.1310.126614.9022.3399 Statewide good quality rivers and streamsEPA1Statewide good quality lakes, resevoirs and1pondsEPA60.058 Total freshwater withdrawals per capitaStatewide exposure to pesticidesCDC1.027.024.212 Toxic water releasesTree canopy e1.00.00.01010Unit2011Preservation Efforts (1st)0.21.070.0Unit2.0Value10-yr trend2021Unit5 Freshwater (7th)1.0Sourceyears3number /100,000populationWetlands and deepwater habitats7Weight2011percentageUS wide GAP 1 protected areasUSGSpercentage2.015.915.911Statewide GAP 2 protected areasUSGSpercentage1.56.56.511Statewide GAP 3 protected areasUSGSpercentage1.028.428.411* The 1,196 counties in the 12 states have been grouped into deciles, for each pillar, element and indicator. Counties in the 1st decile are the strongest performers and those in the 10th decile are the weakestValue10-yr trend2021US .810.81010percentage0.52.22.21010million gallons /1,000 population1.00.310.2154lb / square 1160.147.918.73202155.150.218.9310-yr trend25%20%1.0US CountiesDecileValueWeight2021index,0-1CO2 emissionsUnit#N/AValue10-yr trend2021US CountiesDecile20112021#N/A ## ##
GlossarySource CodeSource NCSCPICPSCuillierDOLDUH Nat HUDICSIMHEInst CESNCIRDNCSLNIEERNIMPNLCDNSCHNVCAPOLPros NowPRRIQS RankQuantGovSEDASPLCState ORTalk PovTax ation of American RailroadsAmerican Civil Liberties UnionAmerican National Election StudiesAmerican Tort Reform AssociationBallotpediaBroadbandNowUnited States Bureau of Economic AnalysisBrookings Institution Export MonitorUnited States Bureau of Justice StatisticsUnited States Bureau of Labour StatisticsBehavioral Risk Factor Surveillance SystemUnited States Bureau of Transportation StatisticsCato - Freedom in the 50 StatesCenter for American Women and PoliticsCenters for Disease Control and PreventionCDC National Environmental Public Health Tracking NetworkCenters for Disease Control and Prevention - Diabetes AtlasCenter for Disease Control (WONDER)United States Census BureauUS Census BureauUnited States Census Bureau, American Community SurveyCounty Health RankingsCensus of Juveniles in Residential PlacementCorporation for National and Community Service, Volunteering & Civil Life in AmericaCenter for Public IntegrityCurrent Population Survey, Civic Engagement SupplementDave CuillierUnited States Department of LaborSubstance Abuse and Mental Health Services Administration, The National Survey on Drug Use and HealthUnited States Energy Information AdministrationUnited States Environmental Protection AgencyFeeding AmericaFederal Communications CommissionFederal Deposit Insurance CorporationFraser InstituteFederal ReserveFederal Trade Commission, Consumer Sentinel NetworkGallupGoogle TrendsGlobal Terrorism DatabaseGun Violence ArchiveHospital Consumer Assessment of Healthcare Providers and SystemsHenry J Kaiser Family FoundationUnited States Department of Housing and Urban DevelopmentInstitute for Corruption StudiesInstitute for Health Metrics and EvaluationInstitute for JusticeBennett et al. 2019. "Particulate matter air pollution and national and county life expectancy loss in the USA: A spatiotemporal analysis".Kauffman FoundationMovement Advancement ProjectMIT E
San Bernardino, CA (6th decile*): Pillar and element scores Overall Prosperity US Counties Decile CA RankOverall Prosperity 2011 10-yr trend 2021 2021 10-yr decile chng. 2021 2011 10-yr trend 2021 2021 10-yr decile chng. 2021 48.8 42.8 10 1 48 53.0 58.7 5 - 6 Mass Killings and Injuries 15% 100.0 70.9 10 9 54 Agency 30% 35.8 56.8 6 4 1