Transcription
N A S A T E C H N I C A L NOTE-NASA TN D-4938cc* I00m04Pn4c/)4zLOAN COPY: RETURN Ti::AFWL (WLIL-2)KIRTLAND AFB, N MEXRESONANCEINTEGRALS OF RHENIUMFOR A WIDERANGE OF SAMPLESIZESby Clarence R . Pierce, D o n a l d F. Shook,and Donald BogartLewis Research CenterClevelmd,Ohio
TECH LIBRARY KAFB, NM. - 01321b0NASA TN D-4938RESONANCE INTEGRALS OF RHENIUM FOR A WIDERANGE O F S A M P L E S I Z E SBy C l a r e n c e R . Pierce, Donald F. Shook, and Donald BogartLewis Research CenterCleveland, OhioNATIONAL AERONAUTICS AND SPACE ADMINISTRATION For sale by the Clearinghouse for Federal Scientific and Technical InformationSpringfield, Virginia 22151CFSTI price 3.00-
ABSTRACTResonance integmls were measured f o r la5Re, la7Re, and natural rhenium for foiland film ationandofreactivity methods. The thinnest samples yielded dilute resonance integral values1790*60, 323 20, and 866*35 b a r n s for l a 5 R e , 187Re, and natural rhenium, respectively.Resonance integrals calculated for the range of sample size using recently measuredresonance parameters to 100 electron volts werefound to be lower than the measuredvalues by about 10 percent.ii
RESONANCE INTEGRALS OF RHENIUM FOR A WIDERANGE OF SAMPLE SIZESby Clarence R. Pierce, Donald F. Shook, and Donald BogartLewis Research CenterSUMMARYResonance absorption integrals were measured f o r the isotopes rhenium-185, andrhenium-187, and f o r natural rhenium using both reactivity and activation 12centimeterwereused.Themeasured dilute resonance absorption integrals are 1790*60, 323*20, and 866*35 barnsfor 185Re, 187Re, and natural rhenium, respectively.Resonance absorption integrals were calculated for the 185Re and 187Re isotopesand for natural rheniumfor the range of sample sizes using a code based on the Nordheimmethod. The calculated resonance integrals were about 10 percent lower than themeasured values. Likely causes for the lower calculated valuesare (1) an underestimation of the unresolved resonance contribution for 187Re which is based on statisticsobtained for resonance levels to 100 electron volts only, and (2) a possibly low value forthe measured neutron width of the 2.16-electron-volt resonance of 185Re the contribution of which dominates the resonance integral.INTRODUCTIONRhenium has received attention as a possible alloy material in the construction ofhigh temperature fast reactors, and therefore the nuclear parameters are of interest.The resonance absorption integrals of the naturally occurring rhenium isotopes and ofnatural rhenium are considered in this report. For very thin samples exposed to aneutron flux which varies inversely with neutron energyE the resonance integral isthe well-known dilute resonance integral I,:dEE
where ac(E) is the microscopic capture cross section, andECd is the cadmium cutoffenergy. The measurements reported here are corrected to a sharp cutoff energy at0. 5 electron volt. For thick samples equation (1) is not applicable and an effectiveresonance iqtegral that depends on the square root of the surface area to mass ratio(S/M)1/2 of the sample is measured. The effective resonance integralis a function ofthe capture cross section and of the self-shielded neutron flux in the finite sample.Published resonance parameters have been used to calculate effective resonance integralsfor rhenium-185, rhenium-187, and for natural rhenium using the Z U T code based on theNordheim integral method (ref. 1). In the calculation using ZUT, the assumptionismade that the flux varies inversely with energy in the resonance region in the absenceofthe sample; for the resolved resonance region, the calculation using ZUT yields theresonance integral contribution for each resonance with the assumption of flux recoverybetween resonances. It is also assumed that there is no resonance overlap of theisotopes present in the natural metal sample. These assumptions appear to be valid forthe low energy resonances of rhenium. For the unresolved resonance region of energy,a separate code TUZ is used (ref. l ) j which makes use of s-wave statistics.SYMBOLSAadjustment factor for difference in fluxeswith and without cadmiumshieldBsaturated count rate for bare sampleCsaturated count rate for cadmium shielded sampleCproportionality constant for use in determining resonance integrals fromreactivity coefficientsDlevel spacing, eVEneutron energy, eVcadmium cutoff energy, eVneutron resonance energy,eVneutron energy at lowest energy resonance, eVstatistical factoreffective resonance integral, bcalcIeff2total calculated resonance integral for0. 5-eV cutoff, b
calculated contribution to resonance integral from resonances inlethargy group, b'1,dilute resonance integral, bAK/NVKreactivity coefficient for resonance absorberMmass of sample, gRcadmium ratioSsurface area of sample, cm 2Ulethargyn'neutron scattering width, mVrOnreduced neutron width, mV'YEneutron capture width,ithmVcounting efficiencyadjustment factor for difference of flux and cutoff energy from definedvaluescapture cross section, bcapture cross section at 0.0253 eV, bcalculated flux per unit lethargycalculated adjoint per unit lethargySubscripts and superscripts:without cadmium shieldwith cadmium shieldindex running from 0 to infinityindex running from 0.41 to infinitystandard sampleisotope under investigationMETHODS OF MEASUREMENTThe reactivity and activation methodsof measurement used here have been usedpreviously and are discussed in detail in references 2 and 3. A uranyl fluoride solution3
. . . . . .reactor with centrally located cadmium covered samples is used to measure relativereactivities. The reactivity measurements yield effective resonance integrals using thefollowing relation:where AK/NVK is the reactivity coefficient for the resonance absorber. The constantof proportionality c onance integrals, is determined by reference to gold as a standard. Reactivity coefficients for gold have been obtained for a wide range of sample sizes and these wereused inreference 2 toobtaintheconstantc 10.0*0.5milsperatom-barn.Thebracketed term is the calculated multigroup importance correction factor for perturbations to the inverse energy neutron flux caused by the cadmium cover, Ieff is lt,is the calculated contribution to the resonance integral from resonances in the ith lethargy group, andandare the calculated flux and adjoint per unit lethargy. The lethargy( ( P ) @): igroups denoted by i cover the energy range from 0 to 107 electron volts.For the activation measurements,where the superscript x represents the isotope under investigation, s represents thestandard sample, 0th is the radiative absorption cross section at 0.0253 electron volt,andR is the cadmium ratioB-where C is the saturated count rate for the cadmium shielded sample, B is the saturated count rate for the bare sample, and cC and E b are the respective counting efficiencies. Also,4
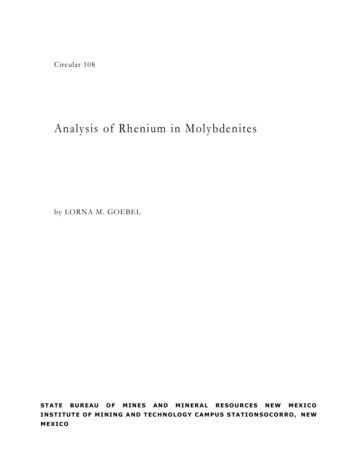
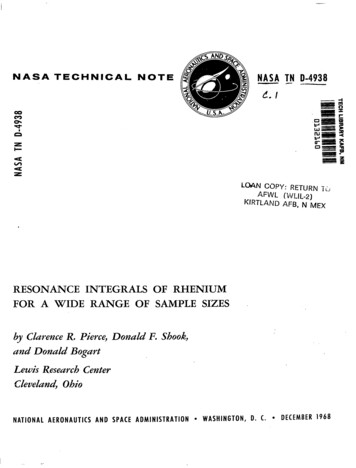
u Icalcef fwhere (qb)j is the calculated flux without the cadmium shield and the indexj coversthe energy range from 10 to70.41 electron volt (lethargy0 to 17). Rhenium cross sections at 0.0253 electron volt have been measured with good precision (ref. 4) and arereported to be 114*3 barns for 185Re and 7 5 4 barns for 187Re. A corresponding crosssection value of 98.7rtl. 8 barns is used for gold (ref. 5). For thick samples, the samplethickness is chosen s o as to ensure that the flux depression at 0.0253 electron voltproduced by the gold standard is the same as that produced by the sample to be measured.Natural rhenium metal samples were used throughout. The reactivity method yieldedresonance integrals for natural rhenium but for reasons of accuracy, were limited tothicker samples of (S/M)1/2 smaller than 4 centimeters per gram1I2. The activationmethod was used to obtain resonance integrals for the individual rhenium isotopes.Toavoid uncertainties due to bremsstrahlung contributions to the gamma activity, thesamples used for activation were thinner than 0 . 4 gram per square centimeter. Theresonance integrals for the separate isotopes were converted to elemental values byusing the isotopic abundance ratios (37.07 percent for 185Re and 62.93 percent for 187Re).The reactivity and activation methods together provide resonance integrals over a widerange of sample size.EXPERIMENTThe NASA ZPR- 1, an unreflected solution reactor, was used for both the reactivityand activation experiments. The reactor is shown in figure 1 and is described in detailin reference 2. The fuel solution consisted of 93.3-percent enriched uranium-235 asuranyl fluoride in water. The fuel. solution concentrationwas 7 percent by weight ofuranyl fluoride with a hydrogen to uranium-235 atom ratio of about 500. Criticality wasachieved by increasing the height of the fuel solution in the reactor vesselby smallincrements. The reactor was controlled entirely by variation of the solution height.5
Solution heightmeasuring deviceSafety rod/-Reactor vessel(30.5-cm id)Cadmium covered sample in plastic container- Solution dump line- Solution fill lineFigure 1.6- Samples in reactor vessel.
Reactivity measurements and activations were madeby suspending the samples at thecenter of the reactor vessel in the wire sample holder shown in figure 1. The sampleswere separated from the fuel solutionby a cylindrical methacrylate plastic box with a0.25-centimeter wall thickness. For the reactivity measurements and the epithermalactivations, the samples were within a 0.89-millimeter-wall cadmium cover in themethyl methacrylate box. The maximum container size used was 6.3 centimeters indiameter and 1.6 centimeters in height.With the largest cadmium cover in place, thecritical solution height was about 52 centimeters; without the cadmium cover, the heightwas about 46 centimeters. Solution height changes could be measured to *O. 2 mil( * 5 1 0 -cm) using the micrometer lead screw height measuring device shown in figure 1.The reactivity of a sample at the center of the core was determined as the differencebetween critical height A H for sample in and sample out conditions. After severalexperiments were performed with different samples, the critical height with the sampleholder and empty cadmium cover was redetermined to a s s u r e that reference reactorconditions were maintained. A reference critical solution height of 45.720 centimetersat a reference solution temperature of 21.1' C was maintained.Sample Preparation and Counting Techniques3The thin samples were prepared by vacuum depositing the metal on 2 . 5 1 0 - centimeter-thick aluminum. Five rhenium and two gold samples were prepared this way.The amount deposited was determined by weighing the aluminum foil before and afterdeposition. E r r o r s in weights are estimated to be less than 10 percent. Since the samesamples were used for the cadmium shielded as for the bare activations, errors inweight for these thin s a m p l e s a r e not very important. The thick samples were 5.08centimeter-diameter disks cut from rhenium sheet metal and from gold sheet metal.The sample counting technique for the activation measurement was determined by thedecay modes of the isotopes. The half lives and decay modes of the neutron activatedrhenium isotopes are given in references 6 and 7. Because y-rays are emitted with muchlower intensity than /?-rays, the thinnest samples were beta counted using a windowless277 proportional gas flow counter. The plateau was checked at regular intervals, andcount rates were monitored using a depleted uranium sample.Beta detection efficiency can be a problem for thicker samples because eC will notbe equal to E b (eq. (4)), although the same sample is used for both bare and cadmiumshielded activations. This efficiency difference is the result of neutron self-absorptionin the sample (ref. 3). For this reason, the thicker samples were gamma counted, usinga NaI (TZ) scintillation crystal and a single channel analyzer. The rhenium samples7
were counted over the energy range 0.4 to 1.0 MeV, which included y-ra s accountingfor 0.07 percent of the decays of 186Re and 5 percent of the decays for &' e.Thegold samples were counted over the energy range 0.3 to 0.9 MeV. The counting rangefor rhenium was chosen because the lower energy gamma rays, although of higherintensity, were attenuated significantly due to self-absorption, and they would haveintroduced an efficiency uncertainty in the results. Bremsstrahlung, producedby passage of the high energy beta particles through the sample, can be significant in the energyrange counted. For this reason, the maximum sample thickness was 0.013 centimeterfor the activation measurement.2. I2. 22. 01.8-391. 6.40r".-c6-m01.4Eccu"1. 2-A-39x-1. 03--I2w5.81V.6.41.20Lethargy1244xx1l d0 6450(a) Fluxandadjointfluxwithcadmium cover.Figure 2.88.3 . 4 1Energy, eV22.603.06.41(b) Magnificationoffluxbelow 22.60 electron volts.- NASA 2PR-1 central flux and central adjoint flux
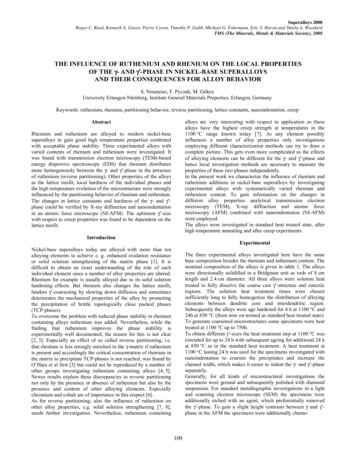
METHOD OF CALCULATIONThe calculated scalar and adjoint flux per unit lethargy within the cadmium cover atthe center of the reactor are shown in figure 2. The calculations were made using themethod described in reference 8. It can be seen that ( u ) the, f l u per unit lethargy,varies slowly with lethargy over the resolved resonance region.Although p*(u), theadjoint function, is constant over much of the resonance region, it declines rapidly tozero from about 3 to 0.41 electron volt because of the cadmium cover.TABLE I.NeutronenergyrangeeV- IMPORTANCE WEIGHTEDrINTEGRAL OF NATURAL RHENIUMProductSample s i z e , ( s / M ) / , cmf lux9.870.9873 12andadjoint Effective Flux-and. Effectivt Flux-and- Effective Flux-andadjointadjointresonancresonance adjointresonanceweighted integralintegral,weightedweighted effeffef fintegral,integralintegral,IcalcIcalcIcalceffef feff0.41 to 0.930.480. 50 to 0.93""0.93 to 3.293.29 to 6.556. 55 to 11. 511.5 to 33.233.2 to 100.0100 to 200200 to 800800 to 16001600 to 3200.961.001.021.071.071.101.141.171.19a15. 611.5350.527.937.757.164.629.630. 36.94.0Higherenergy1.346. 5TotalEFFECTIVE RESONANCE""-. .Importance corFectionfactora9. 4.58.14.88.76.48.66.28.3629.0358.7366.9159.2166.3. 0"7.5""40.89.19.520.123.916.422.76.74.3 1.021.04!Not included in total.9I".
TABLE II. - NEUTRONRESONANCE PARAmTERS FORRHENIUM-185 (ref. 4)(a) Resolved resonance mrametersResonance energy,Scattering widthb ,Eo, 774.781.087.289.193.495.698.83.3*0. .84*0.150.42*0.020.70*0.030.56rt0.0160.60rt0.0236. rt8.0.94rt0.0411.54.40.65rtO. 030.81rt0.0815.7rtO. 734. *6.7.8*0. 320. *2.4.6*0. 510.3rtO. 510.0*3.05.9rt1.47. rt2.1.2io. 21. 5rtO. 55. rtl.13. *7.(b) s-Wave statisticsAverage capture Average reduced Average level Statisticaineutron width,width,factor,spacing,( rJ ,(D),g( Q ,mVmVeVI53I1.0312.9I0.5aValues in parentheses are (r ). This value was used forYrY is not reported.thoseresonanceswherebStatistical spin factor is taken to be 0. 5.10
TABLE ID. - NEUTRON RESONANCE PARAMETERS FORRHENIUM-187 (ref. 4)- (a) Resolved resonance parameters Resonance energy,Eo, eVCapture widtha,rY' mVScattering widthb51*26 3*659*957*560rt10(54)71*751rt1455*2( 54)( 54)57*6( 54)61rt6(54)6 3*649*463rt15(54)79*5065rt12(54)(54)0.375rtO. 0042.08*0.080.660 0.0142.05rtO. 040.69*0.030.131rt0.01010. o*o. 41.12rtO. 0412.4*0. 50.10*0.015. rtl.6.1rt0.32.1rt0.329. rt5.2.2rto. 3\26. 3.70.41.29. *lo.1.6rt0.22.8*0.29.3*0.77. *2.1.8*0.6rn,mV 4.4211.1416.0717. 5818. 5224.832.033.939.446.947.553. 558.961.063.769. 573.775.078.179.185.187.6091.80 (b) s-Wave statisticsAverage capturewidth,( r Y,)mV Average reduced Average level Statisticalneutron width,factor,spacing,(r;)(D),geVmVI9I 541.300.53.0aValues in parentheses are (r ). This value was used forYthoseresonanceswhereis not reported.YbStatistical factor is taken to be 0.5.11
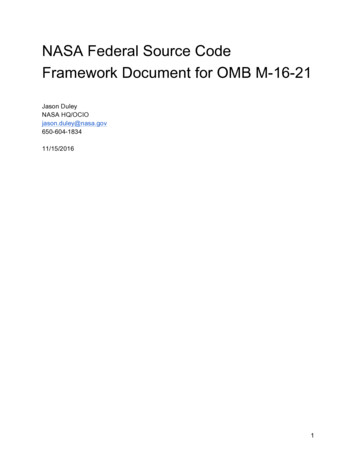
The method of calculating the importance correction factor (eq. (2)) is discussed inreference 2. The importance weighted effective resonance integrals of natural rheniumare shown in table I for three sample sizes. The sample size is expressed in t e r m s of(S/M)1/2 ((surface area (cm2)/sample mass (g))1/2). The contribution to the resonanceintegral for energies below 3/7Eb where EL is the neutron energy at resonance maximum for the lowest energy resonance were calculated using the low energy cross sectionsof reference 4 and numerical integration. Contributions for the resolved regionwerecalculated using the resonance integral code ZUT (ref. 1) discussed previously. Forrhenium, the ZUT code sets the lower energy limit of 3/7Eb. Contributions for the"unresolved" regions were obtained using the TUZ code described in reference 1; f o rhigher energies, the average cross sections of references 4 and 9 were numericallyintegrated. For the purpose of present calculations, the energy region where parametersfor resolved resonances have not been measured ( lo0 eV) is treated as unresolved.Neutron resonance parameters used in the calculation are listed in tables II and 111and are obtained from reference 4. Statistical spin factors for the more importantresonances may be obtained from reference 10; however, no significant e r r o r isintroduced by taking the factors to be 0.5 for these resonances.The flux correction factors A and p (eq. (7)) f o r the activation experiment areobtained by the same method as that used f o r calculating the importance correctionfactor.The calculated flux (ob(u) for the bare sample irradiations is shown in figure 2(b).The flux is significantli different from the flux within the cadmium cover rpc(u) betweenabout 3 and 0.41 electron volt. Above 3 electron volts, there is no significant differencebetween (oc(u) and (ob(u).A correction for non- l/v variation of the cross section below 0.41 electron voltwas obtained by using a Maxwellian distribution for the thermalflux and the crosssections of reference 4. This correction resulted in a 4-percent reduction in the 187Reresonance integral and a 2-percent increase in the 185Re resonance integral.RESULTS AND DISCUSSIONThe activation and reactivity resonance integral values for natural rhenium,185Re,and 187Re a r e shown in tables IV(a), (b), and (c), respectively. The dilute valuesshownin the tables are the average of the values obtained for the samples with (S/M) 1/2greater than 100 centimeters per gram1j2. The measurements throughout this range ofvalues of (S/M)1/2 show no change in the resonance integral beyond the e r r o r l i m i t s ,as shown in figure 3. The dilute value may be compared with dilute values obtained by12
TABLE N. - MEASURED RESONANCEINTEGRALS(a) Natural rheniumSample thickness,mg/cm2Sample size,(S/M)1/2 1 5b241 15b172 10b120*5(b) Activation data for rhenium-185Isotopic sample size,(S/M)1/21/2'cm/gResonance integral,bDilute8.654.481790*60960rt40628530(c) Activation data for 323rt20260520220520aActivation data.bReactivity data.13
others (refer to table V). Most of the published values, when adjusted to correspond tothe gold resonance integral and thermal cross section values used here, agreewithinthe stated error limitsof the present experiments.The resonance integral values shown in table N are compared with calculatedresonance integrals. Table VI shows the calculated resonance integral contribution fortwo sample sizes of 187Re and 185Re from four energy groups. The first group extendsfrom the cutoff energy of 0.5 electron volt to the energy at which the resolved resonancecalculation begins. The second group is covered by the resolved resonance calculation.For the third group the resonance parameters are unknown, and the contribution is duealmost exclusively to s-wave neutrons. For the f i n a l group p-wave and higher z -waveneutrons also contribute to the resonance integral.TABLE V.- SUMMARY OF EXPE-NTALVALUES O FRHENIUM RESONANCE od m-18516 50rt901753*901061*212b19411790*6011111413Two spectrum1565Cadmium ratio1565Cadmium ratioActivation1558Cadmium ratio This work""-"""114""""93""15751660 901764*90101 t40323rt201114This workCadmium ratioCadmium ratioCadmium ratio1565" """93157575310*2075.3304*401337323*2098.7Natural 11111214workTwo spectrumCadmium ratio15651565156515581337Capture gammaCadmium ratioCadmium ratioCadmium ratio This"""""8589""""""93157598.7810*40848 50862 65723*125687rt117866*35aCorrected for resonance integral and thermal cross section usedin this work.E r r o r l i m i t s a r e not adjusted.bError limits not reported.'Value obtained by combining isotopic resonance integrals.149684
TABLEVI. - CALCULATED RESONANCE INTEGRALCONTRIBUTION FOR RHENIUM(a) Sample size, (S/M)1/2 312 cm/g1/2Neutron energyEffective resonancegroup,eVintegral, . . Neutron energy Effective resonancegroup,eVb Rhenium-187 .Irintegral,bRhenium- 18 5 0.50 to 3.639494 to 3000Above 3000179 3.6 to797Total2800.50 to 0.930.9 to 100.0100 t o 3200Total15211592678 Above 32001688 (b) Sample size, (S/M)1/2 3.12 nium-1870.50 to 3.633.6 to 9494 to 3000Above 3000ITotal0.50 to 0.930.9 to 100.0100 to 3200Above 320019111TotalI430ITable VI shows that the unresolved contribution accounts for 28 percent of theresonanceintegral of 187Re for a (S/M)l12 312ofcentimetersperand35 percent for a (S/M)ll2 of 3.12 centimeters per gram112. The correspondingunresolved contributions for 185Re are 4 and 13 percent, which are much lower than thevalues for 187Re because of the large 185Re resonance at 2.16 electron volts. Since187Re constitutes 63 percent of natural rhenium, the unresolved resonances make asignificant contribution to the resonance integral of natural rhenium. It would greatlyimprove the accuracy of the calculation if the resolved resonance region could beextended to a higher energy than the 100 electron volts reported in reference 4.Figure 3 shows the resonance integrals as functions of sample size (S/M)l12. Ifthe computer codes are used with resonance parameters and s-wave statistics as shownin tables II and ILI, the curves shown by the solid lines in figure 3 result. These calculated values show agreement with the measured valueswithin the estimated error limits,15
loo0 T600 400 -"Reactivity dataActivation dataCalculation based onreported resonanceparametersCalculation using perturbedparametersresonance6040.cL20Sample size, (s/MP*, (crnz/g)lQFigure 3. -Effective resonance integrals for natural rhenium and containedrhenium-185 and rhenium-187.which indicates that the major contributions to the resonance integrals have been calculated correctly.It may be noted, however, that the measured values all lie about 10 percent abovethe calculated curves. This could be accounted for if there were a number of ratherlarge levels lying just above 100 electron volts, the energy to which the resonancep a r a m e t e r s a r e known (ref. 4). It has been pointed out (ref. 4) that the strength functionfor natural rhenium obtained from the resolved resonance parameters is lower than thevalue obtained from fitting average cross section measurementsin the kilovolt range;therefore, the average neutron width for s-wave levels may be larger than thatobtainedfrom the resolved data to 100 electron volts.To explore likely sources of the differences between measurement and calculation,the calculations were performed using several values for the input parameters. It wasfound that values for the resolved resonance parameters of 187Re would have to beincreased by an amount greater than the uncertainties inthe measured values toachieve agreement for this isotope. In view of this, the unresolved calculation wasredone for 187Re using the values for the s-wave statistics given previously, but with(I?:) 2 . 2 millivolts rather than 1.30 millivolts (see table IIT(b)). This value yieldedthe best agreement with the experimental data, and it gives a strength function valueof 3 . 7 1 0 -electron volt compared to the value of 2 . 3 1 0 electron volt obtained fromthe resolved resonances (ref. 4).It should be noted that an equivalent increase in the16
unresolved resonance integral contribution for 187Re could be accounted forby a fewlarge resonances just above 100 electron volts, the present resolved region upper limit.Therefore, this calculation does not provide conclusive evidence for an increasedaverage reduced neutron width for187Re.For i85Re, (p)n would have to be about 5 instead of 1 millivolt (table 111) to yieldagreement with the present experimental data. This value is much larger than isrequired to f i t the measured average cross sections in the kilovolt region. On the otherhand, the total resonance integral of 185Re is sensitive to the value of 2grn used forthe important 2.16-electron-volt resonance.If this value is increased from 3.3 to only3.5 millivolts, which is within the stated uncertainties in the measured value, and(r",)is increased to 2.0 millivolts, agreement is obtained between calculated and experimentalresonance integrals. The valueof 2grn for the 2.16-e1ectron-vo1ts resonance suggestedhere has a large uncertainty, since it includes both the uncertainty in the measuredresonance integral, and also the uncertainty in value of (I?:) taken for 185Re.CONCLUSIONSThe resonance integrals of 187Re, 185Re, and natural rhenium have been measuredfor a wide range of sample size and compared with calculated values. Agreement iswithin stated error limits. All measured values, however, lie about10 percent above thecalculated values for both 185Re and 187Re. A number of sources for the difference arepossible. One likely source of the difference for 18'Re is the large unresolved resonancecontribution to the calculated integral. The indicationis that the average reduced neutronwidth is larger than the value obtained from the analyzed resonances below 100 electronvolts. In the case of 185Re, the major portion of the resonance integral for both thin andthick samples is supplied by the lowest positive energy resonance, and the total resonanceintegral is insensitive to the value for the reduced neutron width. One way to account forthe discrepancy forthis isotope is by increasing the neutron width for this resonance.The discrepancy for 185Re can be accounted for if the value of rn for the importantlowest positive energy resonance of 185Re at 2.16 electron volts is chosen to be 3.5 millivolts, which is slightly larger than the measured value of 3.3*0.3 millivolts reported.Lewis Research Center,National Aeronautics and Space Administration,Cleveland, Ohio,August30,1968,129-02-04-03-22.17
R FERENCES1. Kuncir, G . F. : A Program for the Calculation of Resonance Integrals.Rep.GA-2525, General Atomic Div. , General Dynamics Corp. , Aug. 28, 1961.2. Shook, Donald F. ; and Bogart, Donald: Effective Resonance Integrals of SeparatedTungsten Isotopes from Reactivity Measurements. Nucl. Sci.Eng. , vol. 31, no. 3,Mar.1968, pp. 415-430.3. Pierce, Clarence R. ;and Shook, Donald F. : Determination of Dilute 186W and 184wResonanceIntegrals byActivation.pp. 431-439.Nucl. Sci. Eng., vol.31,no. 3,Mar.1968,4. Friesenhahn, S. J. ; Gibbs, D. A. ; Haddad, E. ; Fr'dhner, F. H. ;and Lopez, W. M. :Neutron Capture Cross Sections and Resonance Parameters of Rhenium from 0.01 eVto 30 keV. J. Nucl. Energy, vol. 22, no. 4,Apr.1968,pp. 191-210.5. Friesenhahn, S. J. ; Haddad, E. ; Fr'dhner, F. H. ; and Lopez, W. M. : The NeutronCapture Cross Section of the Tungsten Isotopes From 0.01 to 10 Electron Volts.Nucl. Sci.Eng. , vol.26, no. 4, Dec.1966, pp. 487-499.6. Gove, N. B.: A 186-Ta7 W, Re, O s , Ir, Pt, Au, Hg. Nucl. Data,Sec.no. 2, June 1966, pp. B1-2-1 to B1-2-22.B, vol. 1,7. Ewbank, W. B. : A 187-W, Re, Os, Ir, Pt, Au, Hg. Nucl. Data,Sec.B,no. 2, June 1966, pp. B1-2-23 to B1-2-52.vol. 1,8. Fieno, Daniel: Transport Study of the Real and Adjoint Flux for NASA Zero PowerReactor(ZPR-I). NASA TND-3990,1967.9. Stupegia, D. C. ; Schmidt, M. ; and Madson, A. A. : Fast Neutron Capture in Rhenium.J. Nucl. Energy, Parts A/B, vol. 19, no. 10, 1965, pp. 767-773.10. Stolovy, A . : Spin Determinations of Neutron Resonances in Sb, Ta, Re, and Ir, UsingIron-alloyTargets.Phys.Rev. , vol.155, no. 4,Mar.20,1967,pp. 1330-1333.11. Sher, R. ; LeSage, L. ; Connolly, T. J. ; and Brown, H. L. : The Resonance Integralsof Rhenium and Tungsten. Trans. Am.Nucl. SOC., vol. 9, no. 1, June1966,pp. 248-249.12. Karam, R. A. ; and Parkinson, T. F. : The Resonance Absorption Integral of RheniumProceedings of the conference on Neutron C r o s s Section Technology. P. B.Hemmig, ed. AEC Rep. CONF-660303, bk. 1, 1966,p.171.18
13. Brown, H. L. , Jr. ; Connolly, T. J. ; and Foell, W. K. : Effective Resonance Integralsand Interference Between Resonances of Indium-115, Gold, and Rhenium-185.Trans. Am.Nucl. SOC., vol.5, no. 2, Nov. 1962, pp. 375-376.14. Harris, S. P. ; Muehlhause, C . 0.; and Thomas, G. E. : Low Energy NeutronResonance Scattering and Absorption. Phys.Rev. , vol.79, no. 1, July 1, 1950,pp. 11-18.NASA-Langley, 1968-- 24 E-436119
RESONANCE INTEGRALS OF RHENIUM FOR A WIDE RANGE OF SAMPLE SIZES by Clarence R. Pierce, Donald F. Shook, and Donald Bogart Lewis Research Center SUMMARY Resonance absorption integrals were measured for the isotopes rhenium-185, and rhenium-187, and for natural rhenium using both reactivity and activation methods. Natural rhenium foil thicknesses from about to 0.12 centimeter were used.