Transcription
Superalloys 2008Roger C. Reed, Kenneth A. Green, Pierre Caron, Timothy P. Gabb, Michael G. Fahrmann, Eric S. Huron and Shiela A. WoodardTMS (The Minerals, Metals & Materials Society), 2008THE INFLUENCE OF RUTHENIUM AND RHENIUM ON THE LOCAL PROPERTIESOF THE γ- AND γ′-PHASE IN NICKEL-BASE SUPERALLOYSAND THEIR CONSEQUENCES FOR ALLOY BEHAVIORS. Neumeier, F. Pyczak, M. GökenUniversity Erlangen-Nürnberg, Institute General Materials Properties, Erlangen, GermanyKeywords: ruthenium, rhenium, partitioning behavior, reverse partitioning, lattice constants, nanoindentation, creepalloys are very interesting with respect to application as thesealloys have the highest creep strength at temperatures in the1100 C range known today [7]. As any element possiblyinfluences a number of alloy properties only investigationsemploying different characterization methods can try to draw acomplete picture. This gets even more complicated as the effectsof alloying elements can be different for the γ- and γ′-phase andhence local investigation methods are necessary to measure theproperties of these two phases independently.In the present work we characterize the influence of rhenium andruthenium additions in nickel-base superalloys by investigatingexperimental alloys with systematically varied rhenium andruthenium content. To gain information on the changes indifferent alloy properties analytical transmission electronmicroscopy (TEM), X-ray diffraction and atomic forcemicroscopy (AFM) combined with nanoindentation (NI-AFM)were employed.The alloys were investigated in standard heat treated state, afterhigh temperature annealing and after creep experiments.AbstractRhenium and ruthenium are alloyed to modern nickel-basesuperalloys to gain good high temperature properties combinedwith acceptable phase stability. Three experimental alloys withvaried contents of rhenium and ruthenium were investigated. Itwas found with transmission electron microscopy (TEM)-basedenergy dispersive spectroscopy (EDS) that rhenium distributesmore homogenously between the γ- and γ′-phase in the presenceof ruthenium (reverse partitioning). Other properties of the alloysas the lattice misfit, local hardness of the individual phases andthe high temperature evolution of the microstructure were stronglyinfluenced by the partitioning behavior of rhenium and ruthenium.The changes in lattice constants and hardness of the γ- and γ′phase could be verified by X-ray diffraction and nanoindentationin an atomic force microscope (NI-AFM). The optimum γ′-sizewith respect to creep properties was found to be dependent on thelattice misfit.IntroductionExperimentalNickel-base superalloys today are alloyed with more than tenalloying elements to achieve e. g. enhanced oxidation resistanceor solid solution strengthening of the matrix phase [1]. It isdifficult to obtain an exact understanding of the role of eachindividual element since a number of alloy properties are altered.Rhenium for example is usually alloyed due to its solid solutionhardening effects. But rhenium also changes the lattice misfit,hinders γ′-coarsening by slowing down diffusion and sometimesdeteriorates the mechanical properties of the alloy by promotingthe precipitation of brittle topologically close packed phases(TCP-phases).To overcome the problem with reduced phase stability in rheniumcontaining alloys ruthenium was added. Nevertheless, while thefinding that ruthenium improves the phase stability isexperimentally well documented, the reason for this is not clear[2, 3]. Especially an effect of so called reverse partitioning, i.e.that rhenium is less strongly enriched in the γ-matrix if rutheniumis present and accordingly the critical concentration of rhenium inthe matrix to precipitate TCP-phases is not reached, was found byO’Hara et al first [3] but could not be reproduced by a number ofother groups investigating ruthenium containing alloys [4, 5].Newer results explain these discrepancies in reverse partitioningnot only by the presence or absence of ruthenium but also by thepresence and content of other alloying elements. Especiallychromium and cobalt are of importance in this respect [6].As for reverse partitioning, also the influence of ruthenium onother alloy properties, e.g. solid solution strengthening [7, 8],needs further investigation. Nevertheless, ruthenium containingThe three experimental alloys investigated here have the samebase composition besides the rhenium and ruthenium content. Thenominal composition of the alloys is given in table 1. The alloyswere directionally solidified in a Bridgman unit as rods of 8 cmlength and 2.4 cm diameter. All three alloys were solution heattreated to fully dissolve the coarse cast γ′-structure and eutecticregions. The solution heat treatment times were chosensufficiently long to fully homogenize the distribution of alloyingelements between dendrite core and interdendritic region.Subsequently the alloys were age hardened for 4 h at 1100 C and24h at 850 C (from now on termed as standard heat treated state).To generate coarsened microstructures some specimens were heattreated at 1100 C up to 750h.To obtain different γ′-sizes the heat treatment step at 1100 C wasextended for up to 24 h with subsequent ageing for additional 24 hat 850 C as in the standard heat treatment. A heat treatment at1100 C lasting 24 h was used for the specimens investigated withnanoindentation to coarsen the precipitates and increase thechannel width, which makes it easier to indent the γ- and γ′-phaseseparately.Generally, for all kinds of microstructural investigations thespecimens were ground and subsequently polished with diamondsuspension. For standard metallographic investigations in a lightand scanning electron microscope (SEM) the specimens wereadditionally etched with an agent, which preferentially removedthe γ′-phase. To gain a slight height contrasts between γ and γ′phase in the AFM the specimens were additionally chemo-109
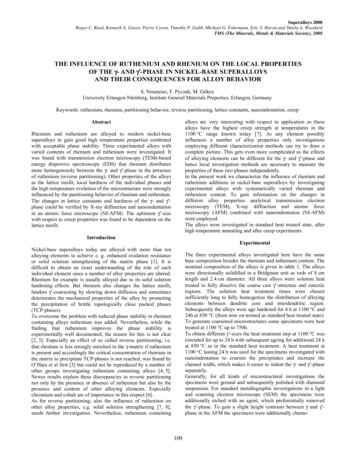
Table 1: Nominal composition of the three alloys investigated in this work.Element / wt.%AlTiCrCoMoTaReRuNiAlloy ReRu4.93.98.24.12.51.63.03.068.8Alloy Re4.93.98.24.12.51.63.00.071.8Alloy 04.93.98.24.12.51.60.00.074.8preparation to remove oxidized or chemically depleted zones. Allcreep tests were performed under compression at air withcylindrical specimens of 7.5 mm length and 5 mm diameter. Thetemperature at the specimen surface was controlled by athermocouple with an accuracy of /- 3 K. The test temperaturewas 1100 C and a stress of 137 MPa was applied. Extendedageing heat treatments were also performed in air at 1100 C forup to 750 h. To measure the distribution of alloying elementsbetween γ- and γ′-phase at high temperature by TEM/EDS asimilar procedure as already used by Hemmersmeier et al [12]was performed. These specimens were heated up to thetemperature of interest in the range between 1150 and 1300 Cheld for 60 minutes at this temperature and then quenched inwater by opening a shutter and allowing the specimens to falldirectly from the furnace chamber to a water bath to achieve highcooling rates. In this work the results obtained for a temperatureof 1150 C are shown and discussed.mechanically polished with nanodisperse SiO2 suspension in avibrational polishing machine. This preparation method leads to avery smooth specimen surface with a small height differencebetween the γ-matrix and the γ′- precipitates of only somenanometers. For specimens for X-ray investigations no γ′-phaseselective etching was performed. TEM-specimens wereelectrolytically thinned using an agent of perchloric and aceticacid in a mixing ration of 1:10.In the investigations a Jeol 6400 SEM and a Philips CM200TTEM with an EDAX-System for energy dispersive spectroscopy(EDS) was used. X-ray diffraction measurements were performedin a dual crystal diffraction setup with negligible instrumentalpeak broadening according to Wilkens and Eckert [9]. To derivethe lattice constants of the γ- and γ′-phase from the measured Xray profiles the measured peak profiles were split up in two orthree sub-profiles. This was done by combining up to threePseudo-Voigt peak profiles in such a way that the added intensityof the Pseudo Voigt profiles reassembled the measured overall Xray profile. The sub-profiles were identified as the contributionsof the γ′-phase and the γ-phase (in the matrix channelsperpendicular and parallel to the diffraction plane if three subprofiles were used to fit the overall X-ray profile). This was doneusing the XOP software package [10]. With this X-ray setup,lattice constants can be measured with an accuracy of about 0.0002 nm. The error in lattice misfit measurements is in theorder of 0.01 %.The nanoindentation investigations were performed at roomtemperature with a Triboscope force transducer from Hysitronmounted on a Veeco Instruments Multimode AFM (NI-AFM).For scanning as well as indentation a diamond tip with cubecorner geometry (a three-sided pyramidal indenter) was used. Inthe indentation measurements a maximum load of 250 µN wasapplied. This resulted in a maximum indentation depth of about45 nm. This ensured that both phases could be indentedseparately. AFM images of the three experimental alloysincluding nanoindents are shown in Fig. 1. The nanohardness of γand γ′ were calculated from the unloading part of the loaddisplacement curves recorded during indenting by using theOliver/Pharr method [11]. At least 10 indents for each phase wereevaluated.ResultsMicrostructureThe microstructures of the three alloys in the standard heat treatedcondition do not exhibit any TCP-phases. This phase stability isalso retained after ageing at 1100 C for up to 750 h.Nevertheless, the γ/γ′-microstructures encountered in the threealloys show strong differences. As visible in Fig. 2 the shape ofthe γ′-precipitates is rather globular in Alloy 0 while a more cubicshape is found in Alloy Re and Alloy ReRu exhibits near perfectγ′-cubes. The γ′-particle size is the highest in Alloy 0,intermediate in Alloy Re and the smallest in Alloy ReRu (see alsoFig. 3).Figure 2: TEM dark field images of the microstructureof a) Alloy 0, b) Alloy Re and c) Alloy ReRu.Microstructure Development during AnnealingFigure 1: AFM-micrographs with nanoindentsa) Alloy 0 b) Alloy Re and c) Alloy ReRu.The microstructure of the alloys was also investigated afterannealing. During short time annealing up to 24 h the γ′precipitates coarsen isotropically in all three alloys. Nevertheless,the rate of coarsening is different in the three alloys. Theevolution of the average precipitate size a is shown in Fig. 3,where (a/2)3 is plotted versus annealing time. The precipitategrowth is much faster in Alloy 0 compared to both rheniumcontaining alloy variants. The coarsening rate in Alloy Re isslightly faster than in Alloy ReRu. SEM-micrographs of the threeinAnnealing experiments were done in air. A sufficiently thicksurface layer has been removed during subsequent specimen110
alloys after annealing at 1100 C for 750 h are shown in Fig. 4.While the γ′-precipitates in Alloy 0 have coarsened isotropicallyand developed a slightly cubic shape the morphology of the γ′precipitates in Alloy Re and Alloy ReRu is different. In these twoalloys the γ′-precipitates coarsened directionally. Elongatedparticles grow along two preferred directions which areperpendicular to each other and parallel to the crystallographic 100 orientations.ruthenium which is found to be slightly enriched in the γ-phase.Rhenium has the strongest tendency to partition to the γ-matrixcompared with the other alloying elements in Alloy Re. Rheniumand to a lesser extent also molybdenum partitions morehomogenously if ruthenium is added as in Alloy ReRu. So reversepartitioning of rhenium is found in the presence of ruthenium inthe alloys investigated in this work. The γ′-volume fraction wasalso determined from the partitioning coefficients and the overallalloy composition by Blavette’s method [16]. The highest volumefraction with 73 % is found in Alloy ReRu and the lowest volumefraction with 65 % in Alloy 0. Alloy Re has a γ′-volume fractionof 71 %.Figure 3: Evolution of the γ′-particle size a of theexperimental alloys during short-time annealing at1100 C.Figure 5: Partitioning coefficients of the alloying elementsin the standard heat treated condition of Alloy 0, Alloy Reand Alloy ReRu.The k-coefficients of the alloying elements at 1150 C measuredin specimens after rapid quenching as described in theexperimental section are plotted in Fig. 6.Figure 4: SEM-micrographs of a) Alloy 0, b) Alloy Re andc) Alloy ReRu after annealing at 1100 C for 750 h.Partitioning BehaviorFrom the local chemical composition of the γ-matrix and the γ′particles measured by EDS in the TEM the partitioning coefficientfor the different alloying elements was calculated. In thefollowing the partitioning coefficient k is usedγ′/γkiciγ ′ γci(1)withciγ ′ being the concentration of alloying element i in the γ′-andciγ in the γ-phase, respectively. A k-coefficient greater thanFigure 6: Partitioning coefficients of the alloying elementsat 1150 C in Alloy 0, Alloy Re and Alloy ReRu.one denotes that an alloying element is preferentially enriched inthe γ′-precipitates. The k-coefficients for the three alloys in thestandard heat treated condition are plotted in Fig. 5. Tantalum isnot shown, due to the small overall content of tantalum in thealloys. Most alloying elements show the partitioning behaviorknown from literature [4, 5, 6, 13, 14, 15]. This is also true forIt is obvious that all alloying elements distribute morehomogenously between γ- and γ′-phase at higher temperatures.Two of the results are of special interest with respect to the111
Alloy 0) and 11.5% (Alloy Re), respectively. The diffractionmeasurements were done on (002)-lattice planes under reflection,which lay perpendicular to the external stress axis. The (002)-peakof the crept specimen of Alloy 0 is more symmetric compared tothe standard heat treated state as the lattice constants of the γ- andγ′-phase after creep are less different. Due to creep deformationthe lattice constant of the γ-matrix increased and the lattice misfitchanged to near zero. An increasing peak broadening from thestandard heat treated state to the crept state is found in Alloy Reand Alloy ReRu. The separation of the sub-peaks of γ- and γ′ iseven more pronounced in Alloy ReRu containing a high negativelattice misfit already in the standard heat treated state at roomtemperature. In Fig. 8 it is visible that the misfit in the creptspecimen is always lower than in the standard heat treated stateand that also after creep the misfit decreases with increasingcontent of rhenium and ruthenium in the alloys.behavior of rhenium and ruthenium: Ruthenium which has atendency to enrich in the γ-matrix as pronounced as cobalt ormolybdenum in the standard heat treated state homogenizesslightly faster with increasing temperature than molybdenum andcobalt and the effect of reverse partitioning measured in thestandard heat treated state of Alloy ReRu is also present at highertemperatures.Lattice Constants and Lattice MisfitIn Fig. 7 the X-ray profiles of the (002)-reflection for the threealloys in standard heat treated condition are shown. The profilesof Alloy 0 and Alloy ReRu have a pronounced asymmetric shape.It is commonly accepted that this results from the overlap of thesub-peaks of the γ- and γ′-phase which possess slightly differentlattice constants. Nevertheless, while the asymmetry in the case ofAlloy 0 is on the side of smaller lattice constants, Alloy ReRuexhibits an asymmetry at higher lattice constant side.Figure 7: (002)-X-ray profiles of a) Alloy 0, b) Alloy Reand c) Alloy ReRu in the standard heat treated state and ofd) Alloy 0, e) Alloy Re and f) Alloy ReRu aftercompressive creep at 1100 C.Figure 8: Lattice misfit for the standard heat treated statesand specimens crept at 1100 C plotted versus thecombined content of rhenium and ruthenium.Hardness of γ- and γ′-PhaseThe lattice misfit δ is commonly defined in nickel-basesuperalloys asδ 2(aγ ′ aγ )aγ ′ aγ(2)with aγ and aγ′ being the lattice constants of γ- and γ′-phase,respectively. This means that the lattice misfit is positive inAlloy 0 and negative in Alloy ReRu. Alloy Re in the standard heattreated condition has a very symmetric X-ray profile indicating alattice mismatch value near zero.The lattice constant of the γ-phase is increasing from Alloy 0 with0.3575 nm over Alloy Re with 0.3583 nm to Alloy ReRu with0.3593 nm. The lattice constant of the γ′-phase does not changesignificantly between Alloy 0 with 0.3579 nm and Alloy Re with0.3581 nm while it increases in Alloy ReRu to 0.3585 nm.These changes in the lattice constants of the γ- and γ′-phase resultin according changes of the lattice misfit. In Fig. 8 the latticemisfit is plotted vs. the added content of the elements rhenium andruthenium in the alloys. For the standard heat treated states thelattice misfit decreases linearly with increasing rhenium andruthenium content. Besides the standard heat treated states X-raydiffraction measurements were also performed on specimens creptat 1100 C under a compressive load of 137 MPa. The creep testswere interrupted at a plastic strain of 6.5 % (Alloy ReRu andFigure 9: Nanohardness of the phases γ and γ′ and γ′/γhardness ratio measured in Alloy 0, Alloy Re andAlloy ReRu.The local hardness of the γ- and γ′-phase and the respectivehardness ratio of γ′ to γ for the three alloys investigated in this112
Obviously the creep properties differ significantly for differentinitial γ′-sizes, which is more clearly visible in Fig. 12 where theminimum creep rate is plotted against the initial γ′-size for the twoalloys.work is plotted in Fig. 9. The reference Alloy 0 exhibits a γ′/γhardness ratio of about 1.52. By adding 3 wt.% rhenium the γ′/γhardness ratio decreases to 1.42 due to the strongly increasinghardness of the γ-matrix, while no change in γ′-hardness wasfound. However, the addition of 3 wt.% ruthenium leads to asignificant increase in hardness of the γ′-phase, whereas thehardness of the γ-phase stays almost constant compared to AlloyRe. This means that no strong hardening effect of the γ-matrix dueto ruthenium can be observed and therefore the γ′/γ-hardness ratioincreases to 1.55.Creep Properties and Optimum γ′-SizeSpecimens of Alloy Re with a lattice misfit near zero andAlloy ReRu with a negative lattice misfit at room temperaturewere creep tested with different initial γ′-sizes between about0.2 µm to 0.6 µm. The creep curves of all investigated specimensof Alloy ReRu and Alloy Re are shown in Fig. 10 and Fig. 11,respectively.Figure 12: Minimum creep rate in dependence of theinitial γ′-size for Alloy ReRu and Alloy Re; twospecimens of Alloy Re had a small misoriented columnargrain at the outer diameter of the cylindrical specimen.These misoriented grains probably cause the lower creepstrength of these both specimens (marked by arrows).Both alloys show a maximum creep strength at a specific initialγ′-size. Alloy ReRu with its negative lattice misfit shows thelowest creep rate of about 2x10⁻⁷s-1 for an initial γ′-size of about320 nm. At a similar γ′-size Alloy Re has a lower creep strength.The minimum creep rate for the optimum initial γ′-size was foundto be 3x10⁻⁷s-1 in Alloy Re. As shown in Fig. 13 themicrostructure for an initial γ′-size of about 330 nm is different inAlloy ReRu compared to Alloy Re.Figure 10: Creep rate versus the plastic creep strain ofspecimens of Alloy ReRu with different initial γ′-sizes a at137 MPa at 1100 C.Figure 13: SEM-micrographs of samples of a) Alloy ReRuand b) Alloy Re with similar initial γ′-size of about320 nm and of c) Alloy Re with higher initial γ′-size ofabout 530 nm.The former alloy possesses cubic precipitates well aligned along 001 directions, while the γ′-precipitates in the latter are moreglobular and more randomly distributed. With increasing initial γ′size the minimum creep rate in Alloy Re decreases until aminimum of about 3x10⁻⁷s-1 is reached at about 530 nm initial γ′precipitate size. At this point the initial γ′-shape became also fullycubic and the precipitates more strongly aligned along 001 asin Alloy ReRu as again is visible in Fig. 13.Figure 11: Creep rate versus the plastic creep strain ofspecimens of Alloy Re with different initial γ′-sizes a at137 MPa at 1100 C.113
Under the same conditions (137 MPa at 1100 C) Alloy 0 exhibitsa creep rate of about 5x10⁻⁵s-1. But due to the bad creep propertiesof Alloy 0 at that temperature the respective creep curve showedno distinct creep rate minimum and only one specimen was tested.the γ-channels. It should be noted in this respect that actualruthenium-containing alloys show improvements in creepbehavior compared to 2nd and 3rd generation nickel-basesuperalloys especially at very high temperatures [8, 19, 22].The fact, that reverse partitioning of rhenium is not only found instandard heat treated specimens but also in specimens rapidlyquenched from 1150 C is also interesting in this respect. If morerhenium is alloyed to the γ′-precipitate phase it should alsocontribute to a higher hardness of the γ′-phase. Accordingly, γ′cutting in ruthenium containing alloys is not only hindered by thepresence of ruthenium as hardening element in the γ′-phase itselfbut also by a higher amount of rhenium in the γ′-phase if reversepartitioning occurs. That reverse partitioning of rhenium causes astrong hardening of the γ′-phase at least at room temperature willbe discussed in more detail in a later section. The occurrence ofreverse partitioning would also explain that ruthenium additionsimprove the phase stability of rhenium containing nickel-basesuperalloys. Nevertheless, as reverse partitioning is not found inall ruthenium containing alloys it is difficult to explain thatimprovements in phase stability which are commonly reported forruthenium containing alloys. Most probably other effects besidesreverse partitioning also contribute to the improvement of phasestability in ruthenium containing alloys.DiscussionPartitioning Behavior of Alloying ElementsThe partitioning behavior of alloying elements is an importantfactor to understand how an alloying element alters the propertiesof a nickel-base superalloy [14, 17]. Especially the partitioningbehavior of the two elements rhenium and ruthenium is ofinterest. Rhenium has the most pronounced preference to partitionto the γ-matrix of all elements normally alloyed to nickel-basesuperalloys [4, 5, 6, 13, 14, 15]. Ruthenium can alter thispartitioning behavior of rhenium [3, 6, 18] and rhenium andruthenium are actually alloyed to the newest superalloys of the 4thgeneration [8, 19]. It will be shown in the subsequent sections thatthe different results presented in the previous chapter can easily beinterpreted in a coherent way if it is considered that reversepartitioning i.e. a more homogenous distribution of rheniumbetween γ- and γ′-phase is present if ruthenium is added. Hence,results regarding such different alloy properties as local hardness,coarsening behavior of the γ′-precipitates and change of latticemisfit and constants support the fact that reverse partitioning wasfound in EDS-measurements in this work. There is contradictorydebate about reverse partitioning in literature. While a number ofauthors did not find reverse partitioning in ruthenium containingalloys [4, 5, 13, 15] some other works claim that reversepartitioning occurs [3, 18]. These discrepancies may be caused bythe finding that reverse partitioning of rhenium is not onlydependent on the ruthenium content but also the presence andcontent of other alloying elements like chromium and cobalt.There is evidence in literature [6] that low levels of chromium andcobalt promote reverse partitioning. Recently Caroll et al. [6]succeeded in designing ruthenium containing alloys with positivemisfit by purposely altering the alloy composition in a way thatreverse partitioning occurs. Alloy ReRu investigated herepossesses a rather different alloy composition compared to otherruthenium containing alloys in which the absence of reversepartitioning was reported in literature [4, 5, 13, 15]. It is assumedthat the overall alloy composition of Alloy ReRu promotes theoccurrence of reverse partitioning of rhenium. The γ′-volumefraction derived by Blavette’s method are in the same range asreported for commercial alloys with similar chemical composition(e.g. CMSX-6) [20].As nickel-base superalloys are dedicated high temperaturematerials the partitioning behavior of alloying elements atelevated temperatures is of importance with respect to application.The more homogenous partitioning of ruthenium at highertemperatures means that the ruthenium solid solutionstrengthening influence on the matrix is reduced at servicetemperature compared to room temperature. It is an interestingquestion if this is beneficial or detrimental for the creep propertiesat very high temperatures, when cutting of γ′-precipitatescontribute to the creep deformation [21]. Ruthenium acting assolid solution strengthener in the γ′-precipitates could bebeneficial for creep properties because cutting of γ′-particles bydislocations becomes more difficult. On the other hand this meansalso that a lower content of solid solution strengthening elementsin the matrix exists which eases the dislocations moving throughLattice Constants and MisfitThe changes of lattice constant and lattice misfit in the threealloys can be understood by taking into account the partitioningbehavior and especially the effect of reverse partitioning ofrhenium in the presence of ruthenium in Alloy ReRu. The changeof the lattice misfit in the standard heat treated states frompositive values in Alloy 0 to slightly and pronounced negativevalues in Alloy Re and Alloy ReRu, respectively, is caused by theaddition of alloying elements that predominantly partition to the γmatrix increasing the lattice constant of this phase and changingthe lattice misfit accordingly. This is most obvious by the fact thatthe lattice misfit in the three alloys shows a nearly linear behaviorwhen plotted vs. the combined element concentration of rhenium,and ruthenium in Fig. 8. As rhenium and ruthenium both partitionpredominantly to the γ-matrix the lattice constant of the γ-phaseshould increase more than that of the γ′-phase when rhenium andruthenium are alloyed. Hence, the differences in lattice misfitbetween the three alloys are directly explained by their alloycomposition.The change of the lattice constants of the γ- and γ′-phase is alsodirectly understood by the partitioning of rhenium and ruthenium.In Fig. 14 the lattice constants are plotted versus the content of theelements rhenium, ruthenium and molybdenum measured in therespective phase by TEM-EDS and weighted with Vegard’scoefficients found in literature [22, 23, 24]. The refractoryelements rhenium, ruthenium and molybdenum are chosen as theconcentration of these elements varies the most within bothphases in the experimental alloys as shown in Fig. 5. As latticeconstants measured in all three alloys linearly depend on thechemical composition of the respective phase it is obvious that allchanges of the lattice constants are directly caused and explainedby changes in the chemical composition of the respective phase.Comparing Alloy 0 and Alloy Re only the lattice constant of theγ-matrix is increased by alloying rhenium while the latticeconstant of the γ′-phase stays nearly constant. This is due to thefact that rhenium almost predominantly partitions to the γ-phaseand accordingly only affects the lattice constant of this phase. In114
in the beginning and introduce back stresses in the matrixchannels afterwards. The coherency stresses in alloys withnegative lattice misfit like Alloy Re and Alloy ReRu arecompressive in the γ- and tensile in the γ′-phase. Hence, thestresses introduced by the dislocation networks should lead tohigher lattice constants in the γ- and lower lattice constants in theγ′-phase. This is visible as a separation of the γ- and γ′-sub peak asobserved in the creep deformed specimens of Alloy Re andAlloy ReRu.How far the γ- and γ′-sub peaks separate is dependent on thedensity of the interfacial dislocation networks. After the onset ofrecovery processes, either by γ′-cutting or glide climb ofdislocation segments near precipitate edges, the dislocationdensity in the networks should be more or less constant. This is ofcourse under the assumption that the microstructure (matrixchannel width, degree of rafting, etc.) does not changesignificantly. I.e. the separation of the sub peaks is the higher thehigher the amount of lattice misfit (leading to a high equilibriumdislocation density) and the harder the γ′-phase (leading to a highexcess dislocation density) is if γ′-cutting is the predominantrecovery process which is probably the case in directionalcoarsened γ′-structures. So the finding that the separation of the γand γ′-sub peaks is more pronounced in the creep deformedspecimen of Alloy ReRu than in Alloy Re is understandable bythe fact that the amount of lattice misfit in Alloy ReRu is higherthan in Alloy Re and the γ′-phase in Alloy ReRu is harder than inAlloy Re. Both results stem from room temperature measurementsin the standard heat treated states with X-ray diffraction and nanoindentation (these results will be discussed in more detail in thefollowing section). Nevertheless, it is reasonable to assume thatthe differences in hardness and lattice misfit are still present atcreep temperature explaining the higher degree of sub-peakseparation in Alloy ReRu.It is necessary to keep in mind that with increasing temperaturethe thermal expansion of the γ-matrix phase is higher than that ofthe γ′-phase [14] to understand why no significant changes in theshape of the X-ray profile are found in Alloy 0 after creepdeformation. If an alloy has already a negative misfit at roomtemp
that rhenium is less strongly enriched in the γ-matrix if ruthenium is present and accordingly the critical concentration of rhenium in the matrix to precipitate TCP-phases is not reached, was found by O'Hara et al first [3] but could not be reproduced by a number of other groups investigating ruthenium containing alloys [4, 5].