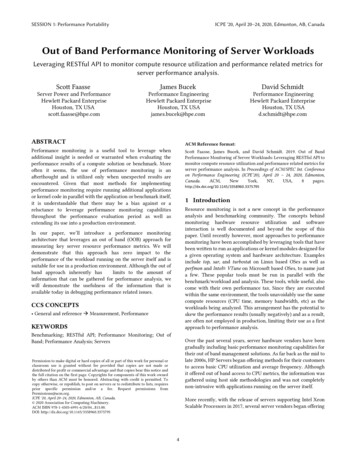
Transcription
SWAMP Data on BDAT Site- The SF Bay Area SWAMP program provides water and sediment chemistry, toxicity andpathogen data as well as time series data on the BDAT website. Time series (continuousmonitoring) basic water quality data is available on BDAT through a Time Series Databasemaintained by regional SWAMP staff and the Department of Water Resources (DWR).-Water quality indicators that SWAMP monitors and provides on the BDAT website include:Total coliform bacteriaFecal coliform bacteriaE.coliWater chemistry (metals, organics)ELIZA for diazinon and chlorpyrifosHardnessTSS, TDSTOC, DOCTurbidityWater Velocity (discrete measurement only)NutrientsChlorophyllWater toxicitySediment chemistry (metals, organics)Grain sizeSediment toxicityContinuous Monitoring: water temperature, dissolved oxygen, pH, conductivityPlease see the following for instructions on how to access SWAMP data on the BDAT website.For additional information or questions about SWAMP data, please contact the SF Bay Area’sSWAMP Data Manager:Karissa Anderson, SF Bay Area SWAMP Data Managerkaanderson@waterboards.ca.gov(510) 622-2318
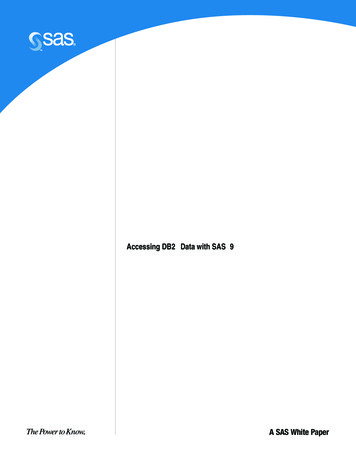
Instructions to SWAMP Data on BDAT Site(last updated May, 2007)1) Go to BDAT website – http://bdat.ca.gov/2) Click on Data Retrieval (first option).3) Click on Data Category.
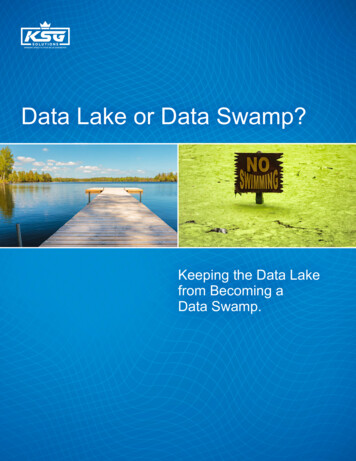
4) Select a Data Category (Time Series for this example) from the list; a series of option buttonswill appear below the Data Category window.TimeSeries5) To select SWAMP data, click the Projects button.6) Select Surface Water Ambient Monitoring Program (SWAMP – SWRCB) from the list. Agroup of buttons will appear below the Projects List box.Surface Water Ambient Monitoring Program (SWAMP – SWRCB)
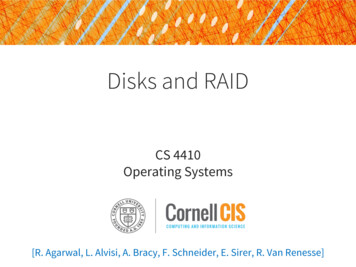
7) Click on the Analytes button (below the list of projects window).8) When this screen (shown below) appears, select one or more analytes; to select more than one,hold down Ctrl to highlight each analyte. If no analytes are selected at this point, the outputrequest will contain all data available.9) Once the analytes are selected, additional buttons will appear on the screen below the window.Click on the Date Range button (see below).10) When the Select -Date Range screen (below) appears, use the drop-down menus to enter thedates desired (if no range is selected, all available data will be retrieved).11) When you’ve specified the date range desired, click the Stations button. (Note: Theselections made so far will appear at the bottom of the screen in the Current Selections box. Ifyou need to undo or change a selection, click either the Go Back or Start Over button. Seebelow.)
Current Selections Box:Shows all specifications alreadyselected up to this point.12) After clicking on the Stations button, select the desired stations from the list that appears(hold down Ctrl while selecting to highlight multiple – see below). If no stations are selected,data for all stations will be retrieved.
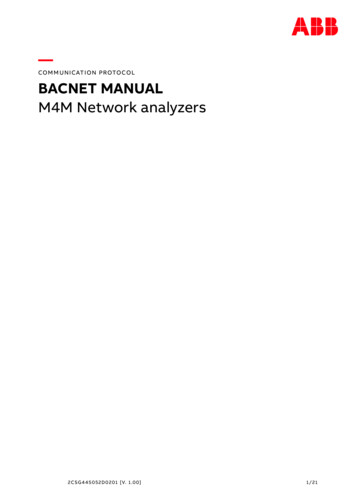
13) After selecting the desired stations, click the Get Data button (see above). The screen belowwill appear.15)14) Select fields to bedisplayed. Hold downCtrl key for multiple.14) Select the fields that you’d like to displayed in the final product from the list (hold down Ctrlkey to select or un-select multiple fields).15) Next select how you’d like to view and receive the data. The number of records that will begenerated is displayed at the top of the page (see arrows above).16) If the data is less than 2500 rows, all four options are available (see last page of instructionsfor a sample Excel spreadsheet). Up to 65000 rows can be downloaded directly from the website.For a larger file, the only option is to receive a link sent through email.If you select “Email a link to download all data,” a box will appear for you to enter an emailaddress. Enter the address and click the Get Data button.
The following pop-up box will appear confirming the request.17) Once a data display/format is selected, (if not selecting the email option) click the Get Databutton to finalize the request.18) For toxicity data, steps 1-17 are the same. Below is an example of what the CurrentSelections box (see Step 11) would look like for toxicity data.19) All steps 1-17 are the same for Water Quality data. Below is an example of the CurrentSelections box for Water Quality data.
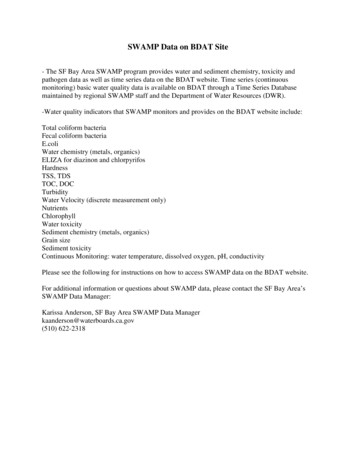
- The Excel format (see Step 15) will appear as an Excel spreadsheet (see below) which can thenbe opened or saved.Example of Excel spreadsheet from BDAT site:By: Karissa Anderson, SF Bay Regional SWAMP Data Manager (kaanderson@waterboards.ca.gov)
For additional information or questions about SWAMP data, please contact the SF Bay Area's SWAMP Data Manager: Karissa Anderson, SF Bay Area SWAMP Data Manager kaanderson@waterboards.ca.gov (510) 622-2318