Transcription
SESSION 1: Performance PortabilityICPE '20, April 20–24, 2020, Edmonton, AB, CanadaOut of Band Performance Monitoring of Server WorkloadsLeveraging RESTful API to monitor compute resource utilization and performance related metrics forserver performance analysis.Scott FaasseJames BucekDavid SchmidtServer Power and PerformanceHewlett Packard EnterpriseHouston, TX USAscott.faasse@hpe.comPerformance EngineeringHewlett Packard EnterpriseHouston, TX USAjames.bucek@hpe.comPerformance EngineeringHewlett Packard EnterpriseHouston, TX USAd.schmidt@hpe.comABSTRACTACM Reference format:Performance monitoring is a useful tool to leverage whenadditional insight is needed or warranted when evaluating theperformance results of a compute solution or benchmark. Moreoften it seems, the use of performance monitoring is anafterthought and is utilized only when unexpected results areencountered. Given that most methods for implementingperformance monitoring require running additional applicationsor kernel code in parallel with the application or benchmark itself,it is understandable that there may be a bias against or areluctance to leverage performance monitoring capabilitiesthroughout the performance evaluation period as well asextending its use into a production environment.Scott Faasse, James Bucek, and David Schmidt. 2019. Out of BandPerformance Monitoring of Server Workloads: Leveraging RESTful API tomonitor compute resource utilization and performance related metrics forserver performance analysis. In Proceedings of ACM/SPEC Int. Conferenceon Performance Engineering (ICPE’20), April 20 – 24, 2020, x.doi.org/10.1145/3358960.33757951 IntroductionResource monitoring is not a new concept in the performanceanalysis and benchmarking community. The concepts behindmonitoring hardware resource utilization and softwareinteraction is well documented and beyond the scope of thispaper. Until recently however, most approaches to performancemonitoring have been accomplished by leveraging tools that havebeen written to run as applications or kernel modules designed fora given operating system and hardware architecture. Examplesinclude top, sar, and turbostat on Linux based OSes as well asperfmon and Intel VTune on Microsoft based OSes, to name justa few. These popular tools must be run in parallel with thebenchmark/workload and analysis. These tools, while useful, alsocome with their own performance tax. Since they are executedwithin the same environment, the tools unavoidably use the samecompute resources (CPU time, memory bandwidth, etc) as theworkloads being analyzed. This arrangement has the potential toskew the performance results (usually negatively) and as a result,are often not employed in production, limiting their use as a firstapproach to performance analysis.In our paper, we’ll introduce a performance monitoringarchitecture that leverages an out of band (OOB) approach formeasuring key server resource performance metrics. We willdemonstrate that this approach has zero impact to theperformance of the workload running on the server itself and issuitable for use in a production environment. Although the out ofband approach inherently haslimits to the amount ofinformation that can be gathered for performance analysis, wewill demonstrate the usefulness of the information that isavailable today in debugging performance related issues.CCS CONCEPTS General and reference Measurement, PerformanceKEYWORDSBenchmarking; RESTful API; Performance Monitoring; Out ofBand; Performance Analysis; ServersOver the past several years, server hardware vendors have beengradually including basic performance monitoring capabilities fortheir out of band management solutions. As far back as the mid tolate 2000s, HP Servers began offering methods for their customersto access basic CPU utilization and average frequency. Althoughit offered out of band access to CPU metrics, the information wasgathered using host side methodologies and was not completelynon-intrusive with applications running on the server itself.Permission to make digital or hard copies of all or part of this work for personal orclassroom use is granted without fee provided that copies are not made ordistributed for profit or commercial advantage and that copies bear this notice andthe full citation on the first page. Copyrights for components of this work ownedby others than ACM must be honored. Abstracting with credit is permitted. Tocopy otherwise, or republish, to post on servers or to redistribute to lists, requiresprior specific permission and/or a fee. Request permissions fromPermissions@acm.org.ICPE '20, April 20–24, 2020, Edmonton, AB, Canada. 2020 Association for Computing Machinery.ACM ISBN 978-1-4503-6991-6/20/04. 15.00.DOI: http://dx.doi.org/10.1145/3358960.3375795More recently, with the release of servers supporting Intel XeonScalable Processors in 2017, several server vendors began offering4
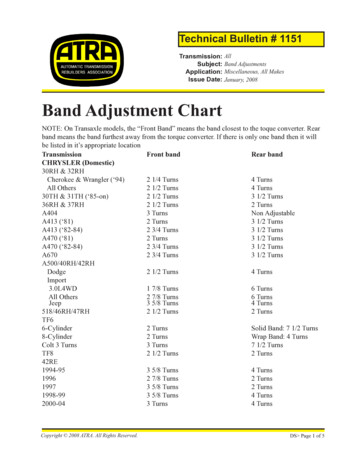
SESSION 1: Performance PortabilityICPE '20, April 20–24, 2020, Edmonton, AB, Canadaa more robust approach to out of band performance monitoringthat included expanded metrics that provided at least CPUutilization, I/O Utilization, and Memory Bus utilization metrics.These metrics are not only delivered out band through the baseserver management controller, but they are also measured outsidethe scope of the processor’s execution pipeline, meaning that theyare nearly 100% non-interfering.1.2.3.4.5.6.7.CPU UtilizationMemory Bus UtilizationI/O Bus UtilizationCPU Interconnect UtilizationAverage CPU frequencyAverage CPU powerProcessor Jitter (frequency changes)2.2 Alternative methods.One such server provider, HPE, offers the ability for their users togather performance monitoring data from their servers leveragingan open standard set of APIs [1]. In this paper, we will utilize thiscapability to explore the following:1) Obtain OOB performance telemetry by leveraging openstandard APIs2) Demonstrate “do no harm” (DNH) testing for computeintensive workloads3) Demonstrate DNH testing for power efficiencyworkloads4) Provide example performance analysis results fromlooking at various benchmark workload examples.Beyond the Redfish interface, there exist other methods to accessOOB performance data. Several server vendors, including HPE,also provide a graphical user interface via a web page (Web GUI)hosted by the BMC itself. These interfaces typically providecurrent performance status as well as the ability to viewperformance graphs over selected time frames. While theseinterfaces simply provide another access mechanism to the data,leveraging the interface typically doesn’t scale well as it requireshuman interaction (i.e. not scriptable.)Redfish and the RESTful API is not the only server programmableinterface to obtain management data. The Intelligent PlatformManagement Interface (IPMI) [8] also provides ahardware/software management architecture that could be usedto achieve similar results. This specification however lacks clearstandard definitions for reporting performance metrics.Implementations that leverage IPMI for telemetry are likely to beOEM specific and vary between vendors.2 Accessing Performance Monitoring DataAccessing performance monitoring data out of band, on a server,requires management access to the server’s base managementcontroller (BMC.) The BMC is responsible for accessing servercomponent (CPU, Memory, Fans, I/O devices) sensor telemetry ifand when it is made available by the component vendor. Whentelemetry does exist, the BMC can optionally provide that data tocustomers through various closed or open interfaces.Regardless of which programming interface is used, it isimportant to distinguish the hardware interface that will beleveraged. For instance, with Redfish, you can access the data fromthe host side or out of band. While the data is still collected by theBMC via out of band mechanisms, there are allowances for thetools to run on the server host itself. It should be obvious thatwhen accessing data from a host side tool, some of the advantageswill be lost. Specifically the host side performance penalty whencomparing to existing OS level tools that gather similar data. Forour research, we will focus on using a remote connection (i.e.network – TCP/IP) to collect performance data.Since the BMC executes separately from the host (CPU, Memory,I/O, Operating System), requests to the BMC should not interferewith workloads running on the host – specifically when requestscome via the external network. We will test/prove this theory inSection 4.2.1 Redfish (RESTful API)The DTMF forum (an industry member working group) publishesseveral open standard interfaces for managing informationtechnologies. The Redfish [2] specification provides an openstandard interface for interacting with a server’s BMC via simpleHTTP style communication (RESTful API). The specificationoutlines the methods for interacting with BIOS configuration,plug-in devices configuration, basic server features, as well asserver telemetry.3 Experimental SetupTo demonstrate the usefulness of leveraging the OOBperformance monitoring, we will look at a setup in Figure [1],where a client running on hardware separate from the serverunder test, will request telemetry data from a server that supportsreporting performance telemetry via the Redfish interface. Theclient setup can be as simple or as complex as the solution dictates(monitoring a single server or scaled out to monitoring 1000s ofservers). The data is stored on the remote client and reports canbe generated for a particular server over a given time-frame.We will leverage the telemetry services functionality that isdefined in the Redfish specification and is implemented on thelatest server offerings provided by HPE. The telemetry providedby HPE ProLiant and Synergy servers [3] support access to thefollowing performance related sensors (metrics) in 10 minute, 1hour, 24 hour, and 1 week reports:5
SESSION 1: Performance PortabilityICPE '20, April 20–24, 2020, Edmonton, AB, Canada4.1 Do No Harm VerificationFor the first DNH test, SPEC CPU 2017 was run on a 2-processorHPE ProLiant DL380 Gen10 server running SLES 15 SP1. A singleiterationofSPECrate 2017 int baseandSPECrate 2017 fp base were run and an estimated overall metricwas calculated from the results. A second measurement was thenstarted. While the second run was executing, 7000 consecutivequeries were made to the RESTful API to collect performancemonitoring data. An estimated result was calculated from thesecond measurement’s results. Table [1] shows the SPEC CPU2017 metric estimates for each test. The results shown in the tableare pulled from an actual SPEC CPU 2017 run. They are labeled asmetrics since they show more detail than the standard FDR andare not published results.SPEC CPU 2017 metricsServer undernoexternalmonitoringServerunderhigh externalmonitoringSPECrate2017 int base299.33300.40(est.)SPECrate2017 fp base255.20255.54(est.)Table 1. Do no harm validation results using SPEC CPU 2017 asworkloadFigure 1. Experimental setup for gathering server performancedataOur DNH testing leveraged a Windows based client with Python3.4 installed, with the requests library installed in order to leveragethe HTTP nature of RESTful API accesses. The client was set upto attempt to create a denial of service type of test. Thousands ofback to back requests (occurring every X {timeframe}) fortelemetry were initiated to ensure that the server’s host sideperformance wasn’t negatively impacted.The performance difference between the unmonitored andmonitored measurements was less than 0.5%. This difference iswell within the run-to-run variation of the benchmark.For scale-out testing, we leveraged a server running Linux, withPython 3.7, and a structured database to store telemetry for dozensof managed servers in a lab that is setup to mimic a datacenterlike environment. The managed servers were running a variety ofbenchmarks including SPEC CPU 2017, SPECjbb 2015,SPECvirt sc 2013, etc. Given that these servers are used forpublication of benchmark results for HPE, this is considered a“production” level environment where any impact to solutionperformance would have a negative impact to our business.Equally important in benchmark results analysis, the informationgleaned from the performance reports would potentially beconsidered important and business critical.The second DNH test was run using the SPECpower ssj2008benchmark. In this test case, both server power and workloadperformance are captured. A 2-processor HPE ProLiant DL380Gen10 server running Windows Server 2012 R2 Datacenter wasused for the test. As with the first test, an initial measurement wasmade by running the benchmark with no external monitoring ofthe server. A second measurement was performed while 1000consecutive queries were made to the RESTful API. Table [2]shows the results for both measurements.It is important to note that for 10 minute monitoring reports, thedata is averaged at 20 second intervals. For 1 hour, 24 hour, and 1week reports, the data is averaged at 20 second, 5 minute, and 30minute averages respectively. For DNH testing, we requestedreports from the test server for all 4 intervals. For scale out testing,only 24 hour data was captured to evaluate the usefulness ofleveraging the longer 5 minute averages for the metrics.SPECpower ssj2008 result11,02211,052(overall ssj ops/watt)Server power at 100% load465465(W)ssj ops at 100% load5,304,2355,307,336Server power at idle (W)55.955.9Table 2. Do no harm validation results using SPECpower ssj2008as workloadSPECpower ssj2008metrics4 Evaluation and AnalysisServer underno externalmonitoringServer underhigh externalmonitoringTable [2] shows that the difference in power and performancebetween the unmonitored and monitored measurements was lessthan 0.5%, within the run-to-run variation of the benchmark.We break down our evaluation into two categories: DNHmeasurement verification, and workload profile characterization.For both categories, the target server’s configuration wasunchanged during the measurements, except where noted.6
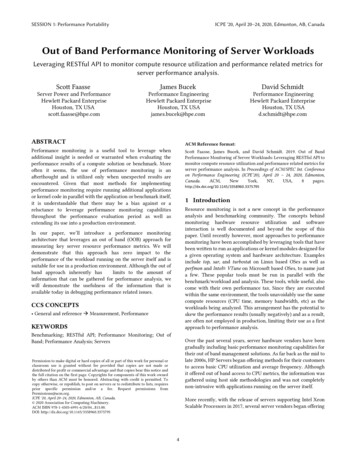
SESSION 1: Performance PortabilityICPE '20, April 20–24, 2020, Edmonton, AB, CanadaBoth of the DNH test cases demonstrate that the impact ofaccessing the OOB performance monitoring data is negligible tothe system performance. Additionally, the SPECpower ssj2008test case shows the effect of OOB performance monitoring to thesystem power is likewise negligible.The periods of lower CPU utilization coincide with thecompilation phases for the first executions of theSPECrate2017 {int,fp} base suites. The difference in the runprofile of the benchmarks run with un-compiled and precompiledexecutables is highlighted in Figure [4], which shows the side-byside comparison of the CPU utilization during each run.4.2 SPEC CPU 2017 run analysisExamining the performance counter data reveals a number ofinteresting insights into the benchmarks’ utilization patterns. It isclear that neither benchmark heavily taxes the IO subsystem, asits utilization rarely shows any significant usage. Likewise littleinter-socket IO traffic is seen, as represented by the CPU Int Conutilization graph in Figure [2], This is indicative of highly NUMAaware workloads, in this case a well-tuned SPEC CPU 2017configuration. Patterns can also be seen between the two sets ofbenchmark runs. Similar peaks and dips can be seen at the samepoint during each set of runs in the CPU, memory, and CPUinterconnect utilizations, as well as the Jitter Count and CPU0Power consumption. These peaks and valleys represent thedifferences in resource utilization of the individual workloadmodules within the benchmark suites. Correlating the usagepatterns to the specific workload modules can provide insight intothe modules’ bottlenecks and provide guidance to optimizationefforts. Some of the counters seen in Figures [2] – [5] could beobtained from other methods such as in band performancemonitoring software within an operating system. Other metrics,such as Jitter Count, are less easily obtained through alternativemethods and may require tools that impact the performance beingmeasured.In this section we will show OOB performance measurementsgathered while running the SPECrate2017 benchmark suites. Thebenchmarks were run on the same 2-processor server runningSLES15 SP1 as was used in the DNH tests. The SPEC CPU 2017benchmark harness was configured on the server as was thecompiler needed to create the benchmark suites’ workloadbinaries. SPECrate2017 int base was run first, which required thecompilation of the workload binaries. Immediately following thebenchmark’s completion, SPECrate2017 fp base was run; itsworkload binaries were also compiled at the start of themeasurement. Finally, both the integer and floating point suiteswere then immediately run again. For all 4 measurements, a singleexecution of each base workload module was performed. Figures[2] and [3] show the plotted data gathered from the OOBperformance monitor during the runs. Figure [2] shows theutilization statistics and Figure [3] shows the processorcharacteristics. Note that the vertical axis for Figure [3] islogarithmic in order to clearly see all plots.The first SPECrate2017 int base run started at 20:15:19 andcompleted at 22:00:26. The first SPECrate fp base run startedimmediately afterward and completed at 02:58:11. The second setsof runs completed at 04:25:51 and 08:22:55, respectively.Figure 2. Out of band utilization performance counters7
SESSION 1: Performance PortabilityICPE '20, April 20–24, 2020, Edmonton, AB, CanadaFigure 3. Out of band CPU performance countersFigure 4. CPU utilization comparison of SPECrate2017 measurements using precompiled workload executables vs. compiling at runtime8
SESSION 1: Performance PortabilityICPE '20, April 20–24, 2020, Edmonton, AB, Canada9
SESSION 1: Performance PortabilityICPE '20, April 20–24, 2020, Edmonton, AB, Canadarun while the Jitter Control was enabled and then a second runwas executed with the Jitter Control disabled. The results areshown in Figure [5]. As can be seen, there are no Jitter countsduring the first SPECjbb2015 run, where Jitter Control wasenabled. The second run show considerable jitter countsthroughout the run, with the value increasing as the processorutilization increases.4.3 Processor Jitter on SPECjbb2015For the final test case we utilized the SPECjbb2015 benchmark todemonstrate the effects of setting a BIOS option that eliminatescomputation jitter due to processor frequency transitions. A BIOSoption on newer HPE servers called Processor Jitter Control [4].The option can be set to find the maximum processor frequencyachievable where no frequency variance occurs due to power orthermal constraints. The top frequency for the processor is set tothis value. In this test, a SPECjbb2015 Multi-JVM benchmark wasFigure 5. Out-of-band performance counters for back-to-back SPECjbb2015 benchmark runs with different Jitter-smoothing options1st and 3rd place in market leadership. The results of the do noharm testing with SPEC CPU 2017 demonstrated that out of bandperformance monitoring that is available today do not interferewith host side system performance. Since there isn’t an impact inperformance such as might be seen when running tools that runon the host side, we consider this a major advantage to the out ofband approach. A user of this model would essentially getperformance data monitoring for “free”; meaning that there isn’ta performance overhead expense to obtain it.5 ConclusionsThe goal of our research was to assess the viability of leveragingthe out of band performance monitoring capabilities in aproduction environment. The main conclusions that we wanted tobe able to draw were whether or not the access mechanisms wouldhave a negative impact to overall system performance (as they hadbeen in the past) as well as assess the usability of the data thatcould be mined.When looking at the results of the do no harm testing forSPECpower ssj2008, we also wanted to make sure we would nottake a power efficiency hit. Given that the results show that OOBaccesses to the data did not impact the power (or the performance)levels we are concluding that the OOB accesses to performancedata as outlined in the paper, do not have a measureable impactto either system power or performance. This differs fromtraditional in band measurement, where we have observedBased on our experience with running benchmarks in acompetitive environment, where the results will have a directimpact on overall business success and market growth, we feelthat the experimental test environment adequately portrays a“production” environment. Our do no harm testing included ahighly competitive compute benchmark where as little as 1%impact to host side performance can mean the difference between10
SESSION 1: Performance PortabilityICPE '20, April 20–24, 2020, Edmonton, AB, CanadaREFERENCESperiodic sampling of performance data throws a system out ofidle, and as a result, increases idle power.[1] Hewlett Packard Enterprise (2019). Restful Interface Tool 2.5.0 UserGuide,. lity/#overview. .[2] DMTF’s Redfish sh[3] Performance Monitoring on HPE -with-HPE-iLO-5/bap/7048920#.XZS6ADaWzA0[4] UEFI System Utilities User Guide for HPE ProLiant Gen10 Serversand /display?docId emr na-a00016407ja jp[5] SPEC CPU 2017: www.spec.org/cpu2017[6] SPECvirt sc2013: www.spec.org/virt sc2013[7] SPECpower ssj2008: www.spec.org/power ssj2008[8] SPECjbb2015: www.spec.org/jbb2015[9] Intelligent Platform Management roducts/docs/servers/ipmi/ipmi-home.htmlLastly, we acknowledge that the quantity and quality of data fromOOB accessible methods are not as richly featured as many ofthose available in band; however, we did perform investigationsto verify that the data we do have access to can demonstrate value.Our two cited examples (compile times with SPEC CPU 2017 andjitter on SPECjbb2015) are just a few simple scenarios where thedata provided can help performance minded engineers correlateperformance issues back to system behavior. As an aside, thecompile time issue was discovered during our initial analysis ofthe first run of data in the experimental setup. The long delay wasnot well understood initially and the ability to visualize the gaps,and correlate the time stamps back to the benchmark logs provedextremely useful into understanding what was being observed.We believe that there is value beyond what we demonstrated here,and additional research will continue.6 AcknowledgmentThe authors wish to acknowledge current and past members of theSPECpower Committee, SPEC CPU Committee, and SPECResearch Power Working Group who have contributed to thedesign, development, testing, and overall success of SPEC CPU2017. SPEC, SPECrate, SPECspeed, SPEC CPU, SPECpower, andSPECjbb are registered trademarks of the Standard PerformanceEvaluation Corporation. All rights reserved; see spec.org as of12/12/2020.11
2 Accessing Performance Monitoring Data Accessing performance monitoring data out of band, on a server, requires management access to the server's base management controller (BMC.) The BMC is responsible for accessing server component (CPU, Memory, Fans, I/O devices) sensor telemetry if and when it is made available by the component vendor. When