Transcription
2016 Financial Report
Table of Contents2 Message from the Chancellor14 Consolidated Statements of Activities4 Financial Report16 Consolidated Statements of Cash Flows11 Statement of Responsibility17 Notes to Consolidated Financial Statements12 Independent Auditors’ Report32 2016-2017 Board of Trustees13 Consolidated Statements of Financial Position
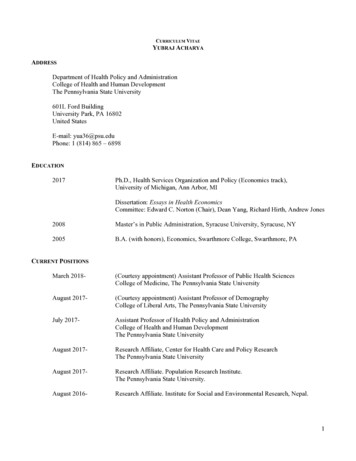
Message from the ChancellorSyracuse University concluded another strong fiscal year due toprudent resource management and strategic investments that further advanceSyracuse as a great international research university. These measures reflectan ongoing commitment distinguishing Syracuse as a place where world-classscholarship flourishes and students gain the skills and knowledge needed tosucceed.Universities nationwide face increased competition today for the best andbrightest students and faculty. Syracuse continues to perform strongly inattracting both high-quality students and deeply accomplished faculty. Thisyear’s entering class again is very strong, both in terms of academic merit andin terms of the diversity they bring to our university. Our first-year class comesfrom across the United States and from nearly 100 countries.Kent SyverudChancellor and PresidentMuch of our momentum these past 12 months has grown out of two strategicplanning efforts: the Academic Strategic Plan and the Campus Framework.These two initiatives together serve as a strategic road map to advance thequality of both learning and research and the environment that supports them.During the 2016 fiscal year, the University made significant strides toward longterm goals laid out in both plans. There is much more to do, but these effortsare ensuring that our investments align fully with our strategic priorities.In addition, attention to deferred maintenance and growing the endowment insupport of financial aid and faculty positions have been and continue to bepriorities. These measures, too, are designed to further advance our competitive position among our peers.This year also has brought several leadership changes, including the retirementof Executive Vice President and Chief Financial Officer (CFO) Louis G. Marcocciain June. I am deeply grateful to Lou for his more than four decades of carefulfiscal stewardship on behalf of Syracuse University. I also would like to thankGwenn B. Judge for stepping in as Interim Vice President and CFO during thisperiod of transition.The University’s ability to evolve and thrive in a shifting higher education landscape is a tribute both to careful fiscal management and to deeply dedicatedemployees, including faculty and staff at every level. Together they have generated strong forward momentum. I am confident that we will grow even strongerfinancially in the year ahead.Kent Syverud2
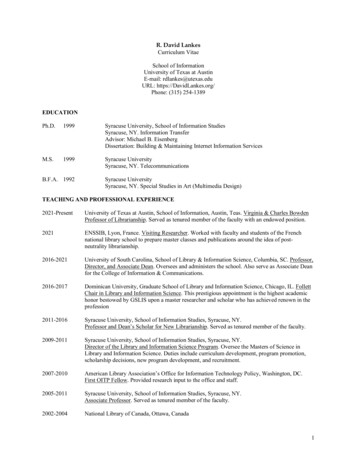
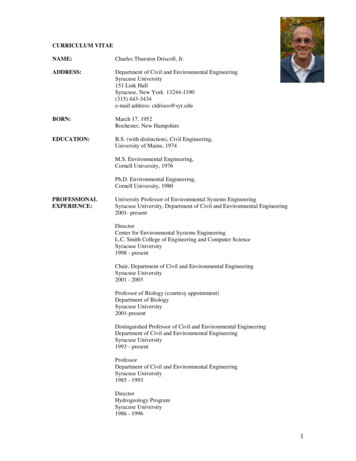
Financial ReportFiscal Year 2016 HighlightsFiscal year 2016 was another successful year of both achievement and advancementfor the University. The financial momentum and progress achieved to date providesa solid foundation for the University to pursue its goals for the future. While theUniversity is poised to invest in the future, it does so with recognition of the needfor continued prudent financial management. The University continues to focus ongenerating sufficient annual resources and controlling expenditures in support of abalanced budget. During fiscal year 2016, the University was fiscally prudent, andutilized less financial resources than planned, thereby demonstrating its commitmentto fiscal sustainability while continuing to evolve as a world-class research university.Gwenn B. JudgeInterim Vice President andChief Financial OfficerThe University experienced a year of excellent fundraising and anticipates furthergrowth in the coming years. Significant funding for capital improvements wasprovided for its facilities. Additionally, during fiscal year 2016, the Universityunveiled its draft Campus Framework plan that includes extraordinary infrastructuredevelopment that will support the University’s core mission of education, research,and a commitment to being the best university for veterans. Implementationof the Campus Framework plan will further support the University’s position ofexcellence. Major capital projects during fiscal year 2016 included the UniversityPlace Promenade, renovations to Flint Hall, McNaughton Hall, Haven Hall, ShawHall and more than 13.0 million in classroom upgrades, learning technologyenhancements, and accessibility improvements.Enrollment, Tuition and Financial AidThe University achieved a fiscal year 2016 total enrollment* of approximately21,800, an increase of 14.1% from approximately 19,100 students in fiscal year2007. The following chart illustrates the University’s continuous steady increasein enrollment from fiscal year 2007 through fiscal year 2016.TOTAL ENROLLMENTStudent 007200820092010201120122013201420152016Fiscal YearEnhancing the student experience is a continuing goal of the University. To helpachieve this goal, the University has been mindful of increases in tuition withrespect to student affordability. The following charts display the tuition increasepercentages undergraduate, Ph.D., masters and professional programs of studyfor undergraduate, graduate and law including non-credit courses from fiscal year2007 through fiscal year 2016.*Total enrollment includes students enrolled in undergraduate, Ph.D., masters and professionalprograms of study and non-credit programs and courses.4
Financial ReportFiscal year 2016 experienced the lowest tuition percentage increase in the past tenyears undergraduate, Ph.D., and masters programs of study.TUITION INCREASE PERCENTAGESUNDERGRADUATE PROGRAMSPercent 01420152016Fiscal YearTUITION INCREASE PERCENTAGESPH.D. AND MASTERS PROGRAMSPercent 01420152016Fiscal YearFiscal year 2016 Professional Programs tuition increased modestly by 2.5% after twoconsecutive fiscal years with no increases in tuition cost.10.6%TUITION INCREASE PERCENTAGESPROFESSIONAL PROGRAMSPercent 0152016Fiscal Year5
Financial ReportThe affordability of higher education can be challenging for many families and duringfiscal year 2016 resources were allocated to address financial need. The University’soverall tuition and fees discount* which includes both restricted and unrestrictedfunding has increased over the past ten years. In fiscal year 2007, the University’stuition and fees discount percentage was 35.0%, and by fiscal year 2016 the Universityhad increased its overall tuition and fees discount percentage to 37.1%.TUITION AND FEES DISCOUNT 0152016Fiscal YearC ONSOLIDA T ED St a t e m e n t s o f F i n a n c i a l P o s i t i o n H i g h l i g h t sThe Statement of Financial Position sets forth the University’s consolidated resourcesand obligations at the close of the fiscal year. Assets totaled 2.7 billion at June 30,2016. The majority of the University’s assets are comprised of its investments and netcapital assets, which represented 86.0% of assets and totaled 2.3 billion at June 30,2016. Future strategically targeted improvements to net capital assets will occur asoutlined in the Draft Campus Framework. The following chart represents assets categorypercentages at June 30 for fiscal year 2016 and for the previous four fiscal years.TOTAL ASSETS100%16.9%14.1%14.9%14.4%14.0%80%60%Other assets40.1%40.3%39.0%40.4%41.3%Capital 1445.2%44.7%20152016Fiscal Year*The overall discount includes unrestricted and restricted funded financial aid awarded to studentsenrolled in undergraduate, Ph.D., masters and professional programs of study as a percent of totalUniversity tuition and student fees.6
Financial ReportInvestments totaled 1.2 billion at June 30, 2016, a balance that remained consistentwith the June 30, 2015 balance. U.S equity and international equity balances havegrown to be larger components of the University’s total investments portfolio. Thechart below provides a summary of the University’s investments category percentagesover five fiscal years.TOTAL .2%20.2%U.S. equityInternationalequityFixed income20.2%Hedge fundPrivate equityReal 1.2%Funds held byothersFiscal YearLiabilities totaled 865.5 million at June 30, 2016 and are presented below in theorder of their anticipated liquidation, from accounts payable and accrued liabilitiesto refundable government student loan funds. The University’s long-term debtrepresented 50.9% of total liabilities. Bonds issued to fund building improvementsand new construction on campus comprised the majority of the outstanding long-termdebt at June 30, 2016. The following chart sets forth liabilities category percentagesover five fiscal years.TOTAL ts & deferredrevenuesAsset retirementobligationsAccrued postretirementbene fit obligation40%53.0%53.6%55.3%54.0%50.9%Capital lease obligationInterest rateswap agreements20%0%Accounts payable &accrued liabilities3.5%20123.6%20133.2%2014Fiscal Year3.2%20153.2%2016Long term debtRefundable governmentstudent loan funds7
Financial ReportC ONSOLIDA T ED St a t e m e n t s o f Act i v i t i e s H i g h l i g h t sThe Statement of Activities is a summary of the revenues, expenses and otheritems for the fiscal year, classified according to the existence or absence of donorrestrictions. Total revenues for the fiscal year ended June 30, 2016 increased by 2.8%to 944.0 million, principally resulting from increases in revenues from net tuition andfees and contributions, excluding contributions to endowments.Net tuition and fees combined with auxiliaries revenues accounted for 78.6% of totalrevenues. Net tuition and fees totaled 522.6 million in fiscal year 2016, whichrepresented 55.4% of total revenues, compared to 500.3 million and 54.5% oftotal revenues in fiscal year 2015. Auxiliaries revenues, which include revenues fromstudent housing, food service, athletics, bookstore, and the steam station facilitytotaled 219.1 million in fiscal year 2016, a decrease of 4.7 million from fiscal year2015. The following chart illustrates a summary of the components of total revenuesover five fiscal years.TOTAL .5%23.5%24.4%23.2%Auxiliaries net offinancial 4%8.4%6.2%Investment return,including distributionsfrom endowments8.0%Grants and ons,excludingcontributions toendowmentsNet tuition and fees0%20122013201420152016Fiscal YearExpenses increased 3.3%, from 876.3 million in fiscal year 2015 to 905.1 millionin fiscal year 2016. The following chart summarizes the distribution of expenses forthe most recent five fiscal years. Instruction and departmental research expensescontinued to comprise the majority of the University expenses and have remainedat 39.4%. Under the guiding principles of the University’s Operational ExcellenceProgram, the University will continue to identify administrative services that can beprovided more efficiently. In the coming year, strategic procurement will be a focus,leveraging economies of scale with the goal of obtaining costs savings and higherquality services.8
Financial ReportTOTAL 3%20.6%20.5%Institutional support11.3%11.4%11.9%7.0%Student 201220132014201520167.4%Academic supportSponsored researchand other programsInstruction anddepartmentalresearchFiscal YearTotal other changes in net assets were negative ( 57.1) million for the year endedJune 30, 2016. Contributions to endowments were 24.9 million. Endowments return,excluding distributions from endowments were negative ( 37.9) million. Changes infair values of interest rate swap agreements, foreign currency forward contracts, andfunds held or administered by others were negative ( 30.9) million. Postretirementbenefit obligation changes other than net periodic cost were negative ( 9.7) million,and other was negative ( 3.4) million. The following chart illustrates a summary of thecomponents and dollar amounts of other changes over five fiscal years.TOTAL OTHER (in millions of dollars)Contributionsto endowments 150 3.7 6.0 100 40.3 50 0 16.7 6.1( 45.1) 19.2 1.5 102.4 46.6( 4.8)( 1.5)( 3.0)( 63.9)( 150) 15.6( 30.8)( 15.1)( 1.8)( 5.6)( 50)( 100)Other 24.9( 37.9)( 30.9)( 9.7)( 3.4)( 6.1)201220132014Fiscal Year20152016Postretirementbenefit obligationchanges other thannet periodic costChanges in fair valueof interest rateswap agreements,foreign currencyforward contracts,and funds held oradministered by othersEndowments return,excluding distributionsfrom endowmentsFiscal year 2016 total investment return, which includes both investment return,including distributions from endowments and endowments return, excludingdistributions from endowments was 0.8% in fiscal year 2016, compared to 1.4% infiscal year 2015. Like many institutions, the University experienced minimal returnsduring both fiscal year 2016 and 2015. The chart below provides a summary of theUniversity’s total investment return over five fiscal years.9
Financial ReportTOTAL INVESTMENT RETURN (in millions of dollars) 200 13.6 50.3 100 50 0( 50)( 100)Interest anddividends 13.7 150 9.7 21.6 72.4 68.5Realized gains(losses) 16.3 71.3 74.9 16.8 22.0Unrealized changesin fair values( 25.3)( 69.9)( 87.8)20122013201420152016Fiscal YearC ONSOLIDA T ED St a t e m e n t s o f C a s h F l o w sIn fiscal year 2016 there was a decrease in cash and cash equivalent amounts ofapproximately 5.6 million. The components of the change were net cash provided byoperating activities of 66.4 million; net cash used in investing activities of ( 100.2)million; and net cash provided by financing activities of 28.2 million.The University’s ability to manage financial risks and opportunities is very importantin achieving the aspiration to be a pre-eminent and inclusive student-focused researchinstitution. We thank you for your continued support.RecognitionThe University’s Business, Finance, and Administrative Services division continuesto operate by applying sound business and financial judgment, practices, and ethicalstandards. That conduct, along with the collaborative support and service efforts ofthe division, are important factors in support of the University’s vision and mission.Principal providers of financial leadership services were Comptroller Jean B. Gallipeau;Associate Comptroller Michael A. Paparo; Budget and Planning Interim Director CynthiaL. Carnahan; Treasurer David J. Smith; Associate Treasurer Scott C. Kemp; and Auditand Management Advisory Services Director Stephen G. Colicci.Gwenn B. JudgeInterim Vice President and Chief Financial Officer10
St a t e m e n t o f R e s p o n s i b i l i tyManagement is responsible for the preparation, integrity andobjectivity of the consolidated financial statements of SyracuseUniversity. The statements have been prepared in accordance with U.S.generally accepted accounting principles, and include certain estimatesand judgments that affect the reported amounts of assets and liabilitiesand disclosures of contingent assets and liabilities at the date of theconsolidated financial statements. Management fulfills its responsibilityprimarily by establishing and maintaining an internal control structurethat is designed to provide reasonable assurance that the University’sassets are safeguarded, transactions are executed in accordance withmanagement’s authorization, and that the University’s financial recordsmay be relied upon for the purpose of preparing financial statements andrelated disclosures. That system is monitored and assessed by directmanagement review and by the University’s Audit and ManagementAdvisory Services department. In addition, the University recognizesits responsibility for conducting its affairs according to the higheststandards of personal and corporate conduct. This responsibility ischaracterized and reflected in key policy statements issued from time totime regarding, among other things, conduct of its business activities,a code of ethics for the University’s senior financial officers, and disclosure andmanagement of potential conflicts of interest by its trustees and employees. Accordingly,the University maintains programs to assess compliance with those policies.The University’s Board of Trustees Audit Committee appointed KPMG LLP as its independentauditors to audit the University’s consolidated financial statements. Their accompanyingreport is based on audit procedures conducted in accordance with auditing standardsgenerally accepted in the United States of America, which include the consideration ofthe University’s internal controls to establish a basis for determining the nature, timing,and extent of audit tests to be applied. The independent auditors were given unrestrictedaccess to financial records and related data, including minutes of trustees meetings.The Audit Committee of the Board of Trustees, which consists of trustees who are neitherofficers nor employees of the University, is responsible for the oversight of the workperformed by the independent auditors, oversight of the work performed by the Auditand Management Advisory Services department, as well as overseeing the University’sinternal control systems and financial reporting processes. The Audit Committee meetswith financial management, the independent auditors, and the director of the Auditand Management Advisory Services department to review financial reporting, internalaccounting controls, and auditing matters. Both the independent auditors and the directorof the Audit and Management Advisory Services department have direct and privateaccess to the Audit Committee.Kent Syverud Gwenn B. JudgeChancellor and President Interim Vice President andChief Financial Officer11
Independent Auditors’ ReportKPMG LLP515 BroadwayAlbany, NY 12207-2974KPMG LLP515 BroadwayAlbany, NY 12207-2974Independent Auditors’ ReportIndependent Auditors’ ReportThe BoardBoard ofof TrusteesTrusteesTheSyracuseUniversity:Syracuse University:Independent Auditors’ ReportWe havehave idatedfinancial statementsof SyracuseofUniversity(the University),which theWefinancial statementsSyracuse University,which esconsolidatedof financial position as of June 30, 2016 and 2015, the related consolidated statements ofTheBoardofstatementsTrusteesand cashflowsfor flowsthe yearsthenyearsended,andthe relatednotesto thefinancialactivitiesandcashfor thethenended,and therelatednotesto the statements.consolidated financial statements.Syracuse University:Management’s ResponsibilityResponsibility forfor thethe ConsolidatedFinancial StatementsManagement’sFinancial StatementsWe have auditedthe accompanyingstatementsSyracuse UniversityUniversity),whichManagementis responsiblefor the financialpreparationand fairofpresentationof these (thefinancialstatementsinManagementis responsiblefor thepositionpreparationandfairpresentationof statementsofactivitiesaccordance with U.S. generally accepted accounting principles; this includes the design, inciples;thisincludesthe design, implementation, andandflowswithforoftheyearsthenended,and accountingtherelatednotestoandthe fairfinancialstatements.and cashmaintenanceinternalcontrolrelevantto thepreparationpresentationof financial statementsmaintenance of internal control relevant to the preparation and fair presentation of consolidated financial statementsthat are free from material misstatement, whether due to fraud or error.Management’sResponsibilityfor the Financialthatare free frommaterial misstatement,whether Statementsdue to fraud or error.Auditors’ResponsibilityManagementis responsible for the preparation and fair presentation of these financial statements inAuditors’Responsibilityaccordancewith U.S.acceptedprinciples;this ityis togenerallyexpress anopinionaccountingon these financialstatementsbased onaudits.We conductedOurresponsibilityto expressan ntsbasedonourThoseaudits. Weandmaintenanceofisinternalto thepreparationand fairpresentationof financialstatementsour auditsin eptedin ptedintheUnitedStatesofAmerica.standards require that we plan and perform the audit to obtain reasonable assurance about whether ial statements are free from material misstatement.Auditors’ Responsibilityconsolidated financial statements are free from material misstatement.An audit involves performing procedures to obtain audit evidence about the amounts and disclosures in theOur responsibility is to express an opinion on these financial statements based on our audits. We conductedAnaudit statements.involves about theincludingamounts theandassessmentdisclosuresfinancialThe proceduresselectedtodependthe auditors’of in theour audits in accordance with auditing standards generally accepted in the United States of America. esselected whetherdepend dueon tothefraudauditors’judgment,the risks of materialmisstatementthe financialstatements,or error.In makingincludingthose thestandards require that we plan and perform the audit to obtain reasonable assurance about whether therisk assessments,the auditorsconsiderinternalof controlrelevant financialto the entity’spreparationfairassessmentof the risksmaterialmisstatementthe consolidatedstatements,whether anddue tofraud orfinancial statementsare offreefrom materialmisstatement.presentationof thefinancialstatements thein auditorsorder to considerdesign auditproceduresthat are toappropriatetheerror.In makingthoserisk assessments,internalcontrol relevantthe notpurpose offinancialexpressingan ty’sinternalAn auditinvolvesproceduresto obtainauditevidencethe amountsandinappropriatetheandfair presentationof forthe theconsolidatedstatementsin orderto designaudit proceduresthat arecontrol.Accordingly,we proceduresexpressno selectedsuch opinion.Anonauditalsoincludesthe appropriatenessfinancialstatements. Thedependthe anauditors’judgment,includingtheinthe circumstances,butnot for thepurposeof expressingopinionon evaluatingthe effectivenessofassessmentthe hosecontrol. Accordingly, we express no such opinion. An audit also includes evaluating the y’spreparationandfairas wellaccounting policies used and the reasonableness of significant accounting estimates made by management,presentationofthefinancial statementsin consolidatedorder to designauditstatements.procedures that are appropriate in theasthetheoverallthefinancialWeevaluatingbelieve thatauditpresentationevidence weofhaveobtained is sufficientand appropriate to provide a basis for ourcircumstances, but not for the purpose of expressing an opinion on the effectiveness of the entity’s internalauditbelieveopinion.Wethat the auditevidencenowehaveobtainedsufficientand appropriateto theprovidea basis for ourcontrol. Accordingly,we expresssuchopinion.Anisauditalso includesevaluatingappropriatenessof ent,Opinionas well as evaluating the overall presentation of the financial statements.OpinionIn our opinion, the financial statements referred to above present fairly, in all material respects, the financialWebelievethat the auditevidenceweJunehave30,obtainedis sufficienta basisforcashourpositionof SyracuseUniversityas of2015 and2014, andandtheappropriatechanges in toitsprovidenet assetsand ,theaudit opinion.flowsfor the years then ended in accordance with U.S. generally accepted accounting principles.consolidated financial position of Syracuse University as of June 30, 2016 and 2015, and the changes in its netOpinionassetsand its cash flows for the years then ended in accordance with U.S. generally accepted accounting principles.In our opinion, the financial statements referred to above present fairly, in all material respects, the financialposition of Syracuse University as of June 30, 2015 and 2014, and the changes in its net assets and its cashflowsfor2015the years then ended in accordance with U.S. generally accepted accounting principles.July 29,July 28, 2016July 29,122015KPMG LLP is a Delaware limited liability partnership,the U.S. member firm of KPMG International Cooperative(“KPMG International”), a Swiss entity.
C ONSOLIDA T ED St a t e m e n t s o f F i n a n c i a l P o s i t i o nJune 30, 2016 and 2015(Thousands of dollars)20162015AssetsCash and cash equivalents Interest rate swap agreements collateralReceivables, netOther assetsInvestmentsFunds held by bond trusteeLand, land improvements, buildings, equipment, and collections, netTotal assets135,157 ,1301,204,02911,78049,2811,109,8681,075,920 2,685,449 2,665,146 146,997 139,922Liabilities and Net AssetsLiabilities:Accounts payable and accrued liabilitiesDeposits and deferred revenues61,68164,463Asset retirement obligations21,77424,848Accrued postretirement benefit obligation54,88641,989Capital lease obligation3,0483,151Interest rate swap agreements108,74079,252Long-term able government student loan fundsTotal liabilitiesNet assets:1,188,2301,223,184Temporarily restrictedUnrestricted195,888202,586Permanently restricted435,846412,4221,819,9641,838,192Total net assetsTotal liabilities and net assets 2,685,449 2,665,146See accompanying notes to consolidated financial statements.13
C ONSOLIDA T ED St a t e m e n t s o f Act i v i t i e sYear ended June 30, 2016With Comparative Totals for the Year ended June 30, 2015(Thousands of lyrestricted2016total2015totalRevenues:Tuition and fees Less financial aidNet tuition and fees830,285 830,285 8,08246,23179,75282,32851,38952,105Contributions, excludingcontributions to endowments43,070Grants and contracts 15,01279,752Investment return, includingdistributions from endowments51,579(190)Auxiliaries, net of financial aid of 6.8 million in 2016219,100219,100223,821Otherand 6.4 million in 201513,04013,04013,671Net assets released from l revenues(13,533)942,6961,289Expenses:Instruction and departmentalresearch356,731Sponsored research and otherprogramsAcademic supportStudent 67066,67061,713Institutional )Total expensesIncrease in net assets from revenuesand expenses37,5481,289Other changes in net assets:Contributions to endowments 24,890Endowments return, excludingdistributions from endowments(31,171)(7,237)(28,946)(631)496Changes in fair values of interestrate swap agreements, foreign currency forwardcontracts, and funds held or administered by others(1,388)Postretirement benefit obligationchanges other than net periodic al other changes in net se) increase in net ,4221,838,1921,833,648195,888 435,846 1,819,964 1,838,192Net assets at beginning of year1,223,184Net assets at end of year 1,188,230See accompanying notes to consolidated financial statements.14
C ONSOLIDA T ED St a t e m e n t o f Act i v i t i e sYear ended June 30, 2015(Thousands of lyrestricted2015totalRevenues:Tuition and fees Less financial aidNet tuition and fees794,556 294,259294,259500,297Contributions, excluding contributions to endowments33,771Grants and contracts82,328794,556500,297 12,46046,23182,328Investment return, includingdistributions from endowmentsAuxiliaries, net of financial aid of
fiscal year 2016 resources were allocated to address financial need. the university's overall tuition and fees discount* which includes both restricted and unrestricted funding has increased over the past ten years. in fiscal year 2007, the university's tuition and fees discount percentage was 35.0%, and by fiscal year 2016 the university