Transcription
WICHE INSIGHTSMay 202 0wiche.eduColleen Falkenstern, Research AnalystTuition and Fees, Appropriations, and Financial Aidin the West: Strategic Alignment in Times of UncertaintyIntroductionThe COVID-19 crisis has presented unprecedentedchallenges for higher education, includingsignificant fiscal impacts for states, institutions,and individuals. The economic implications ofthe COVID-19 crisis are already impacting stateand institution budgets, suggesting that statesand institutions will be forced – at least in thenear term – to address affordability concernsunder severe fiscal constraints. Doing so willrequire close attention to aligning tuition, stateappropriations, and financial aid.This edition of WICHE Insights discusses themost recent results of the Western InterstateCommission for Higher Education’s (WICHE)annual survey of tuition and fees at publicpostsecondary institutions in the West, along withrecent trends in state appropriations and statefinancial aid. And while the trends discussed inthis brief highlight the positive fiscal outlook ofthe past several years, the COVID-19 crisis andresulting economic downturn suggests that thedismal economic outlook will present significantchallenges for how states address key priorities,including addressing affordability. Across theWest and the nation, a variety of affordabilityrelated definitions and benchmarks have beenput forward; however, data gaps and limitationsremain a significant challenge in defining andassessing affordability. Looking ahead, as statesmove forward in meeting goals and prioritiesunder bleak economic conditions, it is imperativethat states strategically align appropriations,tuition, and financial aid in a manner thatadvances states’ progress in addressingaffordability.Key Takeaways Regional average tuition and fees for residentundergraduates at public four-year institutionswere 9,759 in 2019-20, a 2.1 percent increasefrom 2018-19. Regional average in-district tuition and fees attwo-year institutions increased 3.1 percent from2018-19 to 4,025 in 2019-20. Regional average appropriations per studentincreased 4.8 percent between FY 2018 and FY2019, a higher rate of increase than the nationalaverage. State financial aid per student was slightly lowerthan the national average in 2017-18, but theshare of need-based aid was well above thenational average. States undertook efforts to address affordabilitybut face data limitations for assessingaffordability. The dismal economic outlook as a result ofthe COVID-19 crisis makes it imperative thatstates strategically align state finance policies toadvance affordability efforts.Tuition and Fees in the WestWICHE’s annual survey of tuition and fees collects theresident and non-resident tuition and fees rates atpublic two- and four-year institutions in the WICHEregion for undergraduate and graduate students. Themost recent survey was administered in the summerof 2019 to state higher education executive offices,system offices, and institutions in the each of the 17states and territories in the region.1 Complete datafrom the survey are available at wiche.edu/pub/tf and
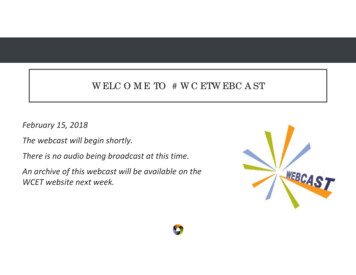
WICHE INSIGHTS / 2Alignment of Appropriations, Tuition, and Financial AidIt is important to view the state finance policy environment as an integrated approach to meeting state goalsthrough the alignment of appropriations, tuition, and financial aid. Which is to say, although the decision-makingauthority of each of these policy levers differs across states, it is important that decisions in one area (i.e., tuition)are made in a way that aligns with others (i.e., state fiscal support, through appropriations to institutions and grantaid to students). This is particularly true for a state’s approach to addressing affordability, as unaligned policiescan have implications for a student’s ability to afford and access higher education. For example, if an institution’stuition rises as state fiscal support decreases, without appropriate levels of state grant aid, students—particularlythose who are low-income—may be unable to afford a postsecondary education. This has both individualconsequences in terms of employment and income benefits, and broad implications for a state’s ability to meetworkforce demands.enable comparisons in rates over time, across statesand territories, and between Carnegie Classifications.Unless otherwise indicated, tuition and fees ratesare in current dollars and state- and regionalaverage rates are weighted by full-time equivalent(FTE) enrollment.2 Data on the website provide bothweighted and unweighted averages.3Tuition and Fees at Public Four-YearInstitutionsRegional average tuition and fees for residentundergraduates at public four-year institutionswere 9,759 in 2019-20, an increase of 204(2.1 percent) from 2018-19 and, when adjustingfor inflation, the regional average tuition and feesdecreased by 15 in the past year.4 The 2019-20regional average tuition and fees were about 6.5percent lower than the national average ( 10,440)and increased at about the same rate in the past yearas the national average (2.3 percent).5 Since 2014-15,tuition and fees for resident undergraduates haveremained relatively stable and increased just 1.6percent ( 151; constant 2019 dollars), which is lowerthan the national average rate of change (3.0 percent)over the past five years. In the past decade, tuitionand fees increased 27.7 percent ( 2,116; constant2019 dollars), with over 90 percent of the nominalincrease occurring in the first half of the past decade.The regional average provides a baseline for thetypical rates charged to resident undergraduatesin the region, but it masks the wide range in stateaverage tuition and fees in 2019-20. As shown inFigure 1, state average tuition and fees for residentundergraduates varied from 5,581 (Wyoming) to 11,689 (Arizona) in 2019-20.6 There was also widevariation in tuition and fees rates across systemsand institutions. For example, in 2019-20, tuitionand fees at institutions in the University of Californiasystem averaged 14,024, almost 4,300 higherthan the state average and 2,300 higher than thehighest state average in the region. On the otherhand, tuition and fees at institutions in the CaliforniaState University system averaged 7,360, or nearlyhalf the average of the University of California system.Although no other state had a comparable differencein rates between systems, most states had variabilityFigure 1. Resident Undergraduate Tuition and Feesat Public Four-Year Institutions, 2019-20 11,689ArizonaColorado 11,206Oregon 11,175 10,917Hawai‘i 10,293Washington 9,759WICHECalifornia 9,758North Dakota 9,327South Dakota 9,257Alaska 8,146Idaho 7,996Nevada 7,954New Mexico 7,426Utah 7,142Montana 7,087Guam 7,064Wyoming 5,581 0 2,000 4,000 6,000 8,000 10,000Detailed tuition and fees and state finance data available from wiche.edu/pub/tf 12,000
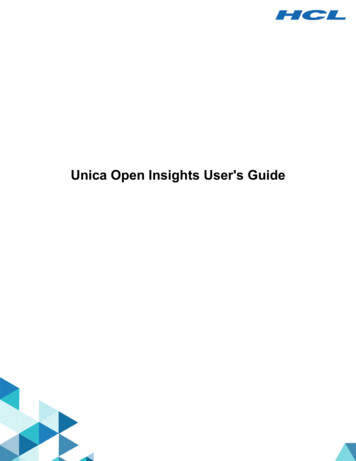
WICHE INSIGHTS / 3in tuition and fee rates across specific institutions.For example, tuition and fees at Colorado School ofMines, which had the region’s highest tuition andfees rates in 2019-20, were more than two times theresident undergraduate rates at Colorado MountainCollege and Fort Lewis College.Although the regional average tuition and feesfor resident undergraduates at public four-yearinstitutions increased just 2.1 percent between 201819 and 2019-20, the annual change in the states andterritories ranged from no change at the Universityof Guam to an average 8.0 percent increase in NorthDakota (Figure 2). Among the states that had a changein average tuition and fees, four states had a rate ofincrease below the regional average, ranging froma 0.6 percent increase in California to a 1.9 percentincrease in Colorado. Most states had an annualincrease between 3.4 percent and 5.5 percent. Thelarge increase in North Dakota reflects a per-creditrate increase in the last year as well as changes to thetuition model at several institutions in the state.7Figure 2. Change in Resident UndergraduateTuition and Fees at Public Four-Year Institutions,2018-19 to 2019-205.1%3.6%Above 03.4%5.3%3.4%2.9%1.9%0.6%CNMIN/AFigure 3. Percent Change in Resident and Non-ResidentUndergraduate Tuition and Fees at Public Four-YearInstitutions since 2009-1010%WICHE average2.1%Below Avg.of non-resident and resident rates was about thesame; however, the two rates had different trendsover the past decade. As shown in Figure 3, whenadjusting for inflation, average non-resident tuitionand fees increased 15.4 percent in the past 10years, which is significantly lower than the rate ofincrease of resident tuition and fees (27.9 percent)during the same time period. Although, as residenttuition and fees rates stabilized and increasedby just 1.8 percent over the past five years, nonresident rates increased 6.3 percent since 2014-15(constant 2019 dollars).3.0%4.2%Guam0.0%Resident and Non-Resident UndergraduateTuition and Fees in the Past DecadeRegional average tuition and fees for non-residentundergraduates were 27,273 in 2019-20, anincrease of 2.4 percent ( 651) compared to theyear prior. In the past year, the annual increaseTuition and Fees at Public Two-YearInstitutionsAverage tuition and fees for resident, in-districtstudents at two-year institutions in the WICHEregion (excluding California and Alaska) were 4,025 in 2019-20, an increase of 123 (3.1percent) over 2018-19 rates.8 When includingCalifornia, the regional average was 2,235 in 201920, an increase of just 31 compared to 2018-19. Theregional average (including California) was well belowthe national average in 2019-20 and increased at alower rate than the national average (2.8 percent) inthe past year.When adjusting for inflation, average tuition andfees for in-district students in the region (excludingCalifornia and Alaska) increased 236 (6.2 percent)Detailed tuition and fees and state finance data available from wiche.edu/pub/tf
WICHE INSIGHTS / 4over the past five years and 856 (27.0 percent)since 2009-10. It is also important to note that whenincluding California in the regional average, tuitionand fees decreased by 81 (3.5 percent; constant2019 dollars) since 2014-15.Figure 5. Change in In-District Tuition and Feesat Public Two-Year Institutions,2018-19 to 2019-20WICHE average 1.4%N/AFigure 4. In-District Tuition and Feesat Public Two-Year Institutions, 2019-20South Dakota5.1% 4,996Colorado 4,783WashingtonHI2.5% 4,567Idaho 4,182Wyoming 4,179Montana 4,040CNMI 4,038WICHE - w/o CA 4,025Hawai‘i 4,018Utah 3,909Nevada 3,542Guam 3,414Arizona2.3%0.3%0.8%1.4%Note: See endnote 6.In-District and Non-Resident UndergraduateTuition and Fees in the Past Decade 1,380 028.7%Guam0.0% 1,789California4.2%CNMI0.0% 2,235New Mexico2.8%0.0%0.0% 2,641WICHE3.9%2.4% 5,624North DakotaAbove Avg.WICHE w/o CA 3.2%2.8% 7,239OregonBelow Avg. 2,000 4,000 6,000 8,000State average tuition and fees for in-districtundergraduates at two-year institutions rangedfrom 1,380 in California to 7,239 at South Dakotatechnical colleges (Figure 4). Between 2018-19 and2019-20, four states or territories had no annualchange in average tuition and fees – California, Guam,Commonwealth of the Northern Mariana Islands, andIdaho -- while two additional states had an increaseof less than 1 percent – Colorado and Arizona (Figure5). Six states had an increase between 1.5 and 3.0percent and three states had an increase between3.9 and 5.1 percent. Lastly, average tuition and fees inWyoming increased 28.7 percent, although this wasthe result of a policy change that resulted in averagetuition and fees being calculated at 15 credit hourswhen previous years were calculated at 12 credithours. If average tuition and fees were based on 12credit hours, the average increase in tuition and feesat Wyoming community colleges would have been 2.9percent between 2018-19 and 2019-20.9In the decade between 2009-10 and 2019-20,average tuition and fees for in-district undergraduatesin the region increased 27.0 percent (constant 2019dollars), excluding California and Alaska. However,when including California, tuition and fees increasedat a higher rate, 32.1 percent, over the same tenyears (Figure 6). These trends are due in part tothe impact of California two-year institutions, whichenroll nearly two-thirds of the region’s public twoyear college students. In-district tuition and feesat California’s two-year colleges increased by 61.2percent between 2009-10 and 2014-15 but havesince remained the same, and tuition and fees in theregion (including California) have remained flat as aresult. Both regional averages for in-district students,including and excluding California, increased at amuch higher rate than for out-of-district studentsover the past decade (Figure 6).Detailed tuition and fees and state finance data available from wiche.edu/pub/tf
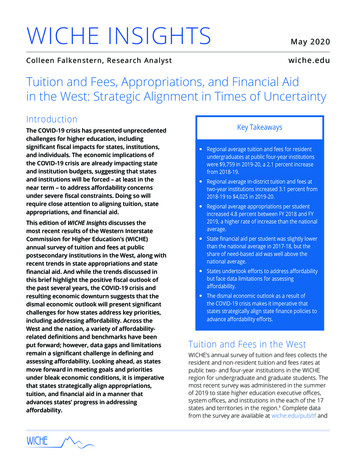
WICHE INSIGHTS / 5Figure 6. Percent Change in In-District and Non-ResidentUndergraduate Tuition and Fees at PublicTwo-Year Institutions since rict, WICHEIn-District, WICHE (w/o CA)Nonresident, WICHENonresident, WICHE (w/o CA)0%-10%2009-102014-152019-20State Fiscal SupportThe recent moderate increases in tuition and feesappear to suggest increased revenue for highereducation over the past five years. However, tuitionand fees are just one component of state highereducation finance and should be viewed anddiscussed in conjunction with the other components-- state appropriations and state financial aid. Two keydata sources – the State Higher Education ExecutiveOfficers Association’s annual State Higher EducationFinance (SHEF) report and the annual Grapevine surveyof state fiscal support for higher education – offertwo views of current state fiscal support for highereducation. There are two key differences in how thedata sources are presented in this brief: SHEF reportson higher education appropriations for public highereducation through the prior fiscal year (FY 2019)and allows for appropriations to be calculated perstudent; while the results from Grapevine includeall state support, including that for private highereducation, through the most recent fiscal year (FY2020), but do not include per-student computations.And while both of these data sources provide insightinto the recent past in terms of state financing,current circumstances suggest that the recentincreases in state support for higher education maynot continue in the coming fiscal years.State Higher Education Finance (SHEF):FY 2019 Survey ResultsAccording to the recently released data from the SHEFreport, FY 2019 state appropriations in the UnitedStates continued the trend of the past five fiscalyears, with a moderate one-year increase in bothtotal appropriations and appropriations per student.Nationally, appropriations per student were 8,196in FY 2019, an increase of 2.4 percent compared toFY 2018.10 Total educational revenue per student,which includes tuition revenue in addition to stateappropriations, was lower in the WICHE region in FY2019 ( 12,943) compared to the nation ( 15,018).State fiscal support in the WICHE region, however,appeared to fare better than the national averageas state appropriations per student in the Westincreased 4.8 percent between FY 2018 and FY2019 and were 8,297 in FY 2019. Appropriationsper student in the region ranged from 4,653(Colorado) to 18,960 (Wyoming) in FY 2019(Figure 7).11Figure 7. Educational Revenues per FTE, FY 2019AppropriationsTuition Revenue 18,960Wyoming 4,047 16,164Alaska 5,639 14,698Hawai‘i 5,032 8,679North Dakota 9,404South Dakota 6,397 9,918Oregon 6,703 8,883 11,922New Mexico 4,653Colorado 8,196US 9,983Idaho 6,427Montana 7,688Utah 5,247Arizona 3,583 10,572 6,902 4,286 7,732 5,996 8,228WICHE 8,297 4,646Nevada 8,179 4,741 7,424Washington 9,078California 0 5,000 5,430 2,432 10,000 15,000 20,000 25,000Source: State Higher Education Executive Officers Association. See endnote 10.Appropriations per student serves as a good measurefor understanding how states are meeting highereducation demand, but do not always depict theunderlying trends in state appropriations and FTEenrollment. For example, enrollment stayed relativelythe same in the WICHE region between FY 2018 andFY 2019, and as a result the one-year percentageDetailed tuition and fees and state finance data available from wiche.edu/pub/tf
WICHE INSIGHTS / 6increase in total appropriations (4.7 percent) wasabout the same as the increase in appropriationsper student (4.8 percent). Ten states in the regionexperienced enrollment decreases between FY 2018and FY 2019, and in many of these states that meantappropriations per student increased at a higherrate than total appropriations. And in some states,like North Dakota, total appropriations decreased2.1 percent between FY 2018 and FY 2019, butdue to a 3.7 percent decrease in FTE enrollment,appropriations per student increased 1.7 percent.On the other hand, in states like Idaho and Utah,which had among the highest enrollment increasesin the region in the past decade, total appropriationincreases in the past fiscal year were not able to keepup with strong enrollment increases. In both states,the rate of increase in appropriations per studentwas much lower than the rate of increase of totalappropriations between FY 2018 and FY 2019(Table 1).12(Table 1).13 The effects of the economy on statebudgets also impacted the distribution of educationrevenues over the past decade. Between FY 2009 andFY 2012, appropriations per student decreased 21.3percent and tuition revenue per student increased33.7 percent in the WICHE region. As a result of therapid increases in tuition revenue and significantdecreases in state support during the first part of thepast decade, tuition revenue increased as a share ofall higher education revenue from 27.6 percent to39.3 percent between FY 2009 and FY 2012. SinceFY 2014, increases in appropriations in the regionoutpaced tuition revenue and the share of revenuefrom tuition decreased from 39.0 percent to 35.9percent. Additionally, the share of revenue fromtuition has decreased in nine WICHE states since FY2014. In FY 2019, tuition revenue ranged from 69percent of all revenue in Colorado to 18 percent oftotal revenue in Wyoming.14Grapevine ResultsTen years ago, state appropriations, nationallyand regionally, were in a period of decline as staterevenues were greatly impacted by the GreatRecession. And while regionally, appropriations andappropriations per student have surpassed FY 2009levels, about half of the states had lower levels ofstate fiscal support in FY 2019 compared to FY 2009The results from the FY 2020 Grapevine compilation ofstate fiscal support for higher education suggests thatincreases in state support continued into the mostrecent fiscal year (FY 2020).15 Nationally, state fiscalsupport for all higher education increased 5.0 percentbetween FY 2019 and FY 2020 and topped 96.6Table 1. Percent Change in Total Appropriations, Enrollment, and Appropriations Per StudentFY 2018 to FY 2019TotalAppropriationsAppropriationsper FTEFY 2009 to FY 2019TotalAppropriationsFTEAppropriationsper %0.0%Nevada2.5%1.7%0.8%-16.6%-22.8%8.1%New Mexico2.9%7.8%-4.5%4.0%16.4%-10.6%North 1.8%10.1%13.0%-2.5%South urce: State Higher Education Executive Officers Association. See endnote 11.Detailed tuition and fees and state finance data available from wiche.edu/pub/tf
WICHE INSIGHTS / 7billion in FY 2020 (Figure 8). In the WICHE region,which accounted for 28.8 percent of the nation’sstate higher education support in FY 2020, statefiscal support increased 6.6 percent between FY2019 and FY 2020, which was about 30 percenthigher than the national average rate of increase.Figure 8. Percent Change in State Supportfor Higher Education, FY 2018 to FY a6.4%North Dakota5.9%New Mexico5.4%US5.0%South 3%Hawai‘iAlaska0%5%10%15%Source: Illinois State University Center for the Study of Education Policy and State HigherEducation Executive Officers Association, Grapevine, 2020. See endnote 16.As shown in Figure 8 there was considerable variationin the annual change in state fiscal support in thelast fiscal year. In two states, fiscal support increasedby over 10 percent (Colorado and Utah), while moststates had an annual increase between 5.0 and9.5 percent. Additionally, total state fiscal supportdecreased in Hawai’i and Alaska by 2.2 and 11.2percent, respectively. The annual increase betweenFY 2019 and FY 2020 for the region and most WICHEstates was higher than the most recent fiscal years.For example, in the WICHE region annual increases instate support the past two fiscal years were 3.1 and4.4 percent.16Although it is too soon to know for certain the fullextent of the economic impact of the COVID-19pandemic on state budgets, anecdotal reportsindicate that states and territories – including thosein the WICHE region – will face significant budget cutsin the coming fiscal year. How these impacts will beoffset by potential federal stimulus remains to beseen, as well. Initial federal legislation has providedsome funding to offset institutional revenue declinesand further federal efforts currently seem likely.State Financial AidState financial aid plays a crucial role in promotingaccess to postsecondary education and incentivizingstudent success for the intended target populationof students who are eligible to receive such aid.When in alignment with the other components ofstate finance -- appropriations and tuition and fees-- state financial aid can be used as a policy leverto promote affordability. Across the WICHE region,state financial aid programs are developed andimplemented in vastly different ways, both in termsof the amount of aid provided and the criteria underwhich students are eligible to receive it. The NationalAssociation of State Student Grant and Aid Programs(NASSGAP) provides a comprehensive review of stateaid awarded, including aid awarded to undergraduateand graduate students by type of aid. For the purposeof this brief, all aid discussed is for undergraduatestudents only.Nationally, between 2012-13 and 2017-18, astuition and fees stabilized and state fiscal supporthad moderate year-over-year gains, state grantaid per undergraduate increased year-over-year,including a 6.1 percent increase between 2016-17and 2017-18 (the most recent year with availablestate grant aid data).17 In the WICHE region, stategrant aid per student has increased each yearsince 2009-10, including an annual increase of 5.0percent in 2017-18. In 2017-18, state grant aid perundergraduate in the WICHE region was 876, whichwas 9 less than the national average ( 885) in thatyear (Figure 9). However, it is important to note thatin only four of the 15 WICHE states for which thereis comparable data, higher amounts of aid wereawarded per student than the national and regionalaverages – Washington ( 1,323), California ( 1,279),New Mexico ( 986), and Alaska ( 979). Aid per studentin the other nine states averaged 273 in 2017-18,well below the regional and national averages.18WICHE states also vary in the disbursement of stateaid based on need. On average, 95.0 percent ofall state aid awarded in the region in 2017-18 wasneed-based aid, which is substantially higher than thenational average (75.4 percent). Eight states in theregion awarded at least 95 percent of undergraduateaid on the basis of need. On the other hand, less thana third of state aid to undergraduates was awardedbased on need in four states.19 Between 2007-08 andDetailed tuition and fees and state finance data available from wiche.edu/pub/tf
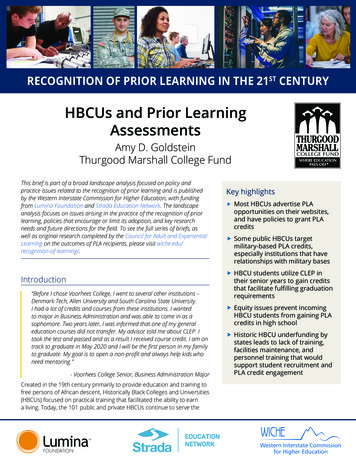
WICHE INSIGHTS / 8Figure 9. State Grant Aid per Student, 2017-18 1,400 46 1 1,200 1,000 44 800 600 218 1,277 1,279 734 638 0 832 400 667 200 0 252WACANM 25 441 211 547 518 341 264 159AKUSWICHENVNeed-Based AidORCOND 3 0 153 5 140 113 0 78SDIDHIAZ 52 10UT 0 12MTNon-Need-Based AidSource: National Association of State Student Grant and Aid Programs. See endnote 17.2017-18, the share of total state aid awarded basedon need in the WICHE region remained relatively thesame, from 92.6 percent in 2007-08 to 95.0 percentin 2017-18, but there have been different trends inthe way that states awarded aid since 2007-08. Forexample, in 2007-08 need-based aid was 100 percentof grant aid in Alaska and 84.5 percent of aid in Utah.In 2017-18 need-based aid dropped to 34.8 percentin Alaska and 16.2 percent in Utah. On the otherhand, need-based aid in Idaho increased from abouta third of all state aid in 2007-08 to 98.0 percent ofaid in 2017-18.20Discussion and ImplicationsCollege affordability has become an increasingconcern for students, families, higher educationleaders, policymakers, and others, all of whomunderstand that postsecondary education is thepathway to economic mobility and success. Frompresidential campaign proposals to state strategicplanning, affordability appears to be topping theagendas of all those working toward improving thelives of students and advancing higher educationpolicy. Although affordability is at the forefront ofthe minds of policymakers and the general public,it has proved difficult to reach consensus on adefinition. Still, several national proposals have beenput forward, and some states have started to lay thegroundwork for assessing affordability within theirown unique contexts.National Frameworks for DefiningAffordabilityNationally, there are several definitions orbenchmarks that have been developed in attemptsto guide the discussion of affordability. The proposedframeworks each rely on a slightly different subsetof metrics to define “affordable” postsecondaryeducation and for the most part focus on thestudent or family perspective. Additionally, by usingstraightforward metrics these definitions aim – withvarying degrees of success – to allow for inferencesto be made on affordability across institution typesand states. The following briefly summarizes justa few of the approaches several national highereducation leaders have taken to defining and framingdiscussions of affordability.Lumina Foundation’s “Rule of 10” definesaffordability as “students should pay no morethan the savings generated through 10 percent ofdiscretionary income for 10 years and the earningsfrom working 10 hours per week while in school.” 21 Thisbenchmark serves as a useful tool for measuringwhat affordability should be for students andfamilies, using a specific threshold based on studentcharacteristics, including financial contribution. Otheraffordability definitions rely on existing price data toassess current levels of affordability, while potentiallyserving as a framework for future policy decisions. Forexample, the University of Pennsylvania GraduateSchool of Education’s “Affordability Diagnosis”Detailed tuition and fees and state finance data available from wiche.edu/pub/tf
WICHE INSIGHTS / 9developed an affordability benchmark using the “ratioof average net price to state-level income estimates.” 22And the National College Attainment Network’saffordability formula states that “cost of attendanceplus 300 should not exceed the institution’s averagefederal, state, and institutional grant awards plus averageFederal Work Study plus federal loan disbursement plusestimated family contribution of average Pell recipientsplus contribution of summer wages.” 23These proposed definitions can serve as a usefulguide for discussing what affordability can and shouldlook like for students and families and support thenational dialogue on postsecondary education. Theproposed metrics all rely on a fairly specific subset ofdata metrics to determine affordable postsecondaryeducation, with almost all relying on factors relatedto the price of education and the aid awarded tostudents. While these are important factors toconsider when discussing affordability, there isno mention of the interaction of financial aid andpostsecondary price with state-level resources andappropriations.State Efforts to Address AffordabilityThe national efforts on affordability provide a usefulcontext for viewing affordability across states andregions; however, the specific state context plays acrucial role for understanding what affordability lookslike, not only for students and families but institutionsand states as well. Several states, both in the WICHEregion and across the country, have made efforts toarticulate what affordability means within their uniquestate context through specific definitions, frameworks,or priorities.Addressing Affordability in the WestOregon’s Higher Education CoordinatingCommission (HECC) reports annually on keyperformance measures and includes two metrics on“unaffordable costs” in the state. For the purposeof this report, HECC has defined unaffordablecosts as “the total cost of attendance that exceeds thestudent’s expected family contribution plus their grantaid plus their earnings from a reasonable amount ofwork.” 24 In this report, HECC identifies the share ofOregon students facing unaffordable costs for totalstudents and disaggregates by race and ethnicity.This breakdown by subpopulation is beneficial forunderstanding where gaps in affordability exist inorder to better situate state policy and allocatefinancial resources to eliminate gaps.Addressing affordability is often included as akey priority within state
in tuition and fee rates across specific institutions. For example, tuition and fees at Colorado School of Mines, which had the region's highest tuition and fees rates in 2019-20, were more than two times the resident undergraduate rates at Colorado Mountain College and Fort Lewis College. Although the regional average tuition and fees