Transcription
Consequences of China’s WTO AccessionThe Consequences of China’s WTOAccession for Its Neighbors*Warwick J. McKibbinResearch School of Pacific andAsian StudiesAustralian National UniversityCanberra, ACT 0200AustraliaandThe Brookings Institution1775 Massachusetts Avenue,N.W.Washington, DC 20036USAwmckibbin@msgpl.com.auWing Thye WooEconomics DepartmentUniversity of CaliforniaOne Shields AvenueDavis, CA 95616USAwtwoo@ucdavis.eduAbstractOur simulations of a global macroeconomic model suggest thatChina’s WTO accession could create significant welfare losses inthe ASEAN-4 if foreign direct investment (FDI) is significantly redirected away from these countries toward China, and if theASEAN-4 countries are unable to implement policies to make upfor the slower rate of technological diffusion from the reducedFDI inflow. If the ASEAN-4 do not fall behind technologically, thenthey will be able to find lucrative niches within the lengthened international manufacturing production chains. The ASEAN-4 musttherefore strengthen their abilities to absorb new foreign technologies quickly and to engage in indigenous technical innovations.1. China’s emergence as a major trading nationAt the end of 1978, China made the historic decision to initiate the process of allowing its economy to converge to anormal market economy, which is characterized by thepredominance of private ownership and by integration* We thank Iwan Jaya Azis, Jonathan Anderson, Huang Yiping,Lu Ding, Jeffrey D. Sachs, Raed Safadi, Xiao Geng, Wang Zhi,and Jennie Woo for insightful discussions on this topic. We aregrateful to Rakhi Mehra, Alison Stegman, and Wu Ruojun forexcellent research assistance. We beneªted from the discussionsof an earlier version of this paper presented at the Seminar onAsian Competitiveness organized by the Socio-economic &Environmental Research Institute, in Penang, Malaysia, on30 September 2002, and at seminars at the Economics Department of the National University of Singapore, and the ChinaStudies Center at the University of Michigan. The views expressed in the paper are those of the authors and should not beinterpreted as reºecting the views of those who have helpedwith the paper; the trustees, ofªcers, or other staff of theBrookings Institution; the Australian National University; or theUniversity of California, Davis.Asian Economic Papers 2:2 2003 The Earth Institute at Columbia University and the MassachusettsInstitute of Technology
Consequences of China’s WTO Accessioninto the international economic system. Before this momentous decision, China hadwithheld a quarter of the world’s population from participating in the internationaldivision of labor. During the period of China’s self-imposed isolation, the rest of theworld created new wealth on an unprecedented scale (with some notable exceptions, such as Africa). It is now conventional wisdom to attribute this generalized increase in prosperity to the open international trading system that was institutionalized at the end of World War II.1 Clearly, China agrees with this conventionalwisdom. China has stated numerous times that its full participation in the international trading system is fundamental to keeping its economic growth sustainable.2This explains why China has tenaciously pursued arduous trade negotiations withthe United States for over a decade in order to win WTO membership.Although there is general agreement that China’s WTO accession would beneªtChina, there is no general agreement that it would also beneªt other countries, especially China’s neighbors in East and Southeast Asia. For example, in his address tothe country on its national day in 2001, the Prime Minister of Singapore, Goh ChokTong, told his fellow citizens thatChina poses a big economic challenge. Some economists describe China as an800-pound trading gorilla. A Hong Kong newspaper added that this gorilla wasvery hungry. . . .Even India is being ºooded with cheap but good quality Chinese goods. SomeIndian manufacturers are ªnding it hard to compete. So they have done thenext best thing. They stick “Made in China” labels on their products to boostsales. . . .Our biggest challenge is therefore to secure a niche for ourselves as Chinaswamps the world with her high quality but cheaper products. China’s economyis potentially ten times the size of Japan’s. Just ask yourself: how does Singaporecompete against ten post-war Japans, all industrializing and exporting to theworld at the same time?I do not mean that China will overpower every other economy, and grow at theexpense of everybody else. As China develops and exports more, its imports willgrow too. There will be many opportunities to invest in China. We must graspthose opportunities.1Sachs and Warner (1995) present convincing evidence in support of this professional consensus.2For an overview of China’s economic growth and a survey of the competing interpretationson the sources of the growth, see Woo (1998, 1999a, 1999b, 2001), Sachs and Woo (2003), andLardy (2002).2Asian Economic Papers
Consequences of China’s WTO AccessionGoh is certainly correct in pointing out that China cannot be an exporter withoutalso being an importer. But the crucial issue is whether the composition of goodsthat China would import would require a complete overhaul of the productionstructures of East and Southeast Asia. Will Indonesia, Malaysia, the Philippines, andThailand (the ASEAN-4) de-industrialize and return to the roles they had in the1950s and 1960s as primary commodity exporters? Or will there be sufªcient lucrative niches in which the ASEAN-4 can specialize within the manufacturing production chains?The second scenario is certainly a possibility, particularly for Singapore, Taiwan, andSouth Korea. Examples of niches abound: “the Swiss make watches and run topbanks, and the Italians produce shoes for the elite.”3 In the opinion of StanleyFischer, the former deputy managing director of the IMF:there is little cause for fear . . . a big dynamic economy in the neighborhood is abeneªt, not a curse, for those around it—look at Canada or Mexico. . . . Or, onemight add, look at Asia after Japan emerged as an economic power from the1970s onward.4Boom or doom? This is the question that is the focus of this paper. To anticipate ourquantitative analysis, our short answer to this question is that, beyond the underlying international repercussions generated by China’s emergence into the international economy, China’s WTO accession is likely to generate additional substantial beneªts for China; have little additional impact on the OECD economies; and create signiªcant welfare losses in the ASEAN-4 only if foreign direct investment(FDI) is signiªcantly redirected away from these countries to China and, even inthis case, only if the ASEAN-4 countries fail to absorb new foreign technologiesquickly and to engage in indigenous technical innovations.2. Guidance from theoryAn adherent of standard international trade theory, as embodied by the HeckscherOhlin (H-O) model, might ªnd it amusing that a large part of this paper focuses onthe implications of China’s WTO membership for other economies. It is amusing be3“Rising China to Be Key Importer of ASEAN Goods,” Straits Times, 30 August 2002.4“Don’t Fear China Threat,” Straits Times, 4 September 2001. Hong Kong–based analysts atGoldman-Sachs and the Deutsche Bank have also disputed the notion that China’s rise willbe deleterious to its neighbors; see Anderson (2002) and “Report Plays Down China’s Drainon Asean,” South China Morning Post, 4 February 2003, respectively.3Asian Economic Papers
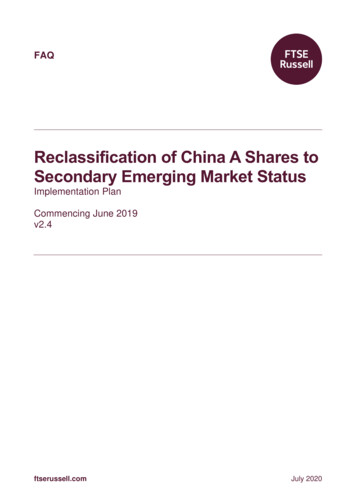
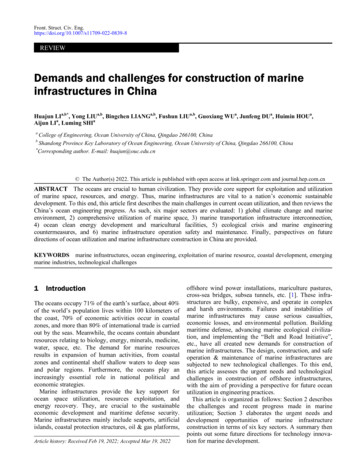
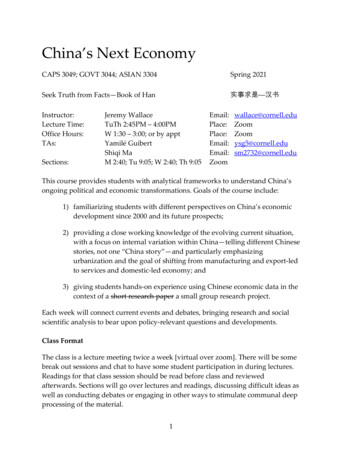
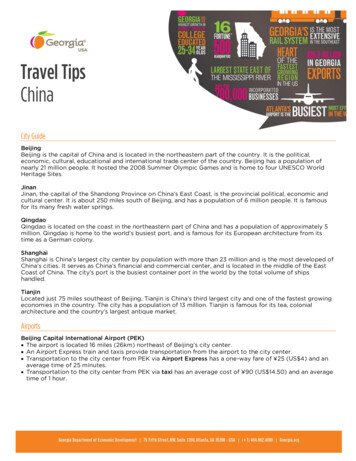
Consequences of China’s WTO Accessioncause China’s WTO membership means the lowering of China’s trade barriers, andthe H-O model shows unambiguously that the welfare of China’s trade partners hasonly upward potential: their welfare will be either unaffected or improved. What isnot obvious from the H-O model is the impact of China’s tariff reduction on its ownwelfare. The answer depends to a large extent on whether China is a small countryin the economic sense. A small economy is deªned as a price taker in the internationalmarkets; that is, its terms of trade are exogenous.If China is a small country in the economic sense, then its tariff reduction willdeªnitely beneªt itself and (by deªnition) will have no repercussions on other economies. However, if there are short-run rigidities in labor movements (such as stickynominal wages) in China, then the additional imports will create (temporary) unemployment immediately, and this cost has to be balanced against the present discounted value of the long-run beneªts from the more efªcient allocation of resources. So if China is a small country, the interesting question about China’s WTOmembership is not the welfare implications of that membership for other economiesbut its welfare implications for China’s economy.If China is a large country in the economic sense, then the answer depends on whereits present effective tariff rate stands with respect to what we will call the optimumtariff rate (tA), the threshold tariff rate (tB), and the trade-terminating tariff rate (tC).Figure 1 locates these three tariff rates in the inverted U-curve, which shows the relationship between China’s welfare level and its tariff rate. The U shape emergesfrom the changes in two different welfare components induced by an increase in thetariff rate: (1) a welfare decline from reduced consumption of the imported goodand (2) a welfare gain from the improvement in the terms of trade.Figure 2 shows the relationship between the welfare level of a hypothetical tradepartner and China’s tariff rate. This is a monotonically declining relationship because an increase in China’s tariff rate will (1) drive down the amount of goods thetrade partner will export to China (a negative quantity-welfare effect) and (2) drivedown the price of the reduced amount of goods that it will export (a negative pricewelfare effect). The unambiguous conclusion is that any lowering of China’s tradebarriers will increase the welfare of the trade partner. As in the (China as a) smalleconomy case, the interesting question about China’s WTO membership is not itsimpact on other economies, but its impact on China’s own economy.We will now state two “stylized facts.” On the basis of the agreements reached in order for China to become a WTO member, the ªrst stylized fact is that, to a ªrst ap-4Asian Economic Papers
Consequences of China’s WTO AccessionFigure 1. Relationship between welfare level and tariff rate in ChinaNote: Figure assumes that China is a large economy.proximation, WTO membership will require China to lower its effective tariff rate toa low enough level that the resulting welfare level in the country is close to the freetrade welfare level. The second stylized fact is that China’s present tariff rate islikely to be above tB. This stylized fact arises from two considerations. First, Chinawas virtually an autarkic economy before 1978, and since then the biggest reductions in trade barriers have occurred in the area of imported inputs required by theexport-processing industries. Trade barriers to ªnal-consumption goods are in general still very high in China. Second, China was not coerced by its trading partnersto join the WTO; it sought WTO membership voluntarily and pursued the matterwith great tenacity (the U.S.-China bilateral trade negotiations took over a decade tocomplete). Such perseverance indicates that the effective tariff rates in China in 2000created a welfare level in the country that is lower than the free trade welfare level.The puzzling point about China’s pursuit of WTO membership that we want toraise is that even if China’s present effective tariff rate is indeed higher than tB, thebest thing to do is to move not to the WTO-required almost-free-trade position butto tA, the optimum tariff. In short, if China is indeed a large economy, then it is notclear why it should not undertake the amount of unilateral tariff reduction requiredto bring it to tA, rather than to join WTO. Obviously WTO membership must involveanother beneªt that has been missed in the literature.5Asian Economic Papers
Consequences of China’s WTO AccessionFigure 2. Relationship between welfare level of China’s trade partner and China’s tariff rateNote: The assumption is that China is a large economy.To summarize the discussion so far, the H-O model can explain China’s eagernessto join WTO only if China is a small economy in the economic sense, in which casetariff reduction will surely increase its welfare. If China is a large economy, thenChina’s eagerness to join WTO is a mystery, because H-O would predict that Chinawould reduce its tariff from beyond tB to tA, but not to the very low tariff rate agreedto during the WTO negotiations. Furthermore, the H-O model cannot explain whysome of China’s trade partners, especially the Southeast Asian economies, havebeen so anxious about China’s WTO membership. Because we do not regard any ofthe following three reasons—ignorance in China about optimum tariff, pervasiveparanoia in Southeast Asia, and widespread macroeconomic rigidities in SoutheastAsian economies—to be the motivating factor behind China’s eagerness to joinWTO and behind Southeast Asia’s worries, we conclude that there is somethingmissing in the logic of the H-O model about China’s WTO membership.Before we turn to discussing the additional elements that are needed to make theH-O model’s analysis more relevant to the focus of the analysis presented in thispaper, we temper the strong conclusions of the H-O model to arrive at what we seeto be the two most useful broad messages from standard international trade theory.First, it is likely that the economy that will experience the biggest impacts fromChina’s WTO accession will be China. Second, it is likely that the majority ofChina’s trade partners will experience few signiªcant negative effects from its accession to the WTO.6Asian Economic Papers
Consequences of China’s WTO Accession3. Supplementing theory with the speciªc situation in East AsiaThe fundamental reason for China’s enthusiasm for WTO membership, which ismissed by the H-O model, is that WTO membership will greatly enhance China’seconomic security. Until China became a WTO member, the U.S. Congress had toapprove most-favored-nation (MFN) status for China annually in order for China’sexports to compete in the U.S. markets on equal terms against the exports fromWTO countries. This annual congressional-approval requirement inevitably rendered China’s exports vulnerable to passing passions in the U.S. political arena; forexample, over accidents such as military airplane collisions in the South China Seaand the burning of the U.S. consulate in Chengdu following the unintended U.S.bombing of the Chinese embassy in Belgrade. The importance to China of continuing high export growth and maintaining the access of its exports to the U.S. marketis hard to overstate.The high and growing global demand for China’s exports in the last two decadeshas been a powerful force in hastening the transformation of China from a subsistence peasant economy to an industrialized economy. The contribution of exports toChina’s growth has become more important since 1998, when the quickened pace ofstate enterprise reform interacted with the dysfunctional ªnancial system to imparta deºationary tendency to the economy. Deªcit spending and exports are the twogrowth engines that have kept recent GDP growth rates above 7 percent. The problem is that China’s weak ªscal position makes deªcit spending an unsustainable engine of growth.5 Its present ªscal situation is marked by the constant need to recapitalize the state banks, the need to fund future pension claims, and the inability of thegovernment to increase revenue collection substantially. Hence, if exporting is alsonot a sustainable engine of growth, then a drastic slowdown in growth is inevitable.The United States is China’s biggest export market. Until the recent restrictions onsteel imports, the United States had been perceived as ideologically committed tofree trade and consequently less prone to protectionism than Europe and Japan.6Clearly, in order for exports to be a sustainable growth engine, China must secureassured access to its biggest market. And only WTO membership can prevent theUnited States from the impulsive unilateral action of switching off one of China’s5See Sachs and Woo (2003) for a discussion of China’s difªculties in macroeconomic management—a situation that is increasingly recognized in the press; for example, “Public SpendingExplodes,” Far Eastern Economic Review, 30 January 2003.6A recent well-known example of a Europe-China trade dispute is the imposition of restrictions on Chinese cigarette lighters, and a recent example of a Japan-China trade dispute isover the alleged dumping of Chinese garlic.7Asian Economic Papers
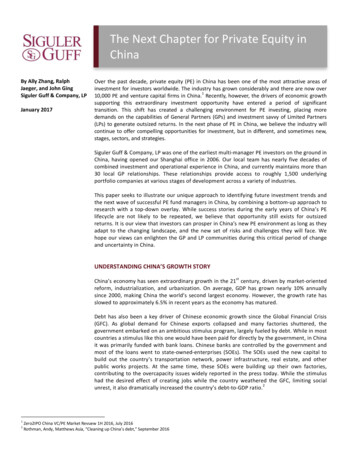
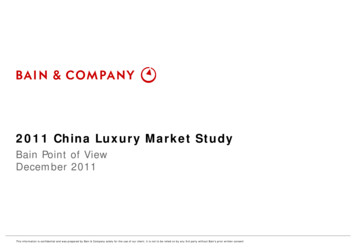
Consequences of China’s WTO Accessionmost important growth engines by simply denying MFN status to China in any yearit chooses to.What are the implications for China’s trade partners of the enhanced economic security it derives from WTO membership? By removing the annual uncertainty aboutChina’s exports, WTO membership has increased China’s reliability as a supplier tothe international markets. This development has two immediate consequences.First, buyers can source a larger proportion of their purchases from Chinese producers without increasing the risk of nondelivery or late delivery. Second, producers oflabor-intensive goods destined for sale in the high-income economies can now reduce management costs by reducing the geographical diversiªcation of their production facilities.The primary competitors to China’s mostly labor-intensive exports are its East Asianneighbors: South Korea, Taiwan, Hong Kong, Singapore, Indonesia, Malaysia, thePhilippines, and Thailand. Of these countries, the last four, commonly referred to asthe ASEAN-4, engage in export-processing activities and are competitors to Chinafor FDI. The ASEAN-4 are therefore likely to be negatively affected by the abovetwo developments resulting from China’s enhanced reliability as a supplier. The factthat labor costs in China are lower than those in the ASEAN-4 magniªes the negative effects of these two channels.Before discussing the possible diversion of FDI to China from its trade partners, weturn to tables 1 and 2 to review the relative importance of FDI to growth in theAsian economies. Table 1 reports the inward and outward FDI stock as a proportionof GDP in selected economies, and table 2 reports the inward and outward FDI ºowas a proportion of investment in those economies. The net FDI 7 stock (normalizedby GDP) data show that Japan has been a capital exporter at least since 1980, andTaiwan became a capital exporter by 1990. South Korea, Hong Kong, Singapore, andthe ASEAN-4 are net capital importers. Combining the FDI stock data in table 1with the FDI ºow data in table 2, we see that Hong Kong and South Korea, until theAsian ªnancial crisis of 1997–99, were in the process of relocating a signiªcantamount of their labor-intensive industries abroad, as evidenced by their outwardFDI ºow’s being bigger than their inward FDI ºow during 1990–95. The biggest recipients of the outward FDI ºows from Japan, Taiwan, South Korea, and Hong Kongwere China and the ASEAN-4.The economic health of the ASEAN-4 has become highly dependent upon foreigncapital, with some apparent exceptions (tables 1 and 2). Although Indonesia has78Net FDI is inward FDI minus outward FDI.Asian Economic Papers
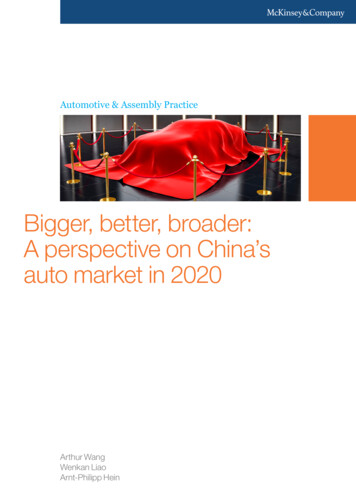
Consequences of China’s WTO AccessionTable 1. Inward and outward FDI stocks as a percentage of gross domestic product byeconomy .1—7.00.732.32.4Selected OECD economiesUnited 9.015.9436.20.5198.115.9263.8224.9Selected Asian nadaInwardOutward20.48.919.614.728.832.4Hong South .623.230.563.2New ZealandInwardOutwardUnited KingdomInwardOutwardSource: UNCTAD (2002).been experiencing net FDI outºow since the Asian ªnancial crisis, its net FDI stock/GDP ratio in 2000 still stood at 38 percent, which is the same as Malaysia’s ratio andhigher than Thailand’s ratio of 18 percent. Although the net FDI stock/GDP ratio of14 percent for the Philippines in 2000 makes it the country with the lowest ratioamong the ASEAN-4, the proportion of Philippine investment funded by net FDIinºow was over 7 percent during 1990–95 and reached 8.4 percent in 2000. The degree of foreign ªnancing in the Philippines’s investment in 2000 was lower than thatin Thailand (10.2 percent) but higher than that in Malaysia (7.7 percent).The above conclusion about the great importance of FDI to the economies of theASEAN-4 also holds for China’s economy. China’s net FDI stock/GDP ratio of 30percent places it below Malaysia and Indonesia but above Thailand. Net FDI inºowhas been accounting for an increasing proportion of China’s investment, rising froman average of 8.4 percent in 1990–95 to 10.3 percent in 2000. On the eve of China’s9Asian Economic Papers
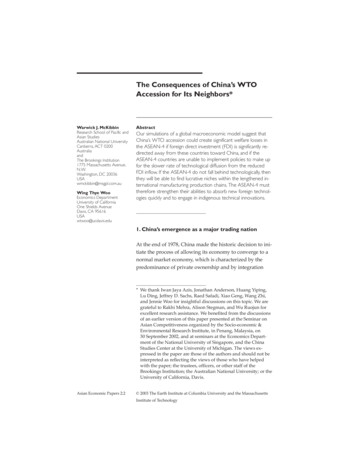
Consequences of China’s WTO AccessionTable 2. Inward and outward FDI ºows as a percentage of gross ªxed capital formation byeconomy ual average)9.81.42000Economy1990–95(annual average)200010.50.2Selected OECD economiesSelected Asian economiesUnited rd0.12.2South .2Hong InwardOutward4.82.0 1.0New ZealandInwardOutwardUnited KingdomInwardOutwardSource: UNCTAD (2002).WTO accession, China resembled the ASEAN-4 with regard to its strategy of harnessing FDI to accelerate economic development.Our conclusion on the importance of FDI to the economic development of theASEAN-4 is conªrmed by the inward FDI performance index for 140 countries thatwas constructed by the United Nations Conference on Trade and Development(UNCTAD) (2002). Table 3 compares the inward FDI performance indexes for selected Asian and OECD countries. The FDI performance index for a particular country is the ratio of that country’s share in global FDI to its share in global GDP. Avalue of 1 for a country on the performance index denotes that the country is receiving FDI exactly in line with its relative economic production. As the table shows, theindex values in 1988–90 for the ASEAN-4 were generally very high: the value for10Asian Economic Papers
Consequences of China’s WTO AccessionTable 3. Values of and country rankings by the UNCTAD inward FDI performance index(from sample of 140 98–2000China0.91.26147Selected OECD economiesUnited StatesCanadaJapanSouth KoreaAustraliaNew ZealandFranceGermanyItalyUnited 54694311525Selected Asian economiesTaiwanHong .95.413.80.84.41.72.60.35.92.2 0.61.20.61.358416383925112218138448941Source: UNCTAD (2002).Note: FDI performance index is the ratio of a country’s share in global FDI ºows to its share in global GDP. An FDI performance index value of 1 for a country denotes that the country is receiving FDI exactly in line with its relative economic share.Malaysia was 4.4, that for Thailand was 2.6, and that for the Philippines was 2.6.Only Indonesia was signiªcantly low, at 0.8.China’s attractiveness as a location for FDI in 1988–90 was the same as Indonesia’s.The two countries’ respective ranks of 61 and 63 on the FDI index were greatly below those of Malaysia (8), Thailand (25), and the Philippines (39). In the aftermath ofthe Asian ªnancial crisis and after a decade more of economic opening by China,however, China’s value on the performance index rose, whereas those of theASEAN-4 fell. In 1998–2000, China’s rank had risen to 47, compared with 41 forThailand, 44 for Malaysia, 89 for the Philippines, and 138 for Indonesia. There is little doubt that most of the downward movement in the rankings of the ASEAN-4was caused by the Asian ªnancial crisis, but one cannot rule out that a part of thedownward movement was due to the diversion of FDI from the ASEAN-4 to China.Analytically, the removal of the MFN threat when China ofªcially became a WTOmember at the end of 2001 was equivalent to a reduction in the risk premium demanded by investors in China’s export-oriented industries. A complete picture ofChina’s WTO membership involves more than a reduction in China’s effectivetariffs; it also includes a reduction in the risk premium for investment in exportoriented production inside China. The effect of the tariff reduction is to reallocate11Asian Economic Papers
Consequences of China’s WTO Accessionthe composition of China’s output from importables to exportables and nontradables, and the effect of the risk premium is to reconªgure the global distribution ofFDI in China’s favor.There is indeed evidence of an FDI diversion effect created by China’s WTO membership. The Japan Bank for International Cooperation (JBIC) conducts an annualsurvey of Japanese transnational corporations (TNCs) to ªnd out which countrieswill be the top 10 locations for manufacturing FDI over the three years subsequentto the survey. Table 4 presents the results from the surveys undertaken in 1996, 2000,and 2001. These results indicate that 68 percent of Japanese TNCs listed China asone of the top 10 locations in 1996, and 65 percent did so in 2000. These responsesmade China the location most frequently identiªed as promising for FDI in bothyears: that is, China was ranked ªrst in the list of top 10 locations.The evidence in favor of our FDI diversion hypothesis is captured in the 2001 survey. It became clear to the international community at the end of 2000 that China’saccession to the WTO was imminent. The upshot was that the proportion of Japanese TNCs in 2001 that identiªed China as one of the 10 most promising locationsfor manufacturing FDI jumped to 82 percent from 65 percent in 2000. Most telling ofall, the “identiªcation gap” between China and the United States, which wereranked ªrst and second, respectively, in 2000 and 2001, widened from 24 percentagepoints in 2000 to 50 percentage points in 2001.The frequency with which the ASEAN-4 economies were identiªed as top 10 locations for FDI dropped between 1996 and 2000, and the most important reason forthis change in the TNCs’ perception could be the Asian ªnancial crisis. The frequency with which Thailand was identiªed as a top 10 location for FDI fell from 36percent to 24 percent, Indonesia from 34 percent to 15 percent, Malaysia from 20 percent to 12 percent, and the Philippines from 13 percent to 8 percent. In terms ofranking within the 10 most-cited locations, Thailand slipped from 2 to 3, Indonesiafrom 3 to 4, and the Philippines from 8 to 10, whereas Malaysia improved from 6to 5.As the Asian ªnancial crisis was over by early 2000, changes in the frequency ofidentiªcation and ranking of the ASEAN-4 economies on the list of proªtable FDIlocations between 2000 and 2001 can therefore justiªably be attributed to the WTOcreated improvement in China’s reliability as an international supplier. Thailandand Indonesia were identiªed as desirable FDI locations with nearly equal frequencies in 2000 and 2001, but the gaps between their frequencies of identiªcation andthat of China increased signiªcantly. The China-Thailand gap went up from 41 percentage points to 57 percentage points, and the China-Indonesia gap from 50 per12Asian Economic Papers
Consequences of China’s WTO AccessionTable 4. Ten most promising destinations for manufacturing FDI by Japanese TNCs over thenext three years (frequency, expressed in percent, with which a particular country isidentiªed as a promising location for FDI by Japanese ªrms responding to annual surveysconducted by Japan Bank for International Cooperation)Rank1996 surveyRatio2000 surveyRatio2001 surveyRatio123456ChinaThailandIndonesiaUnited ited dia18ChinaUnited StatesThailandIndonesiaMalaysiaTaiwan provinceof ChinaIndiaPhilippinesSingaporeUnited Kingdomand Taiwanprovince of China1310VietnamRepublic of KoreaPhilippines998Taiwan provinceof ChinaRepublic of KoreaMalaysiaSingapore11886891011107Source: UNCTAD (2002).Note: Ratio is share of ªrms that consider a particular country as promising in total respondent ªrms (multiple responses). Fiscal year.centage points to 68 percentage points. The frequency with which Malaysia wascited in the top 10 declined from 12 percent to 8 percent, and the Philippinesdropped out of the top 10 list. Malaysia’s rank moved from 5 to 9, and the ChinaMalaysia identiªcation gap soared from 53 percentage points to 74 percentagepoints. These differences in the survey results of 2000 and 2001 are certai
its present effective tariff rate stands with respect to what we will call the optimum tariff rate (t A), the threshold tariff rate (t B), and the trade-terminating tariff rate (t C). Figure 1 locates these three tariff rates in the inverted U-curve, which shows the re-lationship between China's welfare level and its tariff rate. The U shape .