Transcription
Zhang et al. Cell Communication and (2019) 17:4RESEARCHOpen AccessOverexpression of MTA1 inhibits themetastatic ability of ZR-75-30 cells in vitroby promoting MTA2 degradationLong Zhang1 , Qi Wang1, Yuzhen Zhou1, Qianwen Ouyang6, Weixing Dai4,5, Jianfeng Chen1,3, Peipei Ding1,Ling Li3, Xin Zhang1, Wei Zhang1, Xinyue Lv1, Luying Li1, Pingzhao Zhang1,3, Guoxiang Cai4,5 and Weiguo Hu1,2,3*AbstractBackground: As the first member of the metastasis-associated protein (MTA) family, MTA1 and another MTA familymember, MTA2, have both been reported to promote breast cancer progression and metastasis. However, thedifference and relationship between MTA1 and MTA2 have not been fully elucidated.Methods: Transwell assays were used to assess the roles of MTA1 and MTA2 in the metastasis of ZR-75-30 luminal Bbreast cancer cells in vitro. Immunoblotting and qRT-PCR were used to evaluate the effect of MTA1 overexpression onMTA2. Proteases that cleave MTA2 were predicted using an online web server. The role of neutrophil elastase (NE) inMTA1 overexpression-induced MTA2 downregulation was confirmed by specific inhibitor treatment, knockdown,overexpression and immunocytochemistry, and NE cleavage sites in MTA2 were confirmed by MTA2 truncation andmutation. The effect of MTA1 overexpression on the intrinsic inhibitor of NE, elafin, was detected by qRT-PCR,immunoblotting and treatment with inhibitors.Results: MTA1 overexpression inhibited, while MTA2 promoted the metastasis of ZR-75-30 cells in vitro. MTA1overexpression downregulated MTA2 expression at the protein level rather than the mRNA level. NE was predicted tocleave MTA2 and was responsible for MTA1 overexpression-induced MTA2 degradation. NE was found to cleave MTA2in the C-terminus at the 486, 497, 542, 583 and 621 sites. MTA1 overexpression activated NE by downregulating elafinin a histone deacetylase- and DNA methyltransferase-dependent manner.Conclusions: MTA1 and MTA2 play opposing roles in the metastasis of ZR-75-30 luminal B breast cancer cells in vitro.MTA1 downregulates MTA2 at the protein level by epigenetically repressing the expression of elafin and releasing theinhibition of neutrophil elastase, which cleaves MTA2 in the C-terminus at multiple specific sites.Keywords: MTA1, MTA2, Neutrophil elastase, Elafin, Breast cancer metastasisBackgroundBreast cancer is the most prevalent cancer women sufferfrom worldwide and is estimated to be the cancer withthe highest morbidity and second highest mortalityamong women in the United States [1]. Breast cancer isa highly heterogeneous cancer; therefore, it is classified* Correspondence: weiguohu@fudan.edu.cn1Fudan University Shanghai Cancer Center and Institutes of BiomedicalSciences, Collaborative Innovation Center of Cancer Medicine, ShanghaiMedical College, Fudan University, 270 Dong’an Road, Shanghai 200032,China2Department of Immunology, Shanghai Medical College, Fudan University,130 Dong’an Road, Shanghai 200032, ChinaFull list of author information is available at the end of the articleinto different subtypes, which include normal breast,basal-like, claudin-low, HER2 positive (HER2 ), luminalA and luminal B cancers, according to the histologicalfeatures and molecular traits of the cancer [2, 3]. Luminal B breast cancer shows more aggressive phenotypesthan luminal A breast cancer and higher insensitivity toneoadjuvant chemotherapy than basal-like and HER2 breast cancers, leading to its obstinacy and poor prognosis of patients [2, 4]. In addition, luminal B breast cancertends to metastasize, increasing the mortality of luminalB breast cancer patients [2, 5]. In fact, breast cancer metastasis is the major lethal factor that affects patientmortality [6]. The Author(s). 2019 Open Access This article is distributed under the terms of the Creative Commons Attribution 4.0International License (http://creativecommons.org/licenses/by/4.0/), which permits unrestricted use, distribution, andreproduction in any medium, provided you give appropriate credit to the original author(s) and the source, provide a link tothe Creative Commons license, and indicate if changes were made. The Creative Commons Public Domain Dedication o/1.0/) applies to the data made available in this article, unless otherwise stated.
Zhang et al. Cell Communication and Signaling(2019) 17:4To overcome the problem of breast cancer metastasis, a13762NF rat mammary adenocarcinoma metastasis modelwas established, and the first member of the metastasis associated protein (MTA) family, MTA1, was discovered bydifferential cDNA library screening in 1994 [7]. The othertwo members of the MTA family, MTA2 and MTA3, wereidentified afterwards [8, 9]. Subsequent studies have revealed that MTA1, MTA2 and MTA3 are constitutive components of nucleosome remodeling and histone deacetylase(NuRD) complex [10–12]. The NuRD complex possessesmultiple activities, such as histone deacetylase activities andmethyl-CpG-binding-related activities, because of the composition of histone deacetylase 1/2 (HDAC1/2) andmethyl-CpG-binding domain protein 2/3 (MBD2/3), respectively [10, 13]. MTA1 and MTA2 have both been reported to be pivotal for epithelial-mesenchymal transition(EMT) and metastasis of breast cancer, while MTA3 hasbeen reported to inhibit EMT [12, 14–16]. EMT is a criticalstep among a sequence of discrete steps that cancer cellsundergo to achieve metastasis [17, 18]. During EMT, theEMT-inducing factors Snail, Slug, TWIST and ZEB1 areupregulated, the epithelial molecule E-cadherin is downregulated and the mesenchymal molecule N-cadherin is upregulated [17, 18].Both being potent breast cancer metastasis-promotingfactors of the MTA family, the difference and relationship between MTA1 and MTA2 remain an enigma because of insufficient investigations [19]. In this study, weaimed to examine the different roles that MTA1 andMTA2 may play in breast cancer metastasis and investigate their relationship. We investigated the roles ofMTA1 and MTA2 in the metastasis of the ZR-75-30 luminal B breast cancer cell line [20, 21], and we foundthat the overexpression of MTA1 inhibits the metastasisof ZR-75-30 cells by downregulating MTA2, which hasnot been clarified previously [19]. Mechanistically, theoverexpression of MTA1 transcriptionally downregulated the intrinsic inhibitor of the neutrophil elastase(NE), elafin, to promote the degradation of MTA2 thatwas mediated by NE, therefore inhibiting the metastasisof ZR-75-30 cells in vitro. Overall, our study provideddirect evidence for the different roles that MTA1 andMTA2 play in breast cancer cell metastasis and clarifiedthe mechanism by which MTA1 downregulates MTA2at the protein level.MethodsCell culture and stable cell line establishment293FT cells (Thermo Fisher Scientific) were cultured inDulbecco’s Modified Eagles Medium supplemented with10% fetal bovine serum (FBS) and 1% antibiotics (penicililin and streptomycin) HeLa cells (Type Culture CollectionCell Bank, Chinese Academy of Sciences) and ZR-75-30cells (a kind gift from the Department of Breast Surgery,Page 2 of 15Fudan University Shanghai Cancer Center) were culturedin RPMI 1640 medium containing 10% FBS and 1% antibiotics. MDA-BM-231 cells (a kind gift from the Department of Breast Surgery, Fudan University ShanghaiCancer Center) were cultured in Leibovitz’s L-15 mediumsupplemented with 10% FBS and 1% antibiotics. All cellswere maintained at 37 C in a humidifed atmosphere containing 5% CO2 in a cell incubator (Thermo Fisher Scientific). ZR-75-30-Vector/MTA1/MTA2 stable cell lineswere established by infection of lenti-viruses and selectionby flow cytometry on MoFlo XDP (Beckman Coulter).ZR-75-30-shMTA2-NC/#1/#2, ZR-75-30-shElafin-NC/#1/#2 were established by infection of lenti-viruses and selection by puromycin. ZR-75-30-MTA1-shNE-NC/#1/#2stable cell lines were established on the basis ofZR-75-30-MTA1 by infection of lenti-viruses and selection by puromycin.Antibodies and reagentsAnti-β-Actin antibody (sc-47,778), anti-MTA1 antibody(sc-17,773) and anti-MTA2 antibody (sc-55,566) werepurchased from Santa Cruz Biotechnology (Dallas, TX,USA). Anti-Neutrophil Elastase antibody (ab131260) andanti-Elafin/Skalp antibody (ab46774) were purchased fromAbcam (Cambridge, MA, USA). HA-Tag (C29F4) RabbitmAb (#3724) was purchased from Cell signaling technology (Beverly, MA, USA). Monoclonal ANTI-FLAG M2antibody (F3165) was purchased from Merck Sigma company (Burlington, MA, USA). Anti-DDDDK-tag mAb(M185-3 L) was purchased from MBL International Corporation (Woburn, MA, USA). HRP conjugated secondaryantibodies Goat anti-mouse IgG (H L), HRP conjugate(SA00001–1) and Goat anti-rabbit IgG (H L), HRPconjugate (SA00001–2) were purchased from ProteintechGroup (Rosemont, IL, USA). Fluorescent secondaryantibodies Goat anti-Rabbit IgG (H L) HighlyCross-Adsorbed Secondary Antibody, Alexa Fluor 488(A-11034) and Goat anti-Mouse IgG (H L) HighlyCross-Adsorbed Secondary Antibody, Alexa Fluor 594(A-11032) and lipofectamine 3000 (L3000015) were purchased from Thermo Fisher Scientific (Waltham, MA,USA). Puromycin (P8230) was purchased from Solarbiobiotechnology (Shanghai, China). Cycloheximide (CHX,HY-12320) was purchased from MedChemExpress (Monmouth Junction, NJ, USA). Histone deacetylases (HDAC)inhibitor suberoylanilide hydroxamic acid (SAHA, alsoknown as Vorinostat, MK0683; S1047), Sivelestat (S8136),MG132 (S2619) and Azacitidine (AZA, S1782) were purchased from Selleck Chemicals (Shanghai, China).PlasmidsTo construct core plasmids overexpressing MTA1/MTA2, CDSs of MTA1/MTA2 were inserted intopCDH-EF1-MCS-T2A-copGFP. shRNA plasmids targeting
Zhang et al. Cell Communication and Signaling(2019) 17:4MTA2/NE/Elafin were purchased from Shanghai Genechem. To construct FLAG-tagged MTA1/NE over-expressing plasmids, the CDS of MTA1/NE (without stop codon)were subcloned into pCMV-C-FLAG vector. To constructHA-tagged MTA2 and HA-tagged MTA2 truncatedN-terminal and C-terminal mutants, specific primers weredesigned to subclone corresponding sequences from MTA2(without stop codon) into pCMV-C-HA vector. For sitemutation, specific mutation primers were designed and corresponding plasmids were mutated according to the manufacture of KOD-Plus-Mutagenesis Kit (SMK-101,TOYOBO, Japan). Mutations were confirmed by sequencing the plasmids. All the primers used to construct truncated mutants and point mutations are in Additional file 1:Table S1.Lentiviral particles productionTo generate lentiviruses, core plasmids that overexpressor knockdown genes were co-transfected into 293FTcells with packaging plasmid psPAX2 and envelope plasmid pMD2.G at a ratio of 4:3:1 by Neofect DNA transfection reagent (TF201201, Neofect biotech, Beijing,China). After 48 h of incubation, lentiviral particles wereharvested.TransfectionTo detect the effect of MTA1 expression on the migration and invasion of MDA-MB-231 cells, MDA-MB-231cells were transfected with pCDH-EF1-MCS-T2AcopGFP-MTA1 or empty vector as a control by lipofectamine 3000 as the manual instructed and cells wereseeded for transwell assays after 36 h of transfection.After 48 h, cells were harvested for immunoblotting. Todetect the effect of overexpression of MTA1 to MTA2and its mutants, pCMV-C-FLAG-MTA1 and corresponding plasmids that overexpress MTA2 mutants wereco-transfected into 293FT cells by Neofect DNA transfection reagent. For instance, 1250 ng pCMV-C-FLAGempty vector and 1250 ng pCMV-C-HA-MTA2 wereco-transfected to 293FT cells seeded in a well of 6 wellplate as the control group and 1250 ng pCMV-C-FLAGMTA1 and 1250 ng pCMV-C-HA-MTA2 were co-transfected in the same as the experimental group. After 48 hof incubation, transfected cells were harvested for immunoblot. Simlar transfections were conducted for othercells.ImmunoblotTo detect the levels of proteins in stable cell lines, thesame amount of stable control cells and stable overexpression/knockdown cells were seeded in wells of 6 wellplates. After 24 h incubation, cells were lysed by 1.25 SDS loading buffer containing 1% β-mercaptoethanol.For transfected 293FT cells, after transfection, cells werePage 3 of 15incubated for 48 h, and then were lysed as above. Cell lysates were then heated in a heating block for 10 min at100 C with vigorous shaking. Same amount of heatedcell lysates was loaded for SDS-PAGE respectively,followed by being transferred to PVDF membranes.Membranes were washed for 3 times with TBST andthen blocked with 5% non-fat milk diluted with TBST atroom temperature for 2 h. Primary antibodies dilutedwith 5% non-fat milk/TBST were incubated withblocked membranes for 2 h at room temperature orovernight at 4 C on a gentle shaking platform. Membranes were washed with TBST for 3 times and then incubated with secondary antibodies conjugated with HRPdiluted with 5% non-fat milk/TBST for 45 min at roomtemperature. Finally, membrane was washed by TBSTfor 3 times and developed with Immobilon WesternChemiluminescent HRP Substrate (WBKLS0500, MerckMillipore, (Burlington, MA, USA)). Images were captured with ImageQuant LAS 4000 biomolecular imager(GE Healthcare).Protein stability assayTo validate the effect of MTA1 to the stability of MTA2protein, ZR-75-30-Vector and ZR-75-30-MTA1 cellswere seeded and treated with Cycloheximide (CHX) at afinal concentration of 20 μM for 0, 10, 25, 90, 240, 360min respectively. Then cells were harvested followed byimmunoblot detection.Quantitative RT-PCR (qRT-PCR)Total RNA was extracted from cells as the manufacture ofTRIzol reagent (10296010, Thermo Fisher Scientific (Waltham, MA, USA)) indicated. RNAs were reversely transcribed into cDNA using PrimeScript RT Master Mix(RR036A, Takara Bio Inc. (Japan)). qRT-PCR assay wasconducted using SYBR Premix Ex Taq II (Tli RNaseHPlus) (RR820Q, Takara Bio Inc.(Japan)) on a QuantStudio 7 Flex Real-Time PCR System platform (Thermo FisherScientific (Waltham, MA, USA)) following standard protocols. The expression of β-actin was set as endogenouscontrol and the expressions of genes were calibrated tothat of corresponding control cells. Data analyses wereconducted by QuantStudio Real-Time PCR Software. RQvalues (relative quantified value of mRNA expression)were calculated by the same software followed bytwo-tailed Student’s t test to determine significant differences between two groups. P 0.05 was considered statistically significant. All the primers designed for qRT-PCRare in Additional file 1: Table S1.ImmunocytochemistryHeLa cells were seeded on the sterilized round coverslipsthat were inserted in to a well of a 24 well plate. After 12 hgrowth, cells were transfected with pCMV-C-HA-MTA2
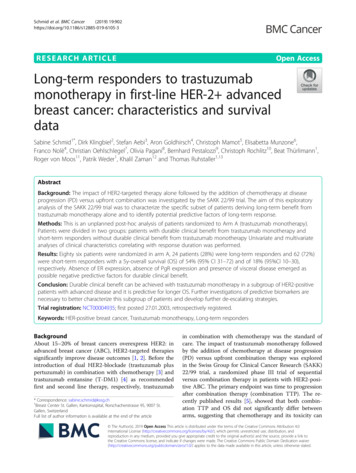
Zhang et al. Cell Communication and Signaling(2019) 17:4pCMV-C-FLAG plasmids or pCMV-C-HA-MTA2 pCMV-C-FLAG-NE plasmids by Neofect reagent. Similartransfections were conducted for other cells. After 48 h oftransfection, cells were fixed with 4% paraformaldehyde atroom temperature for 30 min. Cells were then permeabilizedon ice with 0.2% Triton X-100/PBS for 5 min, followed bywashing 3 times using PBS. Then cells were blocked with1%BSA/PBS at room temperature for 1.5 h and primaryantibodies diluted with 1% BSA/PBS were applied for an incubation with cells at room temperature for 2 h. Cells werethen washed by PBS for 3 times to wash off unboundedantibodies and incubated with fluorescent secondary antibodies at room temperature for 1.5 h. Then cells werewashed and the coverslips were mounted with mountingmedium containing DAPI. After an incubation at 4 C for15 min, slides were observed and images were captured atLeica TCS-SP5 confocal system.Cell migration and invasion assaysFor cell migration assay, cells were harvested, washed byPBS for twice, resuspended by DMEM medium withoutFBS and counted by Vi-CELL XR (Beckman Coulter).Transwell (8 μm, 353097, Corning) chambers were insertedto corresponding wells in 24 well plate that already contain500 μL DMEM with 10% FBS. For stable cell lines established on ZR-75-30 cells, without noticing, 2 104 cellswere added to the upper chamber and incubated for 24 h.For cell invasion assays, 60 μL matrigel (Matrigel Basement Membrane Matirx, 356,234, BD (Franklin Lakes, NJ,USA)) diluted with DMEM at a ratio of 1:10 was added tothe upper chamber. The set was balanced at 4 C for 30min and then moved into cell incubator overnight to drythe gel. Similar with cell migration assay, cells were harvested, washed, resuspended and counted. 4 104 cellswere added to the matrigel precoated upper chamberunder which the well contains 500 μL DMEM with 10%FBS, and incubated for 48 h. For migration and -MTA1 cells, after 36 h of transfection, 4 104and 8 104cells were added to the upper chamber and incubated for 24 h and 48 h respectively. For both cell migration assay and invasion assay, after incubation, medium ofthe upper chambers were discarded and cells migrated tothe lower chamber were fixed with 4% paraformaldehydeat room temperature for 30 min, stained with 0.5% crystalviolet at room temperature for 30 min, and washed by PBSfor 3 times. Cells remained on the upper chamber wereerased gently with a cotton-tipped swap. Cells were observed and images were captured at an Olympus microscope system. Migrated and invaded cells were thencounted in randomly chosen three out of eight equally divided areas, followed by two-tailed Student’s t test to determine significant differences between two groups. P 0.05was considered statistically significant.Page 4 of 15Luminal B breast cancer tissue samplesTwenty paraffin-embedded tissue samples were derivedfrom 20 luminal B breast cancer patients diagnosed andtreated at the Department of Breast Surgery, The ThirdHospital of Nanchang, Jiangxi Province, China. The Ethics Committee at The Third Hospital of Nanchang approved the utilization of samples, and all patients signedthe informed consent form.Immunohistochemistry (IHC) staining assayTo detect the protein level of MTA1 and MTA2 in luminal B breast cancer patients, IHC was performed.Briefly, slices were deparaffinized in xylol. 10 mM sodium citrate (pH 6.0) was used for antigen retrieval, andendogenous peroxidase activity was eliminate with 3%H2O2. Then the slices were blocked with 1% bovineserum albumin/phosphate-buffered saline. Slices wereincubated with anti-MTA1 antibody (sc-17,773, 1:100)or anti-MTA2 antibody (sc-55,566, 1:100) and placed ina humidified chamber and at 4 C overnight. Reactionswere developed using GTvision TM III (Gene Technology, Shanghai, China) and counterstained with 10%hematoxylin. At last, the stained slices were dehydratedand mounted with resinene. The staining indexes (0–12)for MTA1/MTA2 was obtained as the staining intensity(negative (0); weak (1); moderate (2); and strong (3))multiplied by the proportion of positive staining ((0–25% (1); 25–50% (2); 50–75% (3); and 75–100% (4)).ResultsMTA1 overexpression inhibited the metastasis of ZR-7530 luminal B breast cancer cells in vitroTo investigate the role of MTA1 in luminal B breastcancer metastasis, we first established two stable celllines, ZR-75-30-MTA1 overexpressing MTA1 and ZR75-30-Vector as a control. MTA1 overexpression wasconfirmed by immunoblotting (Fig. 1a). Then, we evaluated the metastatic potential of these cell lines by Transwell chamber cell migration and invasion assays.Surprisingly, contradictory to the well-established rolesof MTA1, the overexpression of MTA1 significantlyinhibited the migration and invasion of ZR-75-30 cells invitro (Fig. 1b and c).We hypothesized that the metastasis-inhibitory role ofMTA1 in ZR-75-30 cells may due to the particularity ofZR-75-30 cell line. To testify our hypothesis, we overexpressed MTA1 in MDA-MB-231 cells, a triple negativebreast cancer cell line (Fig. 1d). The results of migrationand invasion assays indicated that overexpression ofMTA1 significantly promoted the migration and invasion of MDA-MB-231 cells in vitro (Fig. 1e and f ). Theresults showed that MTA1 played different roles in themigration and invasion of different breast cancer cells invitro.
Zhang et al. Cell Communication and Signaling(2019) 17:4Fig. 1 MTA1 overexpression inhibited the metastasis of ZR-75-30cells. a MTA1 was overexpressed in ZR-75-30-MTA1 stable cell linecompared to its control cell line ZR-75-30-Vector. Detected byimmunoblot. b Overexpression of MTA1 significantly inhibited themigration and (c) invasion of ZR-75-30 cells in vitro. Detected bytranswell migration and invasion assays. 30,000 cells migrated for 24h. Scale bars 200 μm, mean SD, n 3,***P 0.001, **P 0.01, ttest. c MTA1 was overexpressed in MDA-MB-231 cells comparedwith control cells. d Overexpression of MTA1 significantly promotedthe migration and (e) invasion of MDA-MB-231 cells in vitro. Scale bars 200 μm, mean SD, n 3,***P 0.001, **P 0.01, t testOverexpression of MTA1 downregulated MTA2, whichpromoted the metastasis of ZR-75-30 cellsThe overexpression of MTA1 has been shown to downregulate the expression of MTA2 at the protein levelPage 5 of 15instead of by transcriptional repression in breast cancercells [19]. Because of the role of MTA2 in breast cancermetastasis, we hypothesized it's the same reason forMTA1-induced metastasis inhibition. To verify our hypothesis, we evaluated the protein expression level ofMTA2 in ZR-75-30-MTA1 cells by immunoblotting andfound that it decreased (Fig. 2a).To validate the role of MTA2 in ZR-75-30 metastasis,we established a ZR-75-30-MTA2 cell line using thesame system used to establish the ZR-75-30-MTA1 cellline (Fig. 2b). MTA2 overexpression significantly enhanced ZR-75-30 cell metastasis in vitro (Fig. 2c and d).Knocking down MTA2 using two shRNAs targetingMTA2 significantly inhibited the metastasis of ZR-75-30cells in vitro (Fig. 2e and f ).To further verify our hypothesis, we measured themRNA expression level of MTA2 in ZR-75-30-Vectorand ZR-75-30-MTA1 cells by qRT-PCR. In accordancewith previous studies, the overexpression of MTA1 didnot repress MTA2 transcription (Fig. 2g).To further determine if there’s negative correlation between the protein levels of MTA1 and MTA2 in luminal B breastcancer patients, we performed Immunohistochemistry(IHC) staining for MTA1 and MTA2 on slices preparedfrom serial section. Scoring of the IHC staining ofMTA1 and MTA2 indicated a negative correlation between the protein level of MTA1 and MTA2 in luminalB breast cancer tissues (P 0.05), and representative images are shown (Fig. 2h).Both MTA1 and MTA2 have been reported to promote EMT and breast cancer metastasis. To investigatewhether the different roles of MTA1 and MTA2 inZR-75-30 cell metastasis are caused by the different rolesof these factors in the EMT of ZR-75-30 cells, we evaluated the expression levels of the indicators of EMT(Snail and N-cadherin) and found that both MTA1 andMTA2 upregulated the expression of these indicators(Fig. 2i).These data indicated that although both MTA1 andMTA2 promoted the EMT process in ZR-75-30 cells,the overexpression of MTA1 inhibited the metastasis ofZR-75-30 cells by decreasing MTA2 protein stability.Neutrophil elastase is responsible for MTA1-inducedMTA2 degradationTo further confirm the influence of MTA1 on the stability of MTA2, we conducted a protein stability assayusing cycloheximide (CHX). The results showed that theoverexpression of MTA1 significantly decreased the stability of MTA2 (Fig. 3a).To elucidate the mechanism bywhich MTA1 downregulates MTA2, we first treatedZR-75-30-MTA1 cells with MG132 (5 μM for 12 h) anddetected an upregulation of MTA1 (Fig. 3b), which wasreported to be regulated by the ubiquitin-proteasome
Zhang et al. Cell Communication and SignalingFig. 2 (See legend on next page.)(2019) 17:4Page 6 of 15
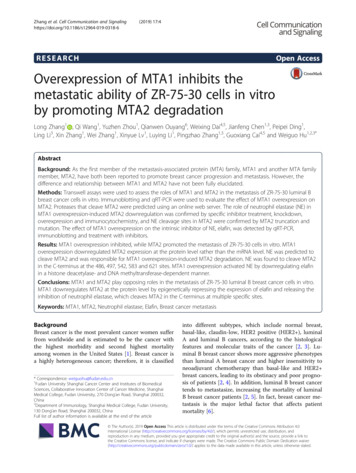
Zhang et al. Cell Communication and Signaling(2019) 17:4Page 7 of 15(See figure on previous page.)Fig. 2 Overexpression of MTA1 downregulated MTA2 which promotes the metastasis of ZR-75-30 cells. a MTA2 was downregulated by MTA1overexpression. b MTA2 was overexpressed in ZR-75-30-MTA2 cell line. c Overexpression of MTA2 significantly promoted the migration and (d)invasion of ZR-75-30 cells in vitro. 50,000 cells migrated for 20 h. 40,000 cells, invaded for 2.5d. Scale bars 200 μm, mean SD, n 3,**P 0.01,***P 0.001, t test. e MTA2 was knocked down by 2 shRNAs specifically targeting MTA2. f MTA2 knockdown significantly inhibited the migrationand invasion of ZR-75-30 cells. 35,000 cells and 50,000 cells migrated for 36 h and invaded for 3.5d respectively. Scale bars 200 μm, mean SD,n 3,**P 0.01,***P 0.001, t test. g Overexpression of MTA1 did not repress the transcription of MTA2. Detected by qRT-PCR. Mean SD, n 3,RQ value: relative quantified value of mRNA expression. h The protein level of MTA1 and MTA2 are negatively correlated in tissues derived fromluminal B breast cancer patients. Detected by IHC. Scale bars in upper box 50 μm, scale bars in lower box 100 μm. i Both overexpression ofMTA1 and MTA2 increased EMT landmarks Snail and N-cadherinpathway [22]. However, we did not detected the upregulation of MTA2 by immunoblotting (Fig. 3b). Further,we predicted enzymes that may cleave MTA2 by itsamino acid sequence using the PROtease Specificity Prediction servER [23] (PROSPER). MTA2 was predicted tobe cleaved by four types of proteases, including asparticproteases, cysteine proteases, metalloproteases andserine proteases, among which the serine protease neutrophil elastase (NE) was predicted to cleave MTA2 withthe highest probability (Fig. 3c). To evaluate whether NEcan degrade MTA2, we overexpressed NE in ZR-75-30cells, and as shown in Fig. 3d, the overexpression of NEled to a decrease in MTA2, and suprisingly, a decreasein MTA1.To verify whether NE is responsible for MTA1-induced MTA2 degradation, we first treated ZR-7530-MTA1 cells with a specific NE inhibitor, sivelestat,with a concentration gradient or with the solvent ofsivelestat (DMSO) as a control for 24 h. As shown inFig. 3e, the treatment of ZR-75-30-MTA1 cells withsivelestat restored MTA2 in a dose-dependent manner.Furthermore, we observed that the protein expressionlevel of MTA1 also increased in the same manner asMTA2. The increase in MTA1 was not expected, but itfurther indicated that NE is responsible forMTA1-induced deregulation of MTA2 because the increase in MTA1 did not further downregulate MTA2.To further confirm the role of NE in MTA1-inducedMTA2 degradation, we knocked down NE inZR-75-30-MTA1 cells. The immunoblot results showedthat knocking down NE led to a similar result as thesivelestat treatment (Fig. 3f ).As a serine protease that is stored in large quantitiesin neutrophil cytoplasmic azurophilic granules [24, 25],the interaction of NE with MTA2 that is located in thenucleus needed to be elucidated. Therefore, we cotransfected HA-tagged MTA2 with an empty vector or withFLAG-tagged NE into HeLa cells and analyzed the cellular location of these molecules by immunocytochemistry(ICC). HA-tagged MTA2 was exclusively detected in nuclei, while it was colocalized with NE in the cytoplasm(Fig. 3g and h), providing evidence of an interaction between MTA2 and NE.MTA1 repressed the transcription of elafin, an intrinsic NEinhibitor, in an HDAC- and/or DNMT-dependent mannerTo further exploit the association between MTA1 andserine protease NE, we tested whether MTA1 couldtranscriptionally regulate NE, its intrinsic inhibitors andsome other intrinsic serine protease inhibitors. TheqRT-PCR results showed that MTA1 overexpression significantly repressed the transcription of 2 intrinsic inhibitors of NE, elafin and α1-PI. Besides, the transcriptionlevel of serine protease inhibitors Serpin B5 and SerpinB7 were also significantly decreased following MTA1overexpression (Fig. 4a). We chose the dramatically decreased NE inhibitor, elafin, for further investigation. Immunoblotting also showed a decrease in elafin at theprotein level in ZR-75-30-MTA1 cells (Fig. 4b). To further confirm that the downregulation of elafin by MTA1leads to MTA2 degradation, we knocked down elafin inZR-75-30 cells with two shRNAs and found a decreasein MTA2 and MTA1 expression levels, in accordancewith the results shown in Fig. 3.As a constitutive component of the NuRD complex,MTA1 could epigenetically modulate gene expression. Toexplore the mechanism by which MTA1 regulates elafin,we treated ZR-75-30-MTA1 cells with a concentration gradient of an HDAC inhibitor, suberoylanilide hydroxamicacid (SAHA, which is also known as vorinostat) and thesolvent (DMSO) as a control for 48 h. The qRT-PCR results showed that treatment with SAHA significantly upregulated elafin transcription in a dose-dependent manner,and the transcription level of elafin in ZR-75-30-MTA1cells was even released to a level exceeded that ofZR-75-30-Vector cells after SAHA treatment, indicating astrong repression of elafin transcription by MTA1/HDACs(Fig. 4d). MTA1 and MBD2 (or MBD3) jointly participatein NuRD formation, and it has been reported thatMTA1 forms a complex with DNMT to regulate geneexpression. Therefore, we also hypothesized that MTA1may regulate elafin transcription in a DNA methyltransferase (DNMT)-dependent manner. Treatmentwith a DNMT inhibitor, azacitidine (AZA), also led to asignificant release of elafin transcription, indicating thatMTA1 overexpression inhibited elafin transcription in aDNMT-dependent manner.
Zhang et al. Cell Communication and Signaling(2019) 17:4Page 8 of 15Fig. 3 NE is responsible for MTA1 induced MTA2 downregulation. a Overexpression of MTA1 decreased the protein stability of MTA2. bTreatment of ZR-75-30-MTA1 cells with MG132 (5 μM, 12 h) increased the protein level of MTA1 but did not increase that of MTA2. c Schematicdiagram of the proteases predicted to cleave MTA2 at PROSPER website.NE is predicted to have the most cleavage sites in MT
RESEARCH Open Access Overexpression of MTA1 inhibits the metastatic ability of ZR-75-30 cells in vitro by promoting MTA2 degradation Long Zhang1, Qi Wang1, Yuzhen Zhou1, Qianwen Ouyang6, Weixing Dai4,5, Jianfeng Chen1,3, Peipei Ding1, Ling Li3, Xin Zhang1, Wei Zhang1, Xinyue Lv1, Luying Li1, Pingzhao Zhang1,3, Guoxiang Cai4,5 and Weiguo Hu1,2,3* Abstract