Transcription
Yuan et al. Stem Cell Research & 019) 10:330RESEARCHOpen AccessAutofluorescence of NADH is a newbiomarker for sorting and characterizingcancer stem cells in human gliomaYe Yuan, Zexuan Yan, Jingya Miao, Ruili Cai, Mengsi Zhang, Yanxia Wang, Lihong Wang, Weiqi Dang, Di Wang,Dongfang Xiang, Yan Wang, Peng Zhang, Youhong Cui*, Xiuwu Bian* and Qinghua Ma*AbstractBackground: The existing cell surface markers used for sorting glioma stem cells (GSCs) have obvious limitations,such as vulnerability to the enzymatic digestion and time-consuming labeling procedure. Reduced nicotinamideadenine dinucleotide (NADH) as a cellular metabolite with property of autofluorescence has the potential to beused as a new biomarker for sorting GSCs.Methods: A method for sorting GSCs was established according to the properties of the autofluorescence ofNADH. Then, the NADHhigh and NADHlow subpopulations were sorted. The stem-like properties of thesubpopulations were evaluated by qRT-PCR, western blot analyses, limiting dilution assay, cell viability assay,bioluminescence imaging, and immunofluorescence analysis in vitro and in vivo. The relationship between CD133 /CD15 cells and NADHhigh subpopulation was also assessed.Results: NADHhigh cells expressed higher stem-related genes, formed more tumor spheres, and harbored strongerpluripotency in vitro and higher tumorigenicity in vivo, compared to NADHlow subpopulation. NADHhigh gliomacells had the similar stemness with CD133 or CD15 GSCs, but the three subpopulations less overlaid each other.Also, NADHhigh glioma cells were more invasive and more resistant to chemotherapeutic drug temozolomide (TMZ)than NADHlow cells. In addition, the autofluorescence of NADH might be an appropriate marker to sort cancer stemcells (CSCs) in other cancer types, such as breast and colon cancer.Conclusion: Our findings demonstrate that intracellular autofluorescence of NADH is a non-labeling, sensitivemaker for isolating GSCs, even for other CSCs.Keywords: Glioma stem cells, Autofluorescence, NADH, FACS, BiomarkerBackgroundGlioma stem cells (GSCs) are believed to be responsiblefor tumor initiation, progression, chemo- and radioresistance, and recurrence of gliomas [1–4]. The identification and isolation of GSCs are crucial for a betterunderstanding of their properties and developing GSCtargeting therapies. GSCs are usually identified and isolated from primary tumors or glioma cell lines byfluorescence-activated cell sorting (FACS) based on the* Correspondence: cuiyouhongx@yahoo.com; bianxiuwu@263.net;qinghuama1982@163.comInstitute of Pathology and Southwest Cancer Center, Key Laboratory of theMinistry of Education, Southwest Hospital, Third Military Medical University(Army Medical University), Chongqing 400038, Chinacell surface makers, such as CD133 and CD15. Earlystudies reported that only 100 CD133-positive cells ofglioma could produce a phenocopy of parent tumor inNOD-SCID mice, whereas 105 CD133-negative cellscould not [1, 5]. CD15 has also been considered as another reliable surface marker for isolating GSCs [6].However, recent studies indicated that CD133- orCD15-negative glioma cells also possessed some GSCcharacteristics [6–8]. It is unclear whether partialCD133/CD15-negative cells have the properties of CSCsper se or partial CD133/CD15-negative GSCs are derived from CD133/CD15-positive subpopulation missingthe markers by enzymatic digestion [9, 10]. In addition,the antibodies of CD133/CD15 are expensive and the The Author(s). 2019 Open Access This article is distributed under the terms of the Creative Commons Attribution 4.0International License (http://creativecommons.org/licenses/by/4.0/), which permits unrestricted use, distribution, andreproduction in any medium, provided you give appropriate credit to the original author(s) and the source, provide a link tothe Creative Commons license, and indicate if changes were made. The Creative Commons Public Domain Dedication o/1.0/) applies to the data made available in this article, unless otherwise stated.
Yuan et al. Stem Cell Research & Therapy(2019) 10:330labeling process is time-consuming. Therefore, it is necessary to find alternative strategies, which are morespecific, simple, and economic for the isolation of GSCs.Energy metabolism is involved in the self-renewal, reprogramming, and differentiation of regular stem cellsand cancer stem cells (CSCs) [11, 12]. Reduced nicotinamide adenine dinucleotide (NADH) is a key carrier ofelectrons in cellular energy metabolism. It possesses aproperty of autofluorescence with an excitation wavelength at 340 30 nm and an emission wavelengthwithin the 460 50 nm range [13, 14], and has been usedas an important intracellular autofluorescence component to non-invasively monitor and analyze metabolicactivity of living cells and tissues [15, 16]. Recently,NADH fluorescence intensity and fluorescence lifetimeof bound and free NADH have been used to distinguishstem cells from their differentiated progeny [17–19]. Besides, NADH has been used to screen or monitor GSCmetabolic state by using fluorescence lifetime microscopy (FLIM) [20]. However, the usability of NADH autofluorescence in the isolation and purification of GSCs byFACS has not been evaluated.In the present study, we applied the autofluorescenceof NADH as a non-labeling marker to isolate GSCs byFACS. Compared to NADHlow subpopulation, NADHhighsubpopulation exhibited higher stem-like properties,including abilities of self-renewal, multilineage differentiation, and tumorigenesis, as well as higher invasive ability and resistance to chemotherapeutic temozolomide(TMZ). Besides, NADHhigh as a biomarker could be usedto isolate breast and colon CSCs. Therefore, NADH is asuitable biomarker for the isolation of GSCs or otherCSCs.Materials and methodsHuman glioma specimens and the preparation of singlecell suspensionA total of 13 fresh surgical glioma specimens were collected from patients enrolled in the Southwest Hospital,Third Military Medical University, Chongqing, China,after signing an informed consent from patients or theirguardian. All patients had not received chemoradiotherapy before surgery. The histopathological grading was inaccordance with the World Health Organization (WHO)classification (2016). The clinicopathologic informationof these patients is summarized in Additional file 1:Table S1. This study was approved by the Ethics Committee of Southwest Hospital.To prepare the single cell suspension, fresh surgicalglioma tissues were collected and cut into small piecesimmediately, and then, glioma cells were isolated usingthe Papain Dissociation System (Worthington Biochemical, Lakewood, NJ, USA) as previously reported [21, 22]and suspended in PBS at 1–5 106 cells/mL.Page 2 of 13Cell lines and cultureGlioma cell lines (T98G, LN229), breast cancer cell line(MDA-MB-231), and colon cell line (HT-29) were purchased from ATCC (VA, USA). Primary glioma cellsGBM1 and GBM2 were respectively isolated from two human glioma surgical specimens in our laboratory [23, 24].All the cell lines were maintained in DMEM (HyClone,USA) supplemented with 10% fetal bovine serum (FBS)(HyClone, USA). The medium for tumorsphere culture wascomposed of F12 medium containing 20 μL/mL B27 supplement (Gibco, USA), 20 ng/mL basic fibroblast growthfactor (bFGF), and 20 ng/mL epidermal growth factor(EGF) (both from PeproTech, USA) without serum. All thecells were cultured at 37 C in 5% CO2 and 100% humidity.FACS analysis and cell sortingThe cultured glioma cells were digested by trypsin oraccutase and resuspended with PBS. The fresh gliomaspecimens were transferred to laboratory on ice in halfhour after surgery, then washed and enzymatically dissociated into single cells and resuspended in PBS. Thestaining procedures for CD133 and CD15 markers wereperformed as previously described [6, 8]. The labelingantibodies were anti-CD133-APC antibody (CloneREA816; Miltenyi Biotec, Germany) and anti-CD15FITC antibody (Biolegend, USA) with REA Control (S)APC (Miltenyi Biotec, Germany) and FITC Mouse IgM(Biolegend, USA) as controls, respectively.The FACS analysis and cell sorting were performed onBD FACS Aria II cytometer (USA) or Beckman mofloXDP (USA). For analyzing and sorting with NADH autofluorescence intensity as a marker, an excitation wavelength of 375 nm or 355 nm and an emission wavelengthof 450/50BP filter were used. For analyzing and sortingwith CD133 and CD15 as markers, labeled cells were analyzed and sorted with corresponding excitation andemission wavelengths of the fluorochrome. All data wereanalyzed with BD FACSDiva software version 8 or Beckman moflo XDP submmit 5.2.Limiting dilution assayLimiting dilution assay was performed as previously described [24]. Briefly, serial twofold dilutions (from 40 to0 cells) of different glioma, breast cancer, and colon cellswere seeded into ultra-low adhesion 96-well plates (10wells per dilution) (Costar, USA) and cultured in tumorsphere medium. After incubation for 2 weeks, wells without spheres (log2, Y-axis) were counted and plottedagainst the number of cells plated per well (X-axis) tocalculate the sphere formation efficiency.RNA preparation and qRT-PCRTotal RNAs from sorted cells by FACS were extracted withRNA extracting Kit (Fastagen, China) according to the
Yuan et al. Stem Cell Research & TherapyFig. 1 (See legend on next page.)(2019) 10:330Page 3 of 13
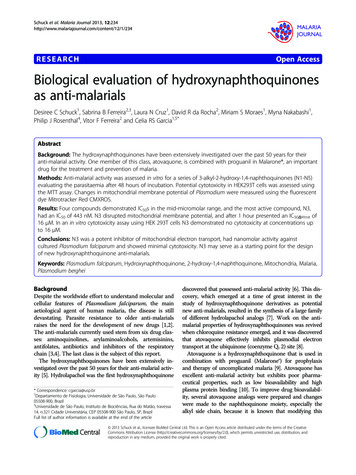
Yuan et al. Stem Cell Research & Therapy(2019) 10:330Page 4 of 13(See figure on previous page.)Fig. 1 NADHhigh and NADHlow glioma cell subpopulations can be sorted according to their intensity of NADH autofluorescence. a The intensityof NADH autofluorescence increased with WHO grades in primary glioma cells. Also, the intensity of NADH autofluorescence in patients withinsame grade II (n 4) or III (n 3) was similar, but major difference in grade IV (n 6) patients was observed. b Glioma cells with the highest top10% and lowest bottom 10% intensity of NADH autofluorescence were defined as NADHhigh and NADHlow, respectively. c The intensity of NADHautofluorescence in sorted NADHhigh and NADHlow glioma cells was verified by confocal microscopy. All data are presented as the means SD.*p 0.05, **p 0.01 (n 3 independent experiments)manufacturer’s instructions. One microgram of total RNAwas reverse transcribed with the Reverse Transcription Kit(Takara, Dalian, China). Quantitative real-time PCR wascarried out using the SYBR PrimeScript PCR kit II(TaKaRa, Japan). The level of β-tubulin mRNA was used asthe internal control. The primers used in this study arelisted in Additional file 1: Table S2.and right flank as the control group. Tumor growth wasmonitored by bioluminescence imaging using In VivoImaging System (IVIS) Spectrum (Perkin Elmer, USA)and Living Image Software for IVIS (Perkin Elmer). Atthe end of 6 weeks after the injection, the mice werekilled. Xenograft tumors were removed and weighted.Western blottingCell viability assay and IC50 evaluationDifferent subpopulations of GBM1 and LN229 cells wereseeded in 96-well plates at 2 103 cells/well and treatedwith TMZ at the indicated concentrations for 48 h. Theviability of glioma cells was measured by using a CellCounting Kit-8 (Beyotime, China) according to the manufacturer’s instructions. The OD values at 450 nm wererecorded by fluoroanalyzer (Floskan Ascent, USA).Immunofluorescence analysisFor induction of differentiation, NADHhigh cells were cultured in DMEM with 10% FBS for 7 days. The NADHhighcells cultured in same conditions within 6 h were used ascontrols. Both differentiated and control cells were fixedin 4% paraformaldehyde for 30 min, washed three timeswith PBS at room temperature, and incubated with blocking buffer containing 10% normal goat serum and 0.3%Triton. The samples were incubated with primary antibodies anti-Sox2 (#3579, 1:400, CST), anti-Nestin(#33475, 1:400, CST), and anti-GFAP (#12389, 1:400,CST) overnight at 4 C. Hoechst 33342 was used to counterstain the cell nuclei. After washing with PBS, the samples were mounted with Immuno-Mount (ThermoScientific, USA) and then examined on a LEICA TCS-SP5confocal microscope ( 63 objective).Xenograft in NOD-SCID mice and bioluminescenceimagingThe animal study was performed in accordance with theprotocol approved by the Institutional Animal Care andUse Committee of Southwest Hospital, Third MilitaryMedical University (TMMU). NOD/SCID female mice(5 weeks old) were purchased from the Laboratory Animal Center of TMMU. Different treated GBM cells werewashed and resuspended in PBS and mixed with Matrigel (1:1, BD Biosciences), then subcutaneously injectedinto NOD/SCID mice at 4 103, 4 104, and 4 105cells (100 μL/site) with the left flank as the test groupWestern blotting was performed as previously described[25]. The primary antibodies used in western blot wereanti-Sox2 (#3579, 1:1000, CST), anti-CD133 (#64326, 1:1000, CST), anti-Nanog (#8822, 1:1000, CST, USA), andanti-β-tubulin (#2128, 1:10000, CST).Transwell invasion analysisGlioma cells were seeded into the upper chambers(Millipore, 8.0 μm, 24 well) that were coated with 15 μL/well of Matrigel in advance (Corning, USA) at the density of 3 104 cells/well in 200 μL of serum-free DMEM,and then, the upper chambers were placed in a 24-wellplate added with 600 μL/well DMEM supplemented with10% FBS. After incubation for 24 h, the cells were fixedwith 4% paraformaldehyde followed by crystal violetstaining. Non-invading cells were removed with a cottonswab, and the images of stained cells were collected bymicroscope (Olympus, Japan).Statistical analysisAll experiments were performed at least three times.Statistical analysis was performed by using SPSS statistical software (SPSS16.0, Chicago, CA, USA) and GraphPad Prism 6 software (GraphPad, La Jolla, CA, USA).The unpaired two-group comparison and multiple comparisons were made with Student’s t test or one-wayANOVA, respectively. Data were presented as themean SD. Statistical significance was set at *p 0.05,**p 0.01, and ***p 0.001.ResultsNADHhigh and NADHlow subpopulations can be sortedfrom glioma cells by FACS in vitroBy using flow cytometry, we firstly examined the autofluorescence intensity of NADH in 13 fresh glioma tissues, including 4 WHO grade II, 3 grade III, and 6 gradeIV. The autofluorescence intensity of NADH was increased with WHO grades (grade IV grade III grade
Yuan et al. Stem Cell Research & TherapyFig. 2 (See legend on next page.)(2019) 10:330Page 5 of 13
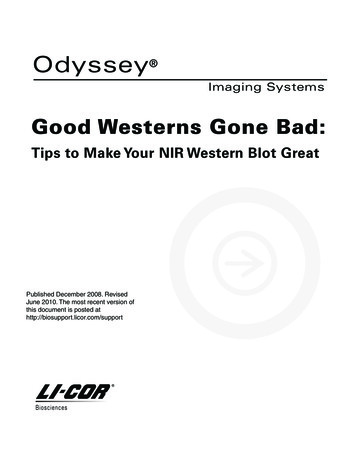
Yuan et al. Stem Cell Research & Therapy(2019) 10:330Page 6 of 13(See figure on previous page.)Fig. 2 NADHhigh glioma cells exhibit characteristics of GSCs in vitro. a qRT-RCR and western blotting analyses showed higher expression levels ofstem-related genes in NADHhigh cells than in NADHlow cells in GBM1 and LN229 cell lines. b, c Limiting dilution assays showed highertumorsphere formation rates and longer average diameter of tumorsphere in NADHhigh cells compared to NADHlow cells in GBM1 and LN229 celllines. d Cultured in medium supplemented with 10% FBS for 7 days, NADHhigh cells markedly reduced the autofluorescence of NADH and theexpression of neural stem/progenitor markers Sox2 and Nestin, but re-expressed high astroglial marker GFAP. Scale bar 50 μm. All data arepresented as the means SD. *p 0.05, **p 0.01, ***p 0.001 (n 3 independent experiments)II); in low-grade gliomas (grades II and III), the autofluorescence intensity of NADH was similar between thesamples, but large difference between samples was observed in grade IV (Fig. 1a, Additional file 1: Figure S1).According to previous reports [26, 27], we defined thehighest top 10% intensity as high autofluorescence ofNADH (NADHhigh) and defined the lowest bottom 10%intensity as low autofluorescence of NADH (NADHlow).Accordingly, we sorted the subpopulations with top 10%and bottom 10% intensity of NADH autofluorescencefrom GBM1 and LN229 cells (Fig. 1b). To confirm theautofluorescence intensity of NADH in both NADHhighand NADHlow subpopulations, we examined the intensity of NADH autofluorescence with confocal analysis.The cells with top 10% intensity of NADH showedstrong autofluorescence intensity, while the cells withbottom 10% intensity of NADH had weak fluorescencesignal (Fig. 1c). These results indicate that NADHhighand NADHlow subsets existed in glioma cells and couldbe promptly isolated by FACS.NADHhigh glioma cells exhibit GSC traits in vitroTo evaluate the stem-related properties of NADHhighand NADHlow glioma cells in vitro, we first comparedthe expression of stem-related genes in both subpopulations. Compared to NADHlow subpopulation, NADHhighglioma cells highly expressed stem-related genes Nanog,Oct-4, Oligo2, and Sox2 at both mRNA and proteinlevels in GBM1 and LN229 cells (Fig. 2a). Then, thetumorsphere formation of NADHhigh and NADHlow cellswas measured through a limiting dilution analysis. Incomparison with NADHlow glioma cells, NADHhigh cellsshowed higher rate of tumorsphere formation in bothGBM1 and LN229 cells (p 0.01 for both) (Fig. 2b).Moreover, the average diameter of the tumorspheres derived from NADHhigh cells was about twice as much asthat derived from NADHlow cells in GBM1 and LN229cells (p 0.01 for both) (Fig. 2c).Previous studies showed that GSCs harbored multipotency to differentiate into neurons, astrocytes, and oligodendrocytes, and stem cell markers disappeared with thedifferentiation [28, 29]. Hence, we evaluated whether theNADHhigh subpopulation had multiple differentiationpotential by a differentiation assay. As expected, the differentiated NADHhigh cells almost lost not only autofluorescence of NADH but also neural stem/progenitormarkers Sox2 and Nestin and re-expressed astroglialmarker GFAP (Fig. 2d). Thus, these data strongly indicate that NADHhigh glioma cells have the characteristicsof GSCs in vitro.NADHhigh glioma cells show high tumorigenicity in vivoThe stem-related properties of NADHhigh and NADHlowglioma cells in vivo were further evaluated by xenograftexperiment in NOD-SCID mice. Bioluminescent analyses showed that the tumor size derived from NADHhighsubpopulation was significantly larger than thatderived from NADHlow subpopulation in LN229 cells at28 days after implantation (Fig. 3a). As shown in Fig. 3band Additional file 1: Table S3, the tumor incidence rateof NADHhigh cells was higher than that of NADHlowcells. The weight of tumors derived from NADHhigh cellswas heavier than that derived from NADHlow cells(Fig. 3b). H&E staining confirmed the glioma origin oftumors, and IHC showed that the tumors derived fromNADHhigh cells exhibited higher Ki-67 and Sox2 expression than those derived from NADHlow cells (Fig. 3c).These results indicate that NADHhigh glioma cells havehigh tumorigenicity in vivo.NADHhigh glioma subpopulation possesses similar stemlike properties with CD133 or CD15 cells, but onlypartially overlaps with themSince CD133 and CD15 are usually used as makers toenrich GSCs by FACS, the relationship between NADHhigh, CD133 , and CD15 subpopulations was assessed.We first measured the proportions of CD133 andCD15 cells in GBM1, GBM2, T98G, and LN229 cellsand found that the percentages were 0.73 0.04%,0.47 0.04%, 1.37 0.22%, and 0.53 0.04%, and 0.50 0.07%, 0.1%, 4.77 0.24%, and 0.13 0.09%, respectively(Additional file 1: Figure S2 and Figure S3, Table 1),which was consistent with previous reports [30–32]. Wethen compared the proportions of CD133 andCD15 cells in NADHhigh and NADHlow subpopulationsin those glioma cell lines. The percentages of CD133 cells were elevated about two times in NADHhigh subpopulation, but no obvious change in NADHlow subpopulations of those cell lines (Additional file 1: Figure S2,Additional file 1: Table S1). The proportion changes ofCD15 cells in NADHhigh and NADHlow subpopulationswere similar to those of CD133 cells (Additional file 1:
Yuan et al. Stem Cell Research & TherapyFig. 3 (See legend on next page.)(2019) 10:330Page 7 of 13
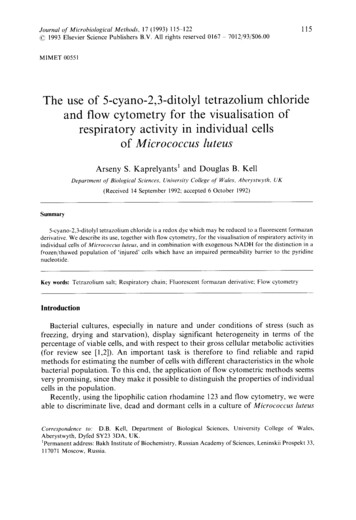
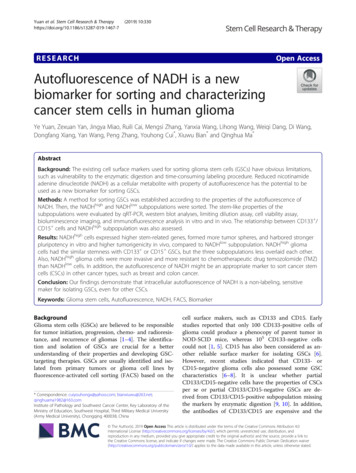
Yuan et al. Stem Cell Research & Therapy(2019) 10:330Page 8 of 13(See figure on previous page.)Fig. 3 NADHhigh glioma cells exhibit characteristics of cancer stem cells in vivo. a Bioluminescent images and quantification showed that thetotal flux of the tumors derived from NADHhigh LN229 cells (left flank) was extremely higher than that of the tumors derived from NADHlowLN229 cells (right flank) at 28 days after subcutaneous implantation in NOD/SCID mice. Also, the total photon flux of the tumors was increasedwith implanted cell number. Signal intensity is represented as p/s/cm2/sr. b The images of xenograft tumors showed that NADHhigh LN229 cellshad higher rate of tumor formation than NADHlow cells (left panel). Weight statistical diagram showed that the weight of NADHhigh LN229 cellderived tumors was heavier than that of NADHlow LN229 cell-derived tumors (right panel). c H&E staining confirmed the glioma origin of thexenograft tumors, and IHC staining showed that NADHhigh LN229 cell-derived tumors expressed higher expression of Sox2 and Ki67 thanNADHlow cells. Scale bar 50 μm. All data are presented as the means SD. *p 0.05, **p 0.01, ***p 0.001 (n 3 independent experiments)was markedly larger than that of NADHlow/CD133 -derived tumorspheres in GBM1214 and LN229 (Fig. 4c).The similar results were observed in the subpopulationswhich combined NADH and CD15 markers (Additional file 1: Figure S5B and C). Therefore, these resultssuggest that NADHhigh subpopulation exhibits similarstemness traits with CD133 and CD15 subpopulationsin vitro.Figure S3, Additional file 1: Table S1). The proportion ofNADHhigh cells in CD133 and CD15 subpopulationswas also analyzed. The percentages of NADHhigh cellsranged from 20.1 to 63.7% in CD133 subpopulationand from 10 to 86.2% in CD15 subpopulation in thefour cell lines (Additional file 1: Figure S4). These resultssuggest that NADHhigh subpopulation is only partiallyoverlapped with CD133 or CD15 subpopulation.To further illustrate the relationship among NADHhigh, CD133 , and CD15 subpopulations, we comparedthe stem-like properties of subpopulations with differentcombination of the expression status of NADH andCD133/CD15, including NADHhigh/CD133 , NADHhigh/CD133 , NADHlow/CD133 , NADHlow/CD133 , NADHhigh/CD15 , NADHhigh/CD15 , NADHlow/CD15 , andNADHlow/CD15 . NADHhigh/CD133 subpopulationshowed the highest expression of stem-related genesNanog, Oct4, Oligo2, and Sox2, whereas NADHlow/CD133 subpopulation had the lowest expression ofthose genes in GBM1 and LN229 cells (Fig. 4a). Compared to NADHhigh/CD133 and NADHlow/CD133 subpopulations, both NADHhigh/CD133 and NADHlow/CD133 subpopulations exhibited medium expressionlevels of those genes (Fig. 4a). Similar results were observed in the subpopulations which combined NADHand CD15 markers (Additional file 1: Figure S5A). Correspondingly, NADHhigh/CD133 subpopulation had thehighest ability of tumorsphere formation, NADHlow/CD133 subpopulation had the lowest ability of tumorsphere formation, and NADHhigh/CD133 and NADHlow/CD133 subpopulations exhibited the medium abilityof tumorsphere formation in GBM1 and LN229 cells(Fig. 4b). Besides, compared to the diameter, the averagediameter of tumorspheres derived from NADHhigh/CD133 , NADHhigh/CD133 , and NADHlow/CD133 The invasion ability and temozolomide resistance ofNADHhigh subpopulation are comparable with CD133 and CD15 subpopulations in glioma cellsPrevious studies have demonstrated that GSCs are implicated in tumor invasiveness and chemotherapeutic resistance [33, 34]. Compared with NADHlow subpopulation,NADHhigh subpopulation had higher invasive ability inLN229 and GBM1 cells (p 0.01 for both) (Fig. 5a). Theinvasive abilities between NADHhigh, CD133 , and CD15 subpopulations were comparable (p 0.01) (Fig. 5a andAdditional file 1: Figure S8). Moreover, NADHhigh cellswere less sensitive to TMZ than NADHlow cells (Fig. 5b).CD133 and CD15 cells were more resistant to TMZthan CD133 and CD15 cells (Fig. 5b), which were consistent with the previous reports [33, 35]. These resultssuggest that NADHhigh subpopulation has similar malignant behaviors of invasion and chemotherapeutic resistance with CD133 and CD15 subpopulations.The intensity of NADH autofluorescence can be used as abiomarker to sort other CSCsIn order to assess whether the intensity of NADH autofluorescence was suitable for isolating the CSCs in other tumors, we sorted NADHhigh and NADHlow subpopulationsfrom breast cancer cell line MDA-MB-231 and colorectalcancer cell line HT-29. With limiting dilution, we evaluatedTable 1 The percentage of CD133 and CD15 cells in NADHhigh/low subpopulations of glioma cell linesCelllinesPercentage of CD133 cellsPercentage of CD15 cellsTotalNADHNADHTotalNADHhighNADHlowGBM10.73 0.042.10 0.130.60 0.130.50 0.072.47 0.440.43 0.09GBM20.47 0.042.63 0.240.43 0.110.10.40 0.130T98G1.37 0.222.27 0.220.63 0.314.77 0.246.40 0.076.23 0.51LN2290.53 0.041.83 0.180.80 0.130.13 0.040.67 0.040.27 0.04highlow
Yuan et al. Stem Cell Research & Therapy(2019) 10:330Page 9 of 13Fig. 4 Both NADHhigh and CD133 glioma cells possess the properties of GSCs, but are independent each other. a qRT-PCR analysis showingupregulated stemness-related transcription factor genes Nanog, Oct4, Oligo2, and Sox2 in NADHhigh CD133 , NADHhigh CD133 , and NADHlowCD133 subpopulations, compared to NADHlow CD133 in GBM1 and LN229. b, c Limiting dilution assay showed increased sphere formation rateand sphere average diameter of NADHhigh/CD133 , NADHhigh/CD133 , and NADHlow/CD133 subpopulations, compared to NADHlow CD133 cellsin GBM1 and LN229 cell lines. All data are presented as the means SD. *p 0.05, **p 0.01, ***p 0.001 (n 3 independent experiments)the self-renewal capability between NADHhigh/ALDH ,NADHhigh/ALDH , NADHlow/ALDH , and NADHlow/ALDH cells. Compared to NADHlow/ALDH subpopulation, NADHhigh/ALDH , NADHhigh/ALDH , and NADHlow/ALDH exhibited higher ability of tumorsphereformation both in MDA-MB-231 and HT-29 (Fig. 6a). Besides, the average diameter of the tumorspheres derivedfrom NADHhigh/ALDH , NADHhigh/ALDH , and NADHlow/ALDH was larger than that from NADHlow/ALDH both in MDA-MB-231 and HT-29 (Fig. 6b). Thus, theintensity of NADH autofluorescence could be used as abiomarker to isolate CSCs from breast cancer and colorectal cancer, implying that the intensity of NADH autofluorescence might be an extensive biomarker for CSCs.DiscussionMany endogenous ingredients of cells and tissues, such assome amino acids, collagen, elastin, NAD(P) H, flavin adenine dinucleotide (FAD), vitamins, lipids, and porphyrins,possess natural autofluorescence [36, 37]. Because these
Yuan et al. Stem Cell Research & Therapy(2019) 10:330Page 10 of 13Fig. 5 The invasion ability and TMZ resistance of NADHhigh glioma cells are similar to the ability of CD133 and CD15 subpopulation in gliomacells. a The quantitative histograms of invasion showed that invasion ability was significantly increased in NADHhigh, CD133 , and CD15 LN229and GBM1 cells. b Effect of TMZ resistance in CD133, CD15, and NADH. IC50 of TMZ in CD133 and NADHhigh was higher than in CD133 , andNADHlow of GBM1 and LN229. The similar result was in CD15 of GBM1, but IC50 of TMZ in CD15 of LN229 was not different. All data arepresented as the means SD. **p 0.01, ***p 0.001 (n 3 independent experiments)endogenous autofluorescence ingredients are the metabolites of cells or tissues, their autofluorescence intensitymay directly reflect the physiological and/or pathologicalstatus of cells and tissues. So far, only the autofluorescenceof NAD(P) H and FAD has been widely studied, mainly tobe used in monitoring alteration of metabolic profiles andcellular oxidation-reduction status [38–40]. Moreover, theautofluorescence of NAD(P) H and FAD has been studiedin normal stem cells and CSCs. Quinn et al. reported thatthe quantitative metabolic imaging using the endogenousfluorescence of NADH and FAD could monitor humanmesenchymal stem cell differentiation into adipogenic andosteoblastic lineages [41]. Fluorescence of free andprotein-bound NADH could discriminate different differentiation stages of neuronal progenitor stem cells [42].Buschke et al. used multiphoton flow cytometry to non-
Yuan et al. Stem Cell Research & Therapy(2019) 10:330Page 11 of 13Fig. 6 The intensity of NADH autofluorescence as a biomarker can be used to sort breast cancer stem cells and colon cancer stem cells. aLimiting dilution showed that compared to NADHlow/ALDH cells, NADHhigh/ALDH , NADHhigh/ALDH , and NADHlow/ALDH have higher sphereformation in MDA-MB-231 and HT-29. b, c The average diameter of the tumorspheres in NADHhigh/ALDHhigh, NADHhigh/ALDHlow, and NADHlow/ALDHhigh subpopulations was larger than that in NADHlow/CD133 subpopulations in MDA-MB-231 and HT-29 cells. All data are presented as themeans SD. **p 0.01, *p 0.05 (n 3 independent experiments)invasively characterize and purify populations of intactstem cell aggregates based on NADH intensity andassessed the differentiation capacity of sorted populations[43]. Bonuccelli et al. demonstrated that NAD(P) H autofluorescence was a new metabolic biomarker for CSCs inMCF-7 breast cancer cell line and sorted high NAD(P) Hautofluorescence intensity cells exhibited CSC phenotype[26]. Miranda-Lorenzo et al. used FAD autofluorescenceas a novel tool to isolate and characterize epithelial CSCs,but it had obvious limitations, such as exogenous riboflavin needed to be added to enhance the sensitivity, and theexperimental results varied with the concentrations ofriboflavin, incubation times, and cell concentrations [44].Therefore, in comparison with FAD, NADH autofluorescence is a more reliable and promisi
BD FACS Aria II cytometer (USA) or Beckman moflo XDP (USA). For analyzing and sorting with NADH au-tofluorescence intensity as a marker, an excitation wave-length of 375nm or 355nm and an emission wavelength of 450/50BP filter were used. For analyzing and sorting with CD133 and CD15 as markers, labeled cells were an-