Transcription
MeasurementUncertainty GuideISO 15189 Accreditation Program
Background—Why This is NecessaryThe ISO 15189:2012 standard contains enhanced expectations regarding measurementuncertainty (MU) in clause 5.5.1.4. To clarify the laboratory’s responsibility and the CAP’s 15189assessment standards, we have developed this interpretive document for the purposes ofaccreditation.ISO 15189 MU Requirements SummaryClause 5.5.1.4 states that laboratories “shall determine measurement uncertainty for eachmeasurement procedure in the examination phase used to report measured quantity values.”It also states that “Upon request, the laboratory shall make its estimates of measurementuncertainty available to laboratory users.”CAP Guidance SummaryLaboratories in the CAP Laboratory Accreditation Program satisfy most of what is necessary tomeet the ISO 15189 clause regarding MU. They do so through the following ongoing routines: Quality Control (QC) Proficiency testing (PT) Calibration Multi-instrument comparison Method comparison Generation of data supporting the analytical measurement rangeas defined by the medical directorWe recommend that laboratories (1) ensure that they have access to the confidence levels fortheir tests, derived from QC and other analytical processes, and (2) be able to supply a procedurethat describes the quality routines that support the validity of the stated confidence levels. For anexample of such a procedure, see Appendix A.ExclusionThis guideline does not apply to point-of-care testing (POCT).CAP 15189December, 2015 2
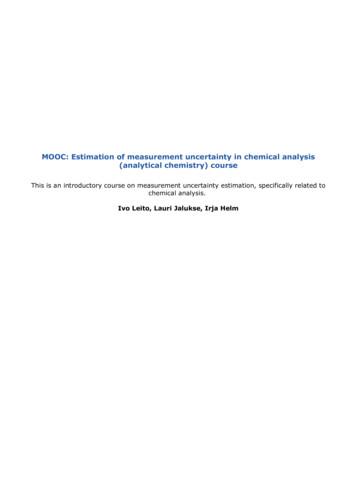
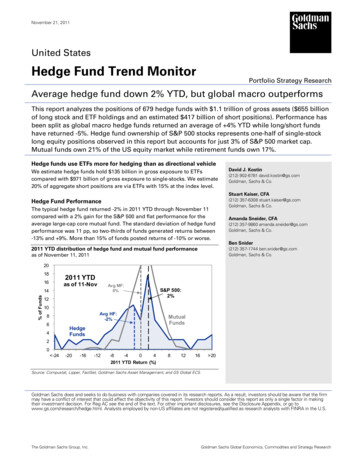
Measurment Uncertainty GuideKey DefinitionsTERMDEFINITIONMeasurement Uncertainty(MU)The degree to which one is certain of results for a particularmeasurement/testing process, expressed as a confidence level withina range.For example, how certain are you that a glucose result of 262 is really262? MU is expressed as 95% probability that the true result isbetween 258 and 266.Note: In the statement above, 95% is the confidence level; 258 and 266represent the confidence interval (CI).AccuracyThe closeness of agreement between a measured quantity value anda true quantity value of a measurand. (VIM 2.13) It is affected by bothtrueness and precision of the method.PrecisionVariation between individual measurements performed by replicatetesting of a sample. This reflects random error of the method and maybe estimated by standard deviation or coefficient of variation.TruenessCloseness of the average of replicate measurand values to its truequantity. This is typically estimated by repeat testing of a sample withan established measure and quantity. It is a reflection of systematicerror or bias of the method.Accuracy vs. Precision—Target Analogy Examples: Precise but not true(Questionable accuracy)Precise and true(Accurate)Imprecise and not true(Inaccurate)(continued on next page)CAP 15189December, 2015 3
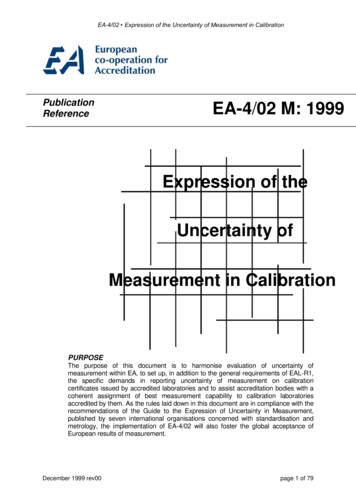
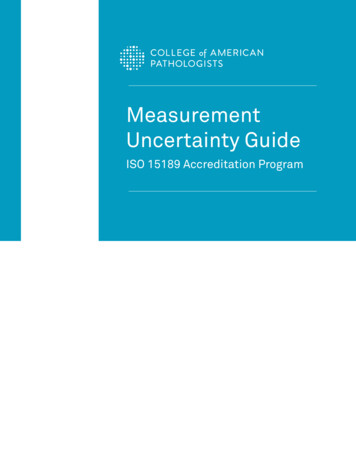
Measurment Uncertainty GuideKey Definitions (continued)ACCURACY VS. PRECISION—CONTROL CHART EXAMPLES:Precise but not true(Questionable accuracy)Precise and true(Accurate)Imprecise and not true(Inaccurate)MEAN AND CONTROL LIMITSUCLMEANUCL510152025DAYMU is a spot estimate of the error of a result based on known imprecisionwithin the range.MU vs. Analytical MeasurementRange (AMR)AMR is the total range of values that a method can measure withoutmodification of a sample, such as dilution or concentration.AMR is usually defined by a linearity experiment. It is the range of valuesover which there is a linear relationship between measured value andtruth (see Killeen et al., Arch Pathol Lab Med).CAP 15189December, 2015 4
Measurment Uncertainty GuideAssumptions1. Working Group 2 (WG2) of the ISO Technical Committee 212 (TC212) is developing a technicalspecification for MU in the medical laboratory. It is currently in the early stages and publicationis not expected in the immediate future. Once published, the CAP 15189 program will review thedocument and make appropriate changes based on its recommendations. As a technical specification, the TC212 WG2 document will not be a standard and will not represent anabsolute requirement; however, as the product of international experts, it will provide a guide to bestpractices for the assessment of MU. This current CAP15189 guideline is a first attempt at establishingexpectations for this program using several sources, including the preliminary draft of the TC212 WG2technical specification.2. Variability caused by pre-analytical processes often creates the largest source of uncertainty in theresult from a medical decision standpoint. For the purposes of assessment and accreditationdecision, clarify what you are incorporating into your MU when you provide it to a clinician and givean MU assessment most suited for the clinical situation. (For risk assessment, see the documentCAP 15189 Program—Risk Management Guideline for Laboratories. This can be found at cap.org/cap15189 under Additional Resources.)3. Proficiency testing itself is insufficient to assess the entire MU. Accuracy-based PT does providea higher-order (reference) target for its material, which can be used to assess bias/systematic error.This, though, is still at best an indication of the true bias of the method being evaluated. TC212 WG2 is considering how to deal with bias assessment, because for most measurands thetypical clinical laboratory has no way to really assess bias. Although bias is properly assessedagainst a sample with known quantity, calibration is intended to provide long-term stability for themeasurement method, and the CAP 15189 program will for the interim accept proper calibrationrecords as providing minimal bias in the assessment of MU.4. The short-term QC CV is inadequate for computing your MU. The laboratory will need sufficient QCdata (minimum 20 data points, ideally near 100) to gain representative data on lot changes,instrument maintenance, etc. However it is not necessary to keep changing the MU for eachmeasurand your laboratory reports. Note: The CAP supports the guidance offered by James Westgard: “While there is a ‘rule of thumb’that a minimum of 20 controlled measurements should be used to calculate an SD for setting controllimits; many more are needed to obtain a reliable estimate of the SD It would seem prudent to aimfor at least 100 measurements when estimating MU.” Westgard JO. Basic Quality ManagementSystems, Madison, WI: Westgard QC, Inc.; 2014, p. 231.5. When the ISO 15189 standard refers to “performance requirements,” it is referring toconfidence levels.6. Confidence levels should be approved by the laboratory medical director.CAP 15189December, 2015 5
Measurment Uncertainty GuideGuidelines1. For each of its quantitative tests, a laboratory must have MU values that it can provide if requested. Example: The MU for Serum Potassium is: At a level near 4.19 mmol/L, MU is /- 0.52 mmol/L; (95% CI 3.67 - 4.71 mmol/L)At a level near 4.69 mmol/L, MU is /- 0.61 mmol/L; (95% CI 4.08 - 5.3 mmol/L)At a level near 7.15 mmol/L, MU is /- 0.84 mmol/L; (95% CI 6.31 - 7.99 mmol/L)(For complete example, see Appendix B.)2. Your laboratory does not have to report out the MU with every result, but it must be able to supply itto any clinician who requests it. The laboratory must define and approve it. The laboratory must setperformance requirements for MU, expressed as a confidence level within a range.3. The laboratory should have a procedure that describes the quality routines that support the validityof the stated confidence levels (or “a process to determine its MU”).For an example, see Appendix A.CAP 15189December, 2015 6
Measurment Uncertainty GuideSuggestions/Best Practices1. MU is best calculated in response to clinician inquiry, because calibration error (systematic error)and imprecision (random error) vary over time. The laboratory may choose to assess MU for amethod as part of its method validation/verification workup or may choose to have a processavailable for calculating a current estimate of MU when required, within a reasonable time framethat allows a timely response to request this information. Though not required by the CAP 15189 program, a best practice would be to do both: make an initialestimate of MU during method validation/verification to assess the error that might be seen with themethod, and have a process to re-evaluate MU in response to a clinical inquiry.2. The practical estimation of MU comes down to calculating the SD from statistical quality controldata, then multiplying that SD by a factor of two to provide a conventional 95% confidence limitfor a test result. Typically done using Gaussian statistics, a coverage factor of 1.95 or 2 is often used to giveexpanded measurement uncertainty coverage of approximately 95% (roughly assuming that95% of the time the true value for the specimen in question would be in this range). Bias is ignored in this approach, as it assumes that the method calibration is traceable withminimal error to a “true” reference value. If the error in the calibrator(s) is known, include it inthe MU calculation; however, when using commercial calibrators, this often is not provided tothe laboratory and therefore cannot be determined or included in the MU calculation. The laboratory must ensure that the allowable calibration error is small relative to the randomerror calculated from statistical quality control data. For analyzer-based methods usingmultipoint calibration, the error for each calibrator is typically included in the calibration report.Single-point calibrations are usually assumed as having no calibration error.3. As stated in ISO 15189:2012 5.5.1.4, Note 3, examples of the practical utility of measurementuncertainty estimates might include the following: Confirmation that patients’ values meet quality goals set by the laboratory Meaningful comparison of a patient value with a previous value of the same type or with aclinical decision value4. MU is dependent on intermediate actions, for example: Calibration results PT results If calibration fails repeatedly, or you see numerous outliers in your PT, you should reevaluateyour MU calculation.5. If you either (1) detect an instrument out of calibration, or (2) fail PT for reasons other than clericalerror, this negates the MU assessment, because it calls into question whether you have a stablesystem.6. If, in the course of testing QC material, after 100 data points, your measurement falls outside the 2SD range, you should investigate the event. Check with testing personnel for anything unusual, suchas QC material that is old, or material that was not mixed well. Consider whether the impact was bigenough that it might affect MU. With measurements outside the 2 SD range, there is a highprobability that something changed with the population or measurement system.7. MU may be influenced by routine changes such as changes of reagent batches, different operators,new operators, or scheduled instrument maintenance. When you have such changes, you shouldconsider whether you need to recalculate your MU. If you change methodology for the test, you mustrecalculate your MU.CAP 15189December, 2015 7
Measurment Uncertainty GuideHow the CAP Will Assess MU1. Throughout the life of the analyzer, or other mechanical or manual test method, assessors will lookat the following in assessing MU: Calibration results PT results Testing data that supports analytical measurement range (AMR), or MU, as defined by the medicaldirector QC (mean, 2 SD; Is laboratory achieving its own range?) Multi-instrument comparison Method comparison2. The CAP will sample validation records. The CAP will determine the fit with results (number ofcorrected results).3. The CAP will ask how the laboratory came up with MU for a specific analyte. If the laboratorychooses to specify a process for calculating MU to be used when needed, rather than relying onprior estimations for all methods, examples should be available and the laboratory must be readyto perform an estimation during the assessment for any method when asked by the assessors.References1. Joint Committee for Guides in Metrology. JCGM 200:2012, International vocabulary of metrology—Basic and general concepts and associated terms (VIM) 3rd edition 2008 version with minorcorrections. JCGM website. Available at:http://www.bipm.org/en/publications/guides/ AccessedAugust 30, 2015.2. Westgard JO. Basic Quality Management Systems, Madison, WI: Westgard QC, Inc.; 2014.3. Anthony A. Killeen, Tom Long, Rhona Souers, Patricia Styer, Christina B. Ventura, and George G. Klee(2014) Verifying Performance Characteristics of Quantitative Analytical Systems: CalibrationVerification, Linearity, and Analytical Measurement Range. Archives of Pathology & LaboratoryMedicine: September 2014, Vol. 138, No. 9, pp. 1173-1181. Available at:http://dx.doi.org/10.5858/arpa.2013-0051-CP Accessed August 30, 2015.CAP 15189December, 2015 8
Measurment Uncertainty GuideAppendix A - Sample Procedure Supporting MUThe following procedure explains the activities and routines that support the validity of the reported confidence levels for a given test.Quality Activities Supporting Validity of Serum Potassium TestSTEPWHOWHATDETAIL1Testing PersonnelCalibrationPerformed every 2 weeks2Testing PersonnelQCPerformed daily per shift or every 8hours3All Testing PersonnelPTPerformed 2-3 times per year asrequired4Senior Testing PersonnelMulti-instrumentcomparisonPerformed every 6 months5Senior Testing PersonnelMethod comparisonPerformed every 6 months6SupervisorTraining of testingpersonnelProvided to testing personnel initiallywhen hired7SupervisorCompetency programCompetency verified using the CAPCompetency Assessment Programtwice during the first year and onceannually thereafter8Laboratory MedicalDirectorIQCP for testPerformed once per year or morefrequently if warranted by testcircumstances or volumeCAP 15189December,October, 2015 9
Measurment Uncertainty GuideAppendix B–Example of MU Documentation ee the following pages for an example of statistical records and values that would meet the standard forSMeasurement Uncertainty. Note that there is no requirement to set up your MU calculations in this way.Measurement Uncertainty ExampleMeasurement Uncertainty ReviewVersion 1.1 (Month, Day, Year)1. Define the measurand: Serum Potassium.AssayAtomic AbsorptionSpecimen:SerumAnalyzer 1:Agilent GC-FIDUnits:mmol/LAnalyzer 2:# decimals:2Analyzer 3:PerformanceGoal:Coefficient of variation(or relative uncertainty)is less than 15%Analyzer 4:2. Calculate the weighted mean for each level QC across all instruments and QC lots.3. Calculate the weighted SD for each level QC across all instruments and QC lots.LEVEL 1 QCAnalyzer 1Analyzer .16August-12204.490.16NMeanAnalyzer 3SDAnalyzer 4NMeanSDNMeanSDPeriod 7Period 8WeightedStatsPer AnalyzerWeighted 000NMeanSDAll Analyzers1054.690.31CAP 15189December, 2015 10
Measurment Uncertainty GuideLEVEL 2 QCAnalyzer 1Analyzer 12August-122040.14NMeanAnalyzer 3SDNMeanAnalyzer 4SDNMeanSDPeriod 7Period 8WeightedStatsPer AnalyzerWeightedStatsAll 00000000NMeanSD1074.190.262LEVEL 3 QCAnalyzer 1Analyzer 2Month/YearNMeanSDMarch-12267.560.72Analyzer 3Analyzer 0000000NMeanSD1077.150.424Period 7Period 8WeightedStatsPer AnalyzerWeightedStatsAll AnalyzersCAP 15189December, 2015 11
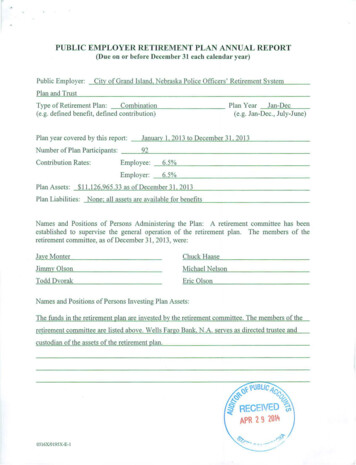
Measurment Uncertainty Guide4. Calculate the combined uncertainty (Uc) of the weighted SD and calibrator if available (or treatas zero)5. Determine the expanded uncertainty (U) at a 95%coverage factor (k 1.96)1Weighted SDU calibratorCombined Uk-valueExpanded UQC Level 10.31QC Level 20.26200.311.960.6100.2621.960.52QC Level 30.42400.4241.960.84Note 1–The 1.96 k-value is used to create an even 95% confidence interval, since two full standarddeviations actually correspond to 95.4 of all measured results.6. Determine the relative uncertainty by dividing the combined uncertainty by the weighted mean.QC Level 1Weighted MeanCombined URelative U(Coefficientof Variation)CommentMeets goal?4.690.316.6%Method meets acceptable performance if relative CV is lessthan specified goalYESQC Level 24.190.2626.3%YESQC Level 37.150.4245.9%YESInterpretation of Measurement UncertaintyThe result will be /- the Expanded Uncertainty with 95% confidence (i.e., correct 19/20 times)The MU for AA (serum) is:At a level near 4.19 mmol/L, MU is /- 0.52 mmol/L; (95% CI 3.67 - 4.71 mmol/L)At a level near 4.69 mmol/L, MU is /- 0.61 mmol/L; (95% CI 4.08 - 5.3 mmol/L)At a level near 7.15 mmol/L, MU is /- 0.84 mmol/L (95% CI 6.31 - 7.99 mmol/L)See graph on next page.CAP 15189December, 2015 12
Measurment Uncertainty GuideTrue MEAN Values4.194.194.694.697.157.15Lower Limits of 95% Confidence4.193.674.694.087.156.31Upper Limits of 95% Confidence 4.69 Upper 4.69 Lower 4.69 Upper 4.69 LowerCAP , 2015 13
Measurment Uncertainty GuideNote: For a copy of the Excel spreadsheet (MU Calculation Tool.xlsx) used for the calculation on theprevious page, go to cap.org, search for the CAP 15189 website, and look under Additional Resources.Or send a request marked MU Calculation Tool to cap15189@cap.org.Sign-off and ReviewDate enteredby:Reviewed by:Clinician nameDate:Date:CAP 15189 2014 College of American Pathologists. All rights reserved.24114.1015Month, Day, YearInitials:Initials:December, 2015 14
The ISO 15189:2012 standard contains enhanced expectations regarding measurement uncertainty (MU) in clause 5.5.1.4. To clarify the laboratory's responsibility and the CAP's 15189 assessment standards, we have developed this interpretive document for the purposes of accreditation. ISO 15189 MU Requirements Summary