Transcription
K-12 Public School Finance in Missouri:An OverviewMichael Podgursky and Matthew G. SpringerThe level and distribution of spending for public K-12 education remains a contentious matter ofpolicy in many states because of increasing expectations for school performance and widespreadschool finance litigation. In this paper, the authors examine the policies that have generated schoolfunding in Missouri and the outcomes of these policies in terms of the overall level of schoolspending and interdistrict spending gaps. Interdistrict inequality in average spending is higher inMissouri than in surrounding states, but the spending gaps are equalizing in the sense that poorchildren tend to be concentrated in districts with above-average spending. A new school fundingformula is grounded on a purported link between spending and student achievement. Since thatassociation is tenuous statistically, challenges are likely to arise as this new scheme is fullyimplemented.Federal Reserve Bank of St. Louis Regional Economic Development, 2006, 2(1), pp. 31-50.The level and structure of public elementary and secondary education fundingis a contentious public policy matterin Missouri and many other states.Although state revenues and spending grew brisklyduring the latter 1990s, the 2001 recession produced large deficits and sharp declines in taxrevenues in most states. Fiscal recovery has beenslow, and growing spending demands in the areasof public safety, social services, and educationcoupled with rapid growth in Medicaid expenseshave resulted in considerable fiscal stress for states(Kane, Orszag, and Gunter, 2003). Voters also havebeen reluctant to raise tax rates. In Missouri, voterdiscontent led to the passage of a constitutionalamendment in 1980 known as the HancockAmendment, which limits the growth of staterevenues to the growth rate of state per capitapersonal income (Hembree, 2004).Two generations of school finance litigationhave further complicated fiscal matters. Beginningwith the 1971 Serrano v. Priest decision inCalifornia, school finance systems based primarilyon local property taxes have been found to violatestate constitutions. Interdistrict per-student spending disparities in many states were substantial. InTexas, for example, given identical property taxrates, high-wealth districts were capable of spendingover 20 times more per student than low-wealthdistricts (Edgewood Independent School District v.Kirby, 1989). These legal challenges, termed “equity”cases, have been successfully argued in 12 states.Research suggests that they have had the effect ofnarrowing spending inequality (Murray, Evans, andSchwab, 1998).Missouri’s school finance system was challenged on equity grounds and found unconstitutional in 1993. The legislature responded by writinginto law the School Improvement Act of 1993,which called for an extensive overhaul of the schoolfunding mechanism by means of an increase inelementary and secondary education spendingand decoupling of local tax collections from localMichael Podgursky is a professor of economics at the University of Missouri–Columbia, and Matthew G. Springer is assistant director for policyresearch at the Peabody Center for Education Policy, Vanderbilt University. The authors thank Mark Ehlert and Gerri Ogle for assistance with thestate finance and assessment data, Art Peng for research assistance, and Michael Wolkoff for helpful comments. 2006, The Federal Reserve Bank of St. Louis. Articles may be reprinted, reproduced, published, distributed, displayed, and transmitted intheir entirety if copyright notice, author name(s), and full citation are included. Abstracts, synopses, and other derivative works may be madeonly with prior written permission of the Federal Reserve Bank of St. Louis.F E D E R A L R E S E R V E B A N K O F S T. LO U I S R E G I O N A L E C O N O M I C D E V E LO P M E N TV O LU M E 2 , N U M B E R 1200631
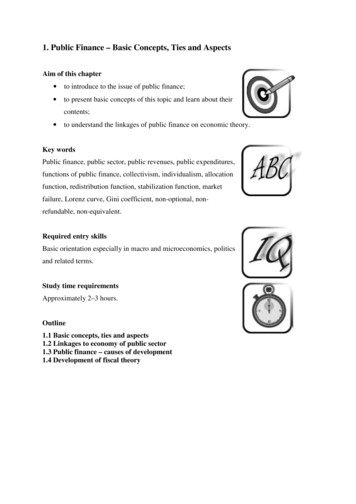
Podgursky and SpringerFigure 1Number of Public School Districts by State, 400KS ARKY200TNHawaii1HawN aiieD vadelaM awRh ar areod ylae ndIslandW Utyo ahminWes Ala gt V skirg aLo inui iasiN Fl anaew oridSoMutah exiCa coroNlinorth Ida aCa horoAl linab aaV maTe irginn niaM esisCo ssis eenn sipec pitSo Ke icuut ntu th ckD yNaew C kooH lor taam adps ohG ireeoN O r gior re ath goD nakoM taVe ainrm eoW Ind ntas iahi nangtK onAr ansk a asM A nsaas ri ssa zoch nus aettM Io sin wne aW sisc oton aPe Mo sinnn ntasy nalvM ani iO sso akl urah iM omic ahN ig aeN bra new skJe arseyONew hioYoIl rkCa linolif isornTe iaxas0SOURCE: U.S. Department of Education, Digest of Education Statistics, 2003, Table 87.wealth. In theory, districts with identical propertytax rates would raise identical revenues. However,the sharp decline in state revenues as a result ofthe 2001 recession combined with high rates ofhousing price inflation in some parts of the statemade the system unviable.A second generation of school finance lawsuits,known as “adequacy” or “equity II” (Ladd andHansen, 1999), emerged following Kentucky’sRose v. Council for Better Education (1989). In thesecases, courts have shifted their focus to includeexamination of what dollars buy, including highquality teachers, class sizes, textbooks, curriculummaterials, facilities, technology, and whether theseinputs are adequate to meet constitutional standardsfor education. An adequacy lawsuit was filed in32V O LU M E 2 , N U M B E R 120062004 in Missouri and once again set the state legislature on course to throw out the old finance systemin favor of a very different alternative. A new “adequacy based” finance system, approved in 2005,aims to make available to all students a level ofresources sufficient to reach a level of proficiencydefined by state standards.This paper provides a descriptive overview ofthe Missouri school finance system. The first sectionprovides an overview of the system of school districts in Missouri and some contextual background.The following section gives a rudimentary explanation of the “old” finance regime in Missouri from1993 to the present, but which is now being phasedout. We then examine data on the fiscal outcomesof that system and how Missouri’s per-studentF E D E R A L R E S E R V E B A N K O F S T. LO U I S R E G I O N A L E C O N O M I C D E V E LO P M E N T
Podgursky and Springerspending compares with neighboring states. Wethen discuss the new regime, which attempts todetermine “adequate” spending levels based onstudent achievement. Our conclusion briefly summarizes our findings and suggests potential bumpsin the school finance road ahead.Table 1Enrollment by District Size: 2004-05Percentageof studentsCumulativepercentageof students100.50.5INSTITUTIONAL BACKGROUND201.01.5301.53.0Before considering the distributional effects ofthis regime, it is important to consider some institutional features of the school finance landscape.First, relatively speaking, Missouri has many schooldistricts. Missouri has 522 regular school districts(75 K-8 and 447 K-12).1 Figure 1 shows that, amongthe states, there is a wide distribution in the numberof school districts in operation, ranging from 1statewide district in Hawaii to 1,040 in Texas.Missouri is at the high end of the range, and mostof the eight states exceeding Missouri have significantly larger populations. In many of our comparisons, we will focus on surrounding Midwesternstates. Most of these states, like Missouri, have alarge number of school districts, many of whichare rural.Second, Missouri has a highly skewed distribution of students among these districts: Some havevery few students and some have many. Table 1reports the distribution of students by decile ofdistrict size, from lowest to highest. The smallest10 percent of Missouri districts enroll just 0.5 percent of all students. The smallest 20 percent ofdistricts (i.e., 104 of 524) enroll just 1.5 percent ofpublic school students. By contrast, the largest 10percent enroll over half (57 percent) of the students.In fact, the largest ten school districts enroll justover 25 percent of the students, and the five largestenroll 16 percent. Imagine a parade of school districts marching down the street with each district’sheight proportional to its size: one-quarter inch ofheight per student in the district. The first hundredmarchers would average only two and a half feettall. The next hundred would be about four and ahalf feet tall and so on, until we reach the last 5.843.010057.0100.01Officially, Missouri has 524 school districts. However, for this studywe drop two: the St. Louis and Pemiscot County Special SchoolDistricts.Decile bydistrict sizeLargest 5 districts16.0—Largest 10 districts25.8—SOURCE: Missouri Department of Elementary and SecondaryEducation.marchers in the parade, who would tower nearly600 feet into the sky.Finally, the analysis in this paper will focus onthe distribution of resources among these schooldistricts. However, we should keep in mind thatour ultimate concern is the distribution of schoolresources among children, not school districts.Unfortunately discussions of school finance andequity tend to conflate the two. However, it shouldbe noted that there are likely significant intradistrictinequalities in many school districts—particularlyin the larger urban districts.2 One source of inequality arises from the use of salary schedules forteachers that set base pay entirely on the basis ofyears of seniority and graduate credits or degrees.Teacher seniority often varies considerably betweenschools. For example, because schools with students with higher socioeconomic status are generally considered more desirable places to work byteachers, more senior teachers (who are paid more)tend to transfer to more advantaged schools. On2Recent research conducted by Roza and Hill (2004) illustrates substantial disparities between school spending in several urban districts.F E D E R A L R E S E R V E B A N K O F S T. LO U I S R E G I O N A L E C O N O M I C D E V E LO P M E N TV O LU M E 2 , N U M B E R 1200633
Podgursky and SpringerFigure 2Average Teacher Salary Per Student and Student Poverty Rate in Elementary Schools, 2004-05,in Three Missouri School DistrictsA. St. Louis, MOTeacher Salary/Student 5,500 5,000 4,500 4,000 3,500 3,000 2,500 2,0006070657580859590100Free/Reduced Lunch %B. Kansas City, MOTeacher Salary/Student 7,000 6,500 6,000 5,500 5,000 4,500 4,000 3,5003,000 2,500 2,00050556065707580859095100Free/Reduced Lunch %SOURCE: Missouri Department of Elementary and Secondary Education.34V O LU M E 2 , N U M B E R 12006F E D E R A L R E S E R V E B A N K O F S T. LO U I S R E G I O N A L E C O N O M I C D E V E LO P M E N T
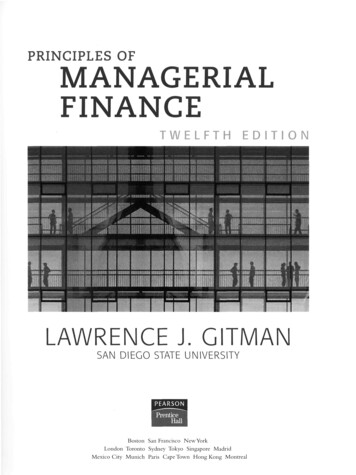
Podgursky and SpringerFigure 2, cont’dAverage Teacher Salary Per Student and Student Poverty Rate in Elementary Schools, 2004-05,in Three Missouri School DistrictsC. Columbia, MOTeacher Salary/Student 4,500 4,000 3,500 3,000 2,500 2,0000102030405060708090Free/Reduced Lunch %SOURCE: Missouri Department of Elementary and Secondary Education.the other hand, schools with high levels of povertymay receive additional compensatory resourcesfrom the district.Figure 2 presents some illustrative data on thispoint for three urban districts in the state (St. Louis,Kansas City, and Columbia). We cannot computetotal spending per student in the state; however,we can examine the allocation of teacher payrollby school. In Figure 2 we present average teacherpayroll per student in regular elementary schoolswithin the three school districts. Variation acrossschools in this measure would arise from twosources—variation in average pay per teacher andvariation in students per teacher. First we note thatthere is considerable variation between schools inall three districts with nearly all schools roughlyfalling in a 2000 band. The three school districtsdiffer significantly in the relationship betweenspending and school poverty. In the Columbiapublic schools the relationship is strongly compensatory. In the Kansas City elementary schoolsthe dispersion is somewhat disequalizing, and inSt. Louis it is neutral.3Unfortunately, aside from teacher and somestaff pay, data are lacking on intradistrict patterns ofschool spending. Thus we will focus on per-studentspending at the district level, although it is important to keep these intradistrict issues in mind.THE OLD REGIME: 1995-2005From 1995 until the 2005 legislative session,Missouri operated under a formula based on theprinciple that identical tax effort should yieldroughly similar tax revenues. These types of for3The St. Louis and Kansas City data exclude charter elementaryschools.F E D E R A L R E S E R V E B A N K O F S T. LO U I S R E G I O N A L E C O N O M I C D E V E LO P M E N TV O LU M E 2 , N U M B E R 1200635
Podgursky and SpringerTable 2Missouri Aid for School Districts, Fiscal Year2005Basic formula .1Special education/remedial reading1616.1Vocational education532.0Career ladder391.5Early childhood301.1GiftedTotal250.92,652100.0SOURCE: Missouri Department of Elementary and SecondaryEducation.mulas are sometimes referred to as “power equalization” (Hoxby, 2004). This operational structureemerged after Missouri courts in Committee forEducational Equality v. State of Missouri (1993)found the prior system unconstitutional and provided districts with a guaranteed tax base. In principle, districts exerting identical taxing effort intheir respective property tax rates would be guaranteed equal resources, with state revenues acting tooffset disparities in district wealth. School districtswere provided foundation aid roughly as follows:Foundation aid (EP T GTB) – local tax revenues,where EP is the number of eligible students, T is thelocal school tax rate levy, and GTB is the guaranteedtax base. Senate Bill 180, passed in 1995 in responseto school finance litigation, set the guaranteed taxbase by the district-assessed valuation of the schooldistrict at the 95th percentile of school districtwealth. In other words, the formula intended todecouple tax effort from district wealth. A poorschool district would be guaranteed as much taxrevenue as a rich school district with the same taxrate.44There was also a supplemental payment to school districts (“at risk”)that provided revenues to school districts based on the number ofstudents eligible for free or reduced price lunches; this programassigns a weight of 1.2 or 1.3 for these students.36V O LU M E 2 , N U M B E R 12006Such a formula maintained local control of thesetting of property tax rates; however, it also encouraged school districts with below-average levels ofdistrict wealth to raise their local tax rates.5 A district with half the local wealth per student of the95th percentile would get one dollar in state aidfor every dollar raised locally. A poor district withone-fifth the property wealth would get four dollarsfor every local dollar. Districts above the 95th percentile of wealth per student would receive no statefoundation aid, but none of their local tax revenueswould be confiscated either. Unlike some otherstates, Missouri has no “Robin Hood” provisionsfor redistribution of local tax revenues (Hoxby andKuzienko, 2004).No school finance system ever proves thissimple, however. We have omitted a variety ofdetails. The most important omission for our purposes was Senate Bill 180’s “hold harmless” provision. To secure sufficient political support forpassage of Senate Bill 180, school districts thatwere going to lose state aid had their aid frozen at1992-93 levels. These districts, termed “hold harmless,” were primarily wealthier school districts.Thus, the bill’s equalizing effect was somewhatmuted because of the existence, in any year, of 55or so “hold harmless” districts.The foundation formula was not the only wayin which state aid was allocated to school districts.The state of Missouri also provided “categoricalaid”—aid that can be used only for specified purposes—to school districts. The largest categoricalaid programs in Missouri included the following: transportation special education and remedial reading career ladder program (i.e., bonus pay forteachers) vocational educationTable 2 shows a breakdown of state aid for fiscal5This formula applied to school districts that set their tax rates at 2.75 per 100 of assessed valuation. This was intended to be a flooron the local rates. The small number of districts that set their ratesbelow this rate were not cut off from state aid but were given aidthrough a less-generous formula. Foundation matching aid wascapped at a tax rate of 3.85. Finally, by statute, residential propertyis assessed at 19 percent, commercial at 32 percent, and farmland at12 percent of market value.F E D E R A L R E S E R V E B A N K O F S T. LO U I S R E G I O N A L E C O N O M I C D E V E LO P M E N T
Podgursky and SpringerFigure 3Current Expenditure Per Student in Missouri and Other States, 2000-01US 100180160140MIssouri90.2rank 3112010080ILKSAR TNIANEOK KY604020Miss Utaiss hAr ippiAr izonkTe an asnn aes ssId eeaN hoevAl adO aba akl ma aLo homui aN Ke sianor n ath tucD kyakSoout Flo tahN D rideN w ak aor M otth e aCa xicro olinaCo Texlo asSoraut H doh awCa aro iiM linis aM souW on r ias tahi nangtKa onG nsaeo srgiaCa Iolif waN orneb iaNrewV asH irg kaam inps iaW O hires re et V goirg niniO aIn hiodianM Illin ain on isW esoPe yo tann msy inglvanW Ma iaisc ineoM nsar inM ylanic dD higel aa nVe warrm eRh A ontM ode laskas I asa slacnCo h dnn usee ttDN c t ic sisteric N w utt o ew Yorf C Je kol rseum ybia0SOURCE: U.S. Department of Education, Digest of Education Statistics, 2003.year 2005. The first two lines are the basic foundation formula. They show that roughly 82 percent ofstate aid to K-12 education was driven by the localtax formula and that 18 percent was distributedthrough categorical grants.Finally, a substantial share of statewide aid ishidden in “local spending.” In 1982, voters passeda statewide sales tax of 1 percent (Proposition C),the proceeds of which were earmarked for elementary and secondary education. However, these revenues were provided directly to school districtson a per-student basis and counted as local ratherthan state revenue. In theory, half of Proposition Crevenues were to be used to reduce property taxpayments. However, districts could waive someor all of this “rollback” by a majority vote and 471school districts chose to do that. In fiscal year2005, the revenues from Proposition C allocatedto schools amounted to approximately 700 million,or roughly 25 percent of formal state revenuesprovided to schools.PER-STUDENT EXPENDITURES INMISSOURI AND OTHER STATESWe begin by examining overall funding for K-12public education in Missouri. How does Missourispending compare to the national average? Unfortunately, there is a rather long lag in reporting ofstate education spending by the National CenterF E D E R A L R E S E R V E B A N K O F S T. LO U I S R E G I O N A L E C O N O M I C D E V E LO P M E N TV O LU M E 2 , N U M B E R 1200637
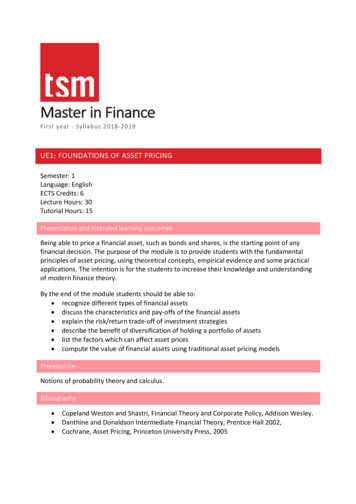
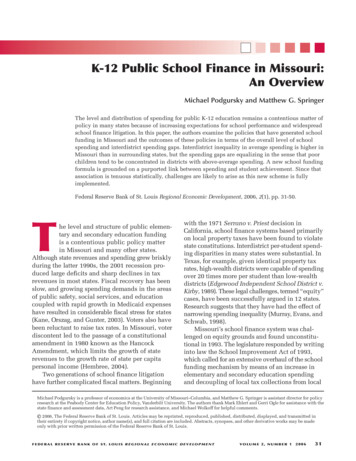
Podgursky and SpringerFigure 4State Relative Spending Per Student, 1979-80 and 2000-01 (U.S. 100.0)Relative Spending/Student 2000-01170100MO60100Relative Spending/Student 1979-8060170SOURCE: U.S. Department of Education, Digest of Education Statistics, 2003. Alaska is not plotted.for Education Statistics, the data-gathering arm ofthe U.S. Department of Education. The most recentdata available are for the 2000-01 school year(National Center for Education Statistics, 2002).In that year, Missouri ranked 30th of 50 statesplus the District of Columbia. Missouri spendingper student was 90.2 percent of the U.S. average(Figure 3). That percentage has been fairly stableover time. Figure 4 reports state spending as a percentage of the U.S. average by state for two schoolyears: 1979-80 and 2000-01. We have included a45-degree line in the chart. States above the linehave moved up relative to the U.S. average overthat period, and states below the line have moveddown. Missouri is slightly above the line; however,Missouri’s spending in both years was close to 90percent of the national average.At first glance, these figures suggest thatMissouri underfunds elementary and secondaryeducation, at least compared with the nationalaverage. However, it is well-known that living costsvary from state to state. Although it is true that38V O LU M E 2 , N U M B E R 12006spending per student is lower in Missouri than,say, California, so too are many other costs, suchas housing and gasoline. Unfortunately, federalstatistical agencies do not compute a cross-sectioncost of living index because the practical and conceptual problems with constructing such an indexare daunting. The national cost of living index(consumer price index, CPI) is designed to measurechanges in prices over time (i.e., inflation). Eachmonth, the Bureau of Labor Statistics prices outthe change in the cost of purchasing a fixed bundle of goods and services on a typical urban wageby a clerical worker’s family. If the CPI rises by 0.2percent, we conclude that it would take 0.2 percentmore money to buy the same bundle of goods.Thus, to compensate a typical family for inflationwould require 0.2 percent more income. As longas a family’s consumption spending patterns donot differ too radically from this average bundle,then this index would provide a rough approximation of a pay increase necessary to offset thisprice increase.F E D E R A L R E S E R V E B A N K O F S T. LO U I S R E G I O N A L E C O N O M I C D E V E LO P M E N T
Podgursky and SpringerFigure 5Current Expenditure Per Student Relative to Average Housing Prices in Missouri and Other States,2000-01US 100180160Missouri120.1rank 16140NEKSIAOKAR120100KYILTN80604020HawaiCa U ilif tahCo ornW lo iaas rahi dongN tonevAr adaiM O zonas r asa egch ous nNewetH Id tsam ahps oM hN ar ireew ylM andexiIll coinVi oisrNgor F inith lo aC rCo ar idann olineTe cti ann cue tG sseM eo ein rgine asoN Ala taew skJ aM erseo yD nt ael naSo A awaut lab rehaRh Ca maod role inaKe Islan ndLo tucui kyM sianic aN hige aM wY niss oiss rkippW O iisc hioonDMsistiss inrict o Ar ourf C kan iSo o saut lum shD biaakotTe aIn xasdW iayo naN mieb ngrN Ve askor rm ath oD ntakKa otansM asainPenn Io esy walO vakW la nies ho atV mirg ainia0SOURCE: U.S. Department of Education, Digest of Education Statistics, 2003.A cross-section index is another matter altogether. It is meant to measure, for example, thedifferences in costs for a family in Worchester,Massachusetts, to maintain the same standard ofliving in St. Louis, Missouri. Simply stating theintent illustrates the conceptual problems of measurement. First of all, the bundles of good consumedby an average family may be very different in different locales. Where housing is very expensive,people may live in smaller houses and spend theirmoney on a boat. Winter is much colder on averagein Worchester than in St. Louis; hence, a typicalWorchester household likely spends more on heating oil. Of course, people who like the ocean andsnow are much more likely to live in Worchester.There is no easy way to account for these individualpreferences in a cross-section index.Figures 5 and 6 provide two illustrative waysto deflate school spending. Figure 5 deflates schoolspending by a measure of housing values fromCensus 2000. With this deflator, Missouri’s relativespending and rank rise sharply. Compared with theaverage price of a house, Missouri school spendingis 20 percent above the national average, and thestate ranks 16th in the nation. However, such anindex almost certainly overadjusts Missouri’sspending for two reasons. First, the index accountsfor less than half of consumer spending, and thereF E D E R A L R E S E R V E B A N K O F S T. LO U I S R E G I O N A L E C O N O M I C D E V E LO P M E N TV O LU M E 2 , N U M B E R 1200639
Podgursky and SpringerFigure 6Current Expenditure Per Student Relative to Young College Graduates’ Earnings in Missouri andOther States, 2000-01US 100180160140Missouri93.5rank 30120IN IAKS10080TNARILKYOK604020UAr tahizoN naeCa valif daTe ornn nies aseTe eFl xasoAl ridM aba aiss miss aG ippN A eor ior rk gith an aCW ar sasas olihi nangtI onCo llinlo oisLo radui osiVi anarKe ginnt iaNewucH Id kyam ahpO sh okl ira eSo M homut is ah soN Ca urew ro iM linM ex ain icn oM esoar t aylaKa ndnsasM Ohic iohigH anD awel aiaw iIn aredianCoanM n Iowas ec astaSo c icuhut u th sPe D ettsaN nns kotor yl ath vaD niaaO kotr aN egoew nN YoeN br rkW ew askes J e at V rseW irgi yisc niaonAl sinaR h M sk aDod aiste inericIst o Mo lanf C nt dol anu aW mbyo iamVe inrm gont0SOURCE: Spending per student: U.S. Department of Education, Digest of Education Statistics, 2003; doctor and dentist annual incomes,2000 Census of Households, 5 percent public use microdata sample (PUMS) computed by author.is no reason to believe that the prices of other consumer goods and services follow those of housing.Second, housing prices reflect the value of amenitiessuch as sunshine, scenic views, etc. Houses costmore in California than in Iowa because most people prefer California weather and amenities (e.g.,beaches and mountains). If a scientific studyshowed that living next to cornfields doubled lifeexpectancy, then you could be sure that housingprices would skyrocket in Iowa and much ofMissouri.Figure 6 takes a different approach. Here wedeflate school spending by an index of the earningsof young people (aged 25 to 35) who have a college40V O LU M E 2 , N U M B E R 12006degree or higher. Young people are very mobilegeographically. Thus, if real earnings, taking intoaccount living costs and amenities, are higher inCalifornia than Idaho, we would expect young people to migrate from the latter to the former. Thismigration would tend to raise the earnings in Idahoand reduce them in California. The relative payadjustment would continue until net migrationhalted, at which point any remaining pay gap wouldreflect the “value” of living in California relativeto Idaho. It is interesting to note that there is onlya modest effect on Missouri’s position when wedeflate Missouri education spending by collegegraduate earnings. Indeed, instructional spendingF E D E R A L R E S E R V E B A N K O F S T. LO U I S R E G I O N A L E C O N O M I C D E V E LO P M E N T
Podgursky and SpringerFigure 7Measured Inequality in Current Spending Per Student in Missouri and Surrounding States,1972-2002ln(95/05)0.90.80.7AR (312)0.6IL (893)IA (371)0.5KS (304)0.4NB (555)MO (522)OK (543)0.3TN (138)KY (176)0.20.101972197719821987199219972002NOTE: Inequality measure: (ln(95th//5th percentiles)). Number of regular school districts (2002) are in parentheses in the legend.SOURCE: U.S. Census Bureau, Elementary and Secondary School System Finance Data Files (F-33).is 93 percent of the U.S. average, and Missouri’srank rises just one position, from 31st to 30th.We conclude from this exercise that Missouri’s“real” spending for K-12 education may be somewhat closer to the national average than Figure 2suggests, but it is probably not above the nationalrate.VARIATION IN SCHOOL SPENDINGBETWEEN DISTRICTSOne concern in school finance is equity or“fairness.” However, there are different notions ofwhat constitutes fairness in school spending. Manyresearchers in the field distinguish “horizontal”and “vertical” equity (e.g., Berne and Stiefel, 1983).If real spending per student were identical for allstudents in the state, regardless of family back-ground, location, or need, that would constituteperfect horizontal equity. Vertical equity, on theother hand, takes account of need and seeks toequalize educational opportunity or outcomesgiven gaps in family incomes. If more spendingper student is required to equalize educationalopportunity for children from poor families, thenthe ideal distribution of spending from this pointof view would not be equal but compensating.Horizontal equity is the easiest to measure.The measure we will use is the ratio of the naturallogarithm of spending per student at the 95th and5th percentiles, a measure commonly used instudies of horizontal equity (e.g., Murray, Evans,and Schwab, 1998; Hussar and Sonnenberg, 2000).This measure has two desirable properties. First,with so many small districts in Missouri, theimpact of extreme outliers is attenuated. Second,the approach allows us to decompose trends inF E D E R A L R E S E R V E B A N K O F S T. LO U I S R E G I O N A L E C O N O M I C D E V E LO P M E N TV O LU M E 2 , N U M B E R 1200641
Podgursky and SpringerFigure 8Correlation Between Current Spending Per Student and Student Poverty in Missouri andSurrounding States, 1990-20000.80.70.6AR (312)IL (893)IA (371)KS (304)MO (522)NB (555)OK (543)TN (138)KY 997199819992000–0.1NOTE: Inequality measure: (ln(95th//5th percentiles)). Number of regular school districts (2002) are in parentheses in the legend.SOURCE: National Center for Education Statistics, Longitudinal School District Fiscal-Nonfiscal Data File.inequality above and below the median of the distribution of spending.6Figures 7 shows inequality trends in resourcedistribution from 1972-2002 for Missouri and surrounding states. During the 1972-92 period, Missouriclearly diverged from the trend in these states.While there was a general upward drift in inequalityin the surrounding states, the increase was muchmore pronounced in Missouri. The leveling effectof the 1995 School Improvement Act is also visible.Nonetheless, by the end of the period, spendinginequality was still significantly higher in Missouri.Figure 8 presents data on “vertical equity” inschool spending in Missouri and its neighbors.Here we plot the correlation between average spending per student and student poverty (i.e., the percentof students eligible for free or reduced-price6All of our measures of i
Missouri has 522 regular school districts (75 K-8 and 447 K-12). 1 Figure 1 shows that, among the states, there is a wide distribution in the number of school districts in operation, ranging from 1 statewide district in Hawaii to 1,040 in Texas. Missouri is at the high end of the range, and most of the eight states exceeding Missouri have signifi-