Transcription
Basin Methane Reconciliation StudyResearch Leadership:Daniel Zimmerle, Gabrielle Pétron, Garvin Heath, Russ Schnell and Dag Nummedal
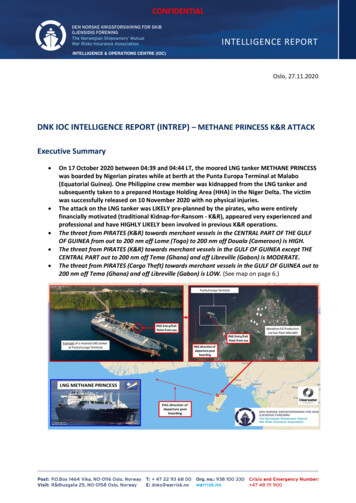
Temporal Variability Largely Explains Difference inTop-down and Bottom-up Estimates of Methane Emissionsfrom a Natural Gas Production RegionProceedings of the National Academy of /Timothy L. Vaughn , Clay S. Bell, Cody K. Pickering, Stefan Schwietzke, GarvinA. Heath, Gabrielle Pétron, Daniel Zimmerle, Russell C. Schnell, Dag Nummedal2
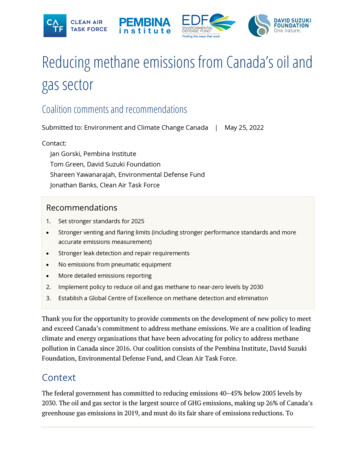
Emissions magnitude [g CH4/year]Past methane emission estimates differTop-down Bottom-up( 1.5x on average)1.5Ratio (measured/EPA GHG Inventory) [unitless]3Brandt, A. R. et al. Methane Leaks from North AmericanNatural Gas Systems. Science 343, 733–735 (2014),DOI: 10.1126/science.1247045
What has been compared in past studyFacility emission studyFacility emission studyStudy PeriodEpisodic Event lity emission studyStudy BasinTimeComponentemissionstudyFacility emission study
What was compared in this studyComponentemissionstudyLocationFacility emission studyComponentemissionstudyFacility emission studyStudy PeriodEpisodicComponentEventInventory Study BasinCountBasinemissionstudyTimeFacility emission study5ComponentemissionstudyFacility emission study
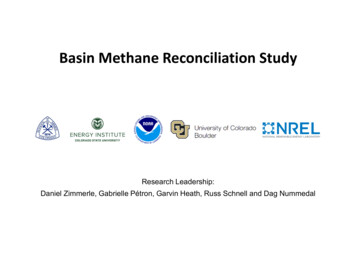
Study overviewStudy Design: Select relatively isolated basin with good partner representation Measure most gas infrastructure in the basin during sameperiod as aircraft flights Multiple measurement approaches at facilities to understandtrue emissions Basin-specific, high-resolution activity data, facility & componentcounts, and episodic emission timing and locationStudy Luck: Steady wind (north-to-south) for aircraft measurements6
Study basin locationMajority of operations includedin studyProduction Facilities Site access: 82% Site data: 99%Fayetteville shale playStudy basinGathering Facilities Site access: 74% Site data: 100%Transmission Facilities Site access/data 73%Distribution Entire network in region“Simple” operations Dry gas No storage No processing plants7
Compare methane emission estimates at basin-scale:Top-down box model vs. spatiotemporal bottom-up modelTop-downBottom-upZimmerle, Daniel et al., “Reconciling Top-down and Bottom-up Methane Emission Estimates from Onshore Oil and GasDevelopment in Multiple Basins: Report on Fayetteville Shale Study” (Colorado School of Mines, Golden, CO, 2016).8
The Bottom-Up Estimate:Measurements & Sub-models
Inputs to bottom-up modelActivity Data:Emission Factors: Production Facilities Production Facilities Unloading events Gathering Facilities Engine Operations Transmission Facilities Gathering Pipelines Distribution Livestock Geologic Seeps Wetlands Landfills Rice Cultivation 261 On-site 50 OTM33A 17 Tracer Gathering Facilities 33 On-site 30 Tracer 11 Aircraft Transmission Facilities 4 Tracer Gathering Pipelines 96 km Distribution Entire Leak list Non O&G from LiteratureNote: No gas processing plants, gas storage facilities, or major chemical plants in the study area10
Quantifying BU emissionsDirect componentmeasurementsTracer fluxOTM33APaired In Various Combinations11Aircraft facilityestimates
Bottom-Up Field Campaign & Analysis Acquired extensive activity data for all of the natural gasinfrastructure in study area: Activity data from 98% of natural gas facilities in study areaProduction and gathering operations were the largest sourcesSmall contribution from transmission compressor stationsEven smaller contributions from gathering pipelines and natural gasdistribution Made paired measurements at Gathering compressor stations Well pads12
Production Facility Measurements 2430 well pads in study area Successfully measuredemissions at 262 well pads 1 manual unloading Tracer meas: 800 kg/hTypically daytimeonly 41 pads had automaticunloadings: Flow: est. Duration: Frequency:8-350 kg/h0.1- 1.8 hours3-36,500 per year Other emissions: 0-107 kg/h Includes pneumatic controllers13Automated controloperates 24/7Unknown duration,assumed continuous
Production - Method Comparison Paired methods: Onsite estimates –measured simulated OTM 33a Emissions 60% lowerthan onsite R2 of 0.02 Tracer Emissions 60%higher than onsite R2 of 0.714
Gathering Compressor Station Emissions0%2%5%16%Simulated Dehy Regen VentsSimulated Crankcase VentsSimulated Direct MeasurementsOn-site Direct MeasurementsSimulated Combustion Slip77%(a) Emission source fraction - individual gathering facilities(b) Emission source fraction - all gathering facilities Most emissions at facilities operating normallyare from “combustion slip” Unburned methane in exhaust of compressor engines Data from recent stack testing performed by partners15
Gathering - Method Comparison Paired methods: Onsite estimates –measured simulated Tracer Similar to Onsite R2 of 0.9 Aircraft Emissions 50%higher than onsite R2 of 0.5 Small sample16
Downwind methods capture large emitters(that on-site teams sometimes can’t)Methane Emissions from 31 Gathering StationsEmissions fromtwo tanks32%Measurable by on-site teamsNot measurable by on-site teams68%Measurable by tracer team100%17
Gathering PipelinesSampled 96 km of gathering pipeline 4,680 km in study area Measurements by GHD Vehicle-based leak detectionDistribution sector infrastructure is concentrated in urbanand suburban regions.Leaks: 1 pipeline leak 95% of all emissions 34 above-ground leaksMeasured Nearly all emissions from “leak list” of distributioncompany 28 city gate stations 100 regulatorsNo new emission factors Existing GHGRP EF agree with databetter than newer distribution data18DistributionOne study partner serves the entire study area (orangeshaded region).Emissions are small relative to other natural gas sectors
Non O&G Methane Emission SourcesAgriculture/Livestock emissions estimated atthe county-level (USDA GHGI data)Wetlands (US Fish & Wildlife GHGI data) Others One landfill in study area6 aircraft landfill measurements during study19 Geologic seeps Wastewater treatment – municipaland septic systems Other power plants (1 in study area)Accounting forevery sourcepossible
Top-Down Measurements
Aircraft mass balance method 15 flights in 23 days (Sep/Oct) 2 flights (Oct 1 & 2) with ideal meteorological conditions for aircraft mass balanceDownwindAircraft profiles:vertical mixing, PBLheightUpwindProfiler:wind,PBLheight150 kmRemaining flights: Identify larger emitting sub-regions incl. repeats to check consistency Sample ethane:methane ratios for source attribution Quantify CH4 emissions from individual facilities21
October 1, 2015 flight overview2535.8Upwind Aircraft Transect35.735.6Latitude65 km35.535.41510435.3CH dry enhancement [ppb]2035.2535.1Downwind Aircraft Transect35-93.222150 .4-91.20
First spatially-resolved aircraft-based CH4emission estimates for a basin Strong spatial correlationwith well countWinddirection R2 0.81 for 2 km widelongitudinal bins Also strong spatialcorrelation with naturalgas production R2 0.75Average CH4 emissions October 1 & 223
Comparing Top-Down toBottom-Up
Study basin total emissionsAggregate all sources togrid cells with timing(unique to this study)25
Compare to top-down estimates 26Error bars shown represent a 95% a confidence interval about the mean result
Study basin emission profilesBottom-up Model Aggregate to grid cell Model transport timeAggregateAircraftMeasurements Time & Location27
Compare to top-down profilesRemarkably similar structure in BU andTD emission profiles strong evidence both methods areestimating the same emissions28
Temporal Variability in Emissions29
Temporal Variability in Emissions Stronger agreement why?Source categories contributing less than 1% each to thestudy period average emission rate are not shown(e.g., natural gas distribution, rice cultivation, landfills,wastewater treatment, etc.) Temporal modeling of BU emissions Spatial modeling of BU emissions Stable winds produced spatially resolved TD estimate30
What if we had even better data? Timing at finer scales can impact results when large intermittent sources exist Would need activity data at the timescale of aircraft measurements Very difficult , if not impossible31
Conclusions Inventory and regional mass balance methods are both right butcare is required when comparing them. Same temporal resolution Same spatial resolution Fair comparison requires a robust estimate of the temporalvariation in emissions To apply to other basins similar data would need to be collected Top-down and bottom-up agreement did not require assumptionson the prevalence of ‘super-emitters’ TD/BU gap seen in prior studies mostly closed by considering timing ofemission events32
Guidance for future comparison studies Strong guidance for future regional comparisons Recommend simultaneous measurements Multiple techniques are necessary to capture large emitters Required activity data Industry cooperation is critical Need site access for quality measurements Activity data – when and how episodic emissions occur – required for mostinfrastructure in basin Need solid understanding of wind conditions Required wind profiler Need simultaneous or at least recent measurements of majorsources33
Peer-reviewed articles resulting from studyBell C, et al. (2017) Comparison of methane emission estimates from multiple measurement techniques at natural gas production pads.Elem Sci Anth 5(0). doi:10.1525/elementa.266.Conley S, et al. (2017) Application of Gauss’s theorem to quantify localized surface emissions from airborne measurements of wind andtrace gases. Atmos Meas Tech 10(9):3345–3358.Mielke-Maday I, et al. (2017) (Submitted) Methane source attribution in a portion of a U.S. onshore dry gas basin using ground andairborne measured C2H6/CH4 enhancement ratios.Robertson AM, et al. (2017) Variation in Methane Emission Rates from Well Pads in Four Oil and Gas Basins with Contrasting ProductionVolumes and Compositions. Environ Sci Technol 51(15):8832–8840.Schwietzke S, et al. (2017) Improved Mechanistic Understanding of Natural Gas Methane Emissions from Spatially Resolved AircraftMeasurements. Environ Sci Technol 51(12):7286–7294.Vaughn TL, et al. (2017) Comparing facility-level methane emission rate estimates at natural gas gathering and boosting stations. ElemSci Anth 5(0). doi:10.1525/elementa.257.Vaughn TL, et al. (2018) Temporal Variability Largely Explains Difference in Top-down and Bottom-up Estimates of MethaneEmissions from a Natural Gas Production Region. Proc Natl Acad Sci.Yacovitch TI, et al. (2017) Natural gas facility methane emissions: measurements by tracer flux ratio in two US natural gas producingbasins. Elem Sci Anth 5(0). doi:10.1525/elementa.251.Zimmerle DJ, et al. (2017) Gathering pipeline methane emissions in Fayetteville shale pipelines and scoping guidelines for future pipelinemeasurement campaigns. Elem Sci Anth 5(0). doi:10.1525/elementa.258.34
AcknowledgementsFunding for this work was provided by RPSEA/NETL contract no12122-95/DE-AC26-07NT42677 to the Colorado School of Mines.Cost share for this project was provided by Colorado EnergyResearch Collaboratory, the National Oceanic and AtmosphericAdministration Climate Program Office, Southwestern Energy, XTOEnergy, a subsidiary of ExxonMobil, Chevron, Equinor (formerlyStatoil) and the American Gas Association, many of whom alsoprovided operational data and/or site access. Additional data and/orsite access was also provided by CenterPoint, Enable MidstreamPartners, Kinder Morgan, and BHP Billiton. We greatly appreciate thesignificant, coordinated efforts of all field measurement personnel andthose who aided in data compilation.35
Daniel ZimmerleSenior Research AssociateCSU Energy Institutedan.zimmerle@colostate.eduThank youTimothy VaughnResearch ScientistCSU Energy Institutetim.vaughn@colostate.edu
6 Study overview Study Design: Select relatively isolated basin with good partner representation Measure most gas infrastructure in the basin during same period as aircraft flights Multiple measurement approaches at facilities to understand true emissions Basin-specific, high-resolution activity data, facility & component counts, and episodic emission timing and location