Transcription
2022Marine EmployeesCompensation SurveyState law requires the Office of Financial Management to create this report(Revised Code of Washington 47.64.170 (8) and 47.64.006)State Human ResourcesOffice of Financial ManagementJune 2022Revised July 2022
2022 Marine Employees’ Compensation Survey2 Page
Table of ContentsSection 1: Executive summary. 5What’s new in the 2022 report. 5Key Findings . 6What we found . 6How well our health care plans perform against the market . 7Percent of health care coverage paid by state employees . 8How well our retirement plans perform against the market . 9How we gathered the data . 9How we sought out the participants . 10Section 2: Survey results . 12Survey category 1: Vessel/Terminal . 13Part 1: Participant representation . 13Part 2: Total compensation . 16Part 3: Premium pay . 23Part 4: Paid time off. 41Part 5: Other benefits . 48Survey category 2: Shipyard Trades . 55Part 1: Participant representation . 55Part 2: Total compensation . 56Part 3: Premium pay . 60Part 4: Paid time off. 64Part 5: Other benefits . 68Survey category 3: Administrative . 71Part 1: Participant representation . 71Part 2: Total compensation . 73Part 3: Premium pay . 78Part 4: Paid time off. 82Part 5: Other benefits . 862020 Marine Employees’ Compensation Survey3 Page
Section 3: Planned pay increases.90Vessel/terminal planned pay increases . 90Shipyard trades planned pay increases . 91Administrative planned pay increases . 91Section 4: Study Methodology . 92How we calculated total compensation . 92Total compensation calculation . 93Health care value . 93Retirement value . 95Terms and definitions . 97Appendix – 2022 MECS questionnaires . 1012022 Marine Employees’ Compensation Survey4 Page
Section 1: Executive summaryThe 2022 Marine Employees Compensation Survey (MECS) compares public and private sector employees among places (west coaststates, Alaska, and British Columbia) doing comparable (but not necessarily identical) work. The survey considers the different pay and jobclassifications and factors that are peculiar to each area (RCW 47.64.320(3)).We use benchmark jobs to compare the base pay among our competitors. A benchmark job is the state's version of a comparable job in themarket. We also collect information about pay practices (such as pay premiums and paid time off), retirement benefits, and health carebenefits. This report does not define the appropriate compensation level for our workforce. Instead, state leaders can use it as a tool to findthe appropriate balance among: Containing government operations costsCompensating state employees fairlyCompeting for specialized employees in the job marketWhat’s new in the 2022 reportWe improved the total compensation methodology we use by analyzing the employee value rather than employer costs for health care andretirement. When we say ‘total compensation,’ we mean the sum of the: Average of actual base pay Employee value of health care benefits Employee value of retirement benefitsWe used the same method as the 2020 survey to protect the confidentiality of private organizations’ data: We did not display average datafor jobs where only one participant reported data, or when one of two participants was a privately held company. We displayed averagedata when three or more participants reported their data.2022 Marine Employees’ Compensation Survey5 Page
Key FindingsWhat we foundVessel/terminal We lag the market in base pay for licensed and unlicensed positions. The average base pay for vessel/terminal positions lagthe market by an average of 16.8% for licensed positions and 20.6% for unlicensed positions. We lead the market in base pay for Port Captain. The average base pay for a vessel/terminal Port Captain leads the market by13.4%. Marine Engineers Beneficial Association (MEBA) Port Engineer lags the market by 0.8%. We lead the market in retirement benefits. Vessel/terminal positions lead the market by an overall average of 18.9% forretirement. We did not receive information on the value of health care plans from vessel/terminal participants. So, there wasinsufficient data to assess Washington’s total compensation position to the market. We found mixed approaches to salary structures by participants. Some provide a single (flat) rate of pay for jobs and some use asalary range with a minimum and maximum value. We included data from both structures in overall market reporting. You can findadditional details about these calculations in Section 4. Study Methodology, How we calculated total compensation. One participant reported a differential rate for relief positions. Relief positions fill in for regularly scheduled employees who areunable to report to work. You can find additional details in the Section 2. Vessel/Terminal, Part 3. Premium pay notes. Seven organizations participated in the vessel/terminal category of the survey. Six participated in 2020, with one new participantthis year. Five participants submitted custom questionnaires and State HR collected data from two participants’ public web sites.Shipyard trades We lag the market in base pay. The average base pay for shipyard positions lag the market by an average of 7.3%.o We improved our shipyard trades positions’ comparison to market by 30% since the 2020 survey. This appears to be due toadditional salary data that new participants provided. We did not receive information regarding the value of health care plans or retirement from shipyard trades participants. So, therewas insufficient data for us to assess Washington’s total compensation position to the market. Participation for this category doubled in 2022. Six organizations participated in the shipyard trades category. Three participated in2020 and there were three new participants this year. All participants submitted custom questionnaires.2022 Marine Employees’ Compensation Survey6 Page
Administrative We lag the market in base pay. The average base pay for administrative positions lags the market by an average of 11.1 percent. We lag the market in total compensation (base pay with benefits). Administrative positions lag the market by an average of13.3%. For health care, we lag the market by 10.7%. For retirement, we lag the market by an average of 25.3%. Seven organizations participated in the administrative section. Five participated in 2020 and there were two new participants. Sixparticipants submitted custom questionnaires and State HR collected data from one participant’s public websites.How well our health care plans perform against the marketFor the 2022 survey, we calculated total compensation through three components: base pay value health care value retirement value.Health care is subject to collective bargaining for most represented employee groups as part of a coalition of unions instead of with eachexclusive representative. While retirement benefits in Washington are not subject to collective bargaining for most employees, thesebenefits are valuable components of total compensation. And these benefits provide important context when we compare Washington’scompensation practices with public or private employers.Private sector organizations did not provide the information we needed to assess the employee’s value of health care and retirementbenefits. As a result, very few benchmark jobs have a total compensation result for 2022.2022 Marine Employees’ Compensation Survey7 Page
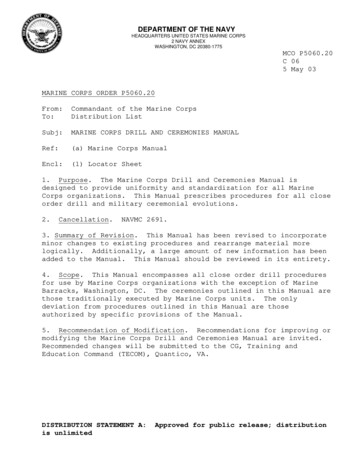
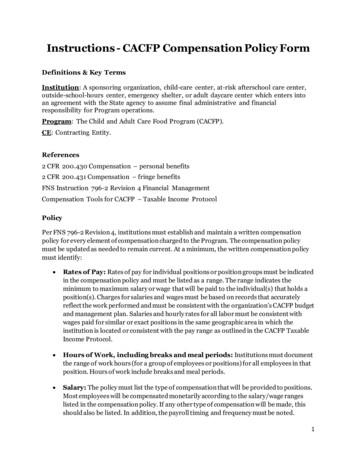
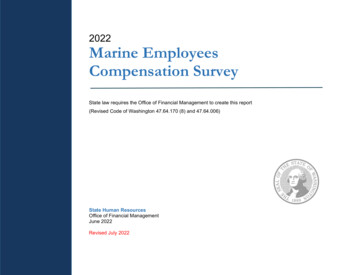
Percent of health care coverage paid by state employeesHere are the most important takeaways from this graphic: Our health care coverage provides better coverage at a lower price than the market. A state employee will pay less for their health care plan than the market can offer. A state employee will pay even less for their health care when the plan includes family or dependents (spouse, children, family).All the groups combinedGovernment/public sector/educationPrivate sectorState employee health care coverage34%32%30%23%21%20%18%17%15%15%15%12%Single employeeEmployee sharing family plan with aspouse/children (dependent)Overall comparison against marketSurvey data from Willis Towers Watson. All rights reserved. Proprietary and Confidential. For Willis Towers Watson and Willis Towers Watson client use only2022 Marine Employees’ Compensation Survey8 Page
How well our retirement plans perform against the marketThe state is competitive in its retirement plan offerings. To support this conclusion, we took the employee’s future benefit amount andturned it into a percentage that we based on average base pay. That’s why the state’s retirement value varies by benchmark job.PERS Plan 2 is the state’s most popular retirement plan. This defined benefit plan (which is an employee’s guaranteed retirement benefitregardless of the stock market) includes most in-state public sector participants.Published data indicates that private sector employers offer defined contribution plans more often than other kinds of retirement plans.For more information, you can look at Section 4: Study methodology, retirement value.How we gathered the dataThe 2022 survey includes three categories that represent the Washington State Ferry System (WSFS) operations and 13 collectivebargaining units: Survey category 1: Vessel/Terminal – bargaining unitso Masters, Mates and Pilots Masters (MM&P Masters)o Masters, Mates and Pilots Mates (MM&P Mates)o Marine Engineers Beneficial Association Licensed (MEBA Licensed)o Marine Engineers Beneficial Association Unlicensed (MEBA Unlicensed)o Marine Engineers Beneficial Association Port Engineero Inland Boatmen’s Union of the Pacific (IBU Deck and Terminal positions)o Ferry Agents, Supervisors and Project Administrators Association (FASPAA Terminal Supervisor)o Port Captain (nonrepresented) Survey category 2: Shipyard trades – bargaining unitso Pacific Northwest Regional Council of Carpenters (Carpenters)o Puget Sound Metal Trades Council (Metal Trades)o Inland Boatmen’s Union of the Pacific (IBU) (Shoregang positions)2020 Marine Employees’ Compensation Survey9 Page
Survey category 3: Administrative – bargaining unitso Office and Professional Employees International Union (OPEIU) Local 8o Service Employees International Union (SEIU) Local 6o Masters, Mates and Pilots Watch Center Supervisors (MM&P Supervisors)We used three custom questionnaires representing the survey categories to collect pay practice, paid time off, health care, retirement andother benefit questions.How we sought out the participantsWe sent survey invitations to the same 32 organizations that we invited to participate in the 2022 survey: Nineteen organizations responded for a 59% participation rate. Fourteen organizations submitted data. State HR collected datafrom public web sites for two organizations. Six organizations are new participants.We invited organizations to submit data based on the nature of their operation. To make participation more convenient, we pre-populatedthe questionnaires with previous responses from 2020 participants. There were 7 participants for vessel/terminal: Public and private ferry systems on the West Coast of the United States, includingAlaska and British Columbia. There was one new participant:o Skagit County: invited for 2020 but did not respond. There were 5 participants for shipyard trades: public and private shipyards or ports engaged in ship and/or dock building,maintenance and/or repair in the Pacific Northwest, including California and British Columbia. There were three new participants:o Boilermakers Local 104: requested to participate by the Metal Trades President.o Vigor: invited for 2020 but did not respond.o Continental Container of San Diego: referred by a Vigor point of contact. There were 6 participants for administrative: public and private companies engaged in marine business and large municipal/transitemployers in the Puget Sound region. There were two new participants:o Saltchuk Marine Shared Services: this survey contact previously worked for an organization that participated in the 2020survey.o Sound Transit: invited for 2020 but did not respond.2022 Marine Employees’ Compensation Survey10 Page
2022 Participating OrganizationsParticipantAlaska Marine Highway System (State Ferry)Black Ball TransportBoilermakers Local 104British Columbia Ferry Services Inc.City of SeattleContinental Maritime of San Diego, LLC.Crowley Maritime Marine ServicesDakota Creek IndustriesKing CountyKitsap TransitPacific FishermanPierce CountyPort of TacomaSaltchuk Marine Shared ServicesSkagit CountySound TransitVancouver Shipyards Co. Ltd.VigorWhatcom County2022 Marine Employees’ Compensation SurveyVessel/Terminal ShipyardTradesAdministrative New 2022Participant SurveyResponseSubmitted dataSubmitted dataSubmitted dataSubmitted dataSubmitted dataSubmitted dataSubmitted dataSubmitted dataData minedSubmitted dataSubmitted dataSubmitted dataSubmitted dataSubmitted dataData minedSubmitted dataSubmitted dataSubmitted dataSubmitted data11 Page
Section 2: Survey resultsIn this section, we present Washington’s benchmark job information and related participant responses by survey category in five parts: Part 1: Participant representation – we note the applicable participant employee group when participants provided information inmultiple questionnaires. Part 2: Total compensation – includes the hourly rates for base salary, health care value and retirement value. Part 3: Premium pay – includes overtime compensation, penalty pay, other premiums paid for undesirable shifts. Part 4: Paid time off – includes annual accrual rates for vacation/paid time off, sick leave and holidays. Part 5: Other benefits – includes health care value, retirement value, apprenticeship contributions, training, license reimbursement,medical examinations, employer-directed travel.Where applicable, we provide a summary of selected Washington collective bargaining agreement information and participant variationsfollow the result tables. We include this information to help the reader better compare between Washington and other groups. Thisinformation does not represent a comprehensive overview of the related WSFS collective bargaining agreements.2022 Marine Employees’ Compensation Survey12 Page
Survey category 1: Vessel/TerminalPart 1: Participant representationMM&P Masters and Mates 301 Master/Captain/Pilot 302 Chief Mate/Pilot 303 Second MateMM&P Masters participants by EE group(benchmarks 301)Alaska Masters, Mates, & Pilots (MMP)Black Ball Transport – MMPKing CountyKitsap TransitSkagit CountyMM&P Mates participants by EE group(benchmarks 302 - 303)Alaska Masters, Mates, & Pilots (MMP)Black Ball Transport – MMPBritish Columbia Ferry Services Inc.King CountyKitsap TransitSkagit CountyMEBA Licensed 304 Staff Chief Engineer 305 Chief Engineer 306 Assistant EngineerMEBA Unlicensed 307 Oiler 308 WiperMEBA Licensed participants by EE group(benchmarks 304 - 306)Alaska MEBABlack Ball Transport – MEBABritish Columbia Ferry Services Inc.King CountySkagit CountyMEBA Unlicensed participants by EE group(benchmarks 307 - 308)Alaska IBUBlack Ball Transport – IBUBritish Columbia Ferry Services Inc.King CountySkagit County2022 Marine Employees’ Compensation Survey13 Page
IBU Deckhand 309 Able Seaman/Bos’n 310 Able Seaman (AB) 310 Ordinary Seaman (OS)IBU Deckhand participants by EE group(benchmarks 309 - 311)Alaska IBUBlack Ball Transport - IBUBritish Columbia Ferry Services Inc.King CountyKitsap TransitSkagit CountyWhatcom CountyIBU Terminal 312 Ticket Seller (Auto) 313 Ticket Taker 314 Terminal Attendant/Watchman 315 Information Agent 316 Web Information Agent 317 Shore Gang WorkerIBU Terminal participants by EE group(benchmarks 312 - 317)Alaska SUBritish Columbia Ferry Services Inc.Kitsap TransitSkagit CountyWhatcom CountyFASPAA Terminal Supervisor 318 Terminal SupervisorFASPAA Terminal Supervisor participants by EE group(benchmark 318)Alaska SUBritish Columbia Ferry Services Inc.Skagit County2022 Marine Employees’ Compensation Survey14 Page
MEBA Port Engineer, Port Captain 319 MEBA Port Engineer 320 Port Captain [nonrepresented]MEBA Port Engineer participants by EE group(benchmark 320)Alaska SUKitsap TransitSkagit County2022 Marine Employees’ Compensation SurveyPort Captain participants by EE group(benchmark 319)Alaska SUKitsap TransitSkagit County15 Page
Part 2: Total compensationIncludes actual base pay, health care value, retirement value.The following tables show the hourly participant average and Washington’s base salary, health care value, retirement value and totalcompensation for vessel/terminal benchmark jobs.MM&P MastersBenchmarkno.301Benchmark ipants /WashingtonAll participantsParticipantsrequiring Pilot'slicense forvessels of anygross tonsWashingtonHourlyretirementvalue 2 5.64 55.27 5.31 7.00 Orgs5No. ofemployees28SalarySchedule60%226100% 47.44 63.80 53.241240% 55.27 55.2726.1%26.1%% Difference(All participants)MM&P Masters - Average % Above or Below Market (all participants):2022 Marine Employees’ Compensation SurveyHourlyhealth carevalue 1-Hourlytotal comp.(actual basepay health care retirement)-Hourlysalaryrangeminimum(average) 40.86Hourlysalaryrangemaximum(average) 53.06Hourlyactual basepay(average) 58.8316 Page
MMP MatesBenchmarkno.302Benchmark titleChief Mate/Pilot302Chief Mate/Pilot302Chief Mate/Pilot302Chief Mate/Pilot303Second Mate303Second Mate303Second Mate303Second MateParticipants /WashingtonParticipantsParticipantsrequiring Pilot'slicense forvessels of anygross tonsWashington 44.62 5.31 5.65 55.59n/a-23.3%n/an/an/a---No. ofemployees19SalarySchedule0%1170%-- 42.991350% 44.62 44.62n/a(All rlyactual basepay(average) 55.013160%-- 49.921140%-- 36.89190% 40.83 40.83 41.65 5.31 5.17 % Difference(All participants)MM&P Mates - average % above or below market (all participants):2022 Marine Employees’ Compensation SurveyHourlyretirementvalue 2-No.ofOrgs3% DifferenceParticipantsParticipantsrequiring Pilot'slicense forvessels of anygross tonsWashingtonHourlyhealth carevalue 1-Hourlytotal comp.(actual basepay health care retirement)-Hourlysalaryrangeminimum(average)-17 Page
MEBA LicensedBenchmarkno.304304304No.ofOrgs1No. mum(average) 66.77n/aHourlysalaryrangemaximum(average) 66.77n/aHourlyactual basepay(average) 66.77n/aHourlyhealth carevalue 1 5.31n/aHourlyretirementvalue 2 8.46n/aHourlytotal comp.(actual basepay health care retirement) 80.54n/aBenchmark titleStaff Chief EngineerStaff Chief EngineerStaff Chief EngineerParticipants /WashingtonParticipantsWashington% Difference305305305Chief EngineerChief EngineerChief EngineerParticipantsWashington% Difference2122440%0% 50.73n/a 50.73n/a 50.73-12.5% 5.31n/a 6.43n/a 62.47n/a306306306Assistant EngineerAssistant EngineerAssistant EngineerParticipantsWashington% Difference41146025%0% 44.81 42.74-4.8% 56.80 42.74-32.9% 52.16 42.74-23.5% 5.31n/a 5.65 5.41-4.4% 53.47n/aMEBA Licensed - Average % Above or Below Market:-4.8%-32.9%-23.5n/a-4.4%n/aVessel/Terminal Licensed- Average % Above or Below eminimum(average) 32.92 28.49-15.5%Hourlysalaryrangemaximum(average) 41.73 28.49-46.5%Hourlyretirementvalue 2 3.21 3.6111.0%Hourlytotal comp.(actual basepay health care retirement) 37.41n/aMEBA UnlicensedBenchmarkno.307307307Benchmark titleOilerOilerOilerParticipants /WashingtonParticipantsWashington% Difference2022 Marine Employees’ Compensation SurveyNo.ofOrgs51No. ofemployees14151SalarySchedule20%0%Hourlyactual basepay(average) 36.30 28.49-28.5%Hourlyhealth carevalue 1 5.31n/a18 Page
MEBA Unlicensed (continued)Benchmarkno.308308308Benchmark titleWiperWiperWiperParticipants /WashingtonParticipantsWashington% DifferenceNo.ofOrgs31No. ofemployees51SalarySchedule0%0%MEBA Unlicensed - successful benchmarks average % above or below market:Hourlysalaryrangeminimum(average) 25.10n/aHourlysalaryrangemaximum(average) 25.10n/aHourlyactual basepay(average) 34.48 25.10-37.4%Hourlyhealth carevalue 1 5.31n/aHourlyretirementvalue 2 3.18n/aHourlytotal comp.(actual basepay health care retirement) angeminimum(average) 33.54n/aHourlysalaryrangemaximum(average) 33.54n/aHourlyactual basepay(average) 34.94 34.21-2.1%Hourlyhealth carevalue 1 5.31n/aHourlyretirementvalue 2 2.62 4.2538.4%Hourlytotal comp.(actual basepay health care retirement) 43.77n/aIBUBenchmarkno.309309309No.ofOrgs41No. ofemployees1630SalarySchedule0%0%Benchmark titleAble Seaman/Bos'nAble Seaman/Bos'nAble Seaman/Bos'nParticipants /WashingtonParticipantsWashington% Difference310310310Able Seaman (AB)Able Seaman (AB)Able Seaman (AB)ParticipantsWashington% Difference51504920%0% 34.52 31.85-8.4% 43.76 31.85-37.4% 37.04 32.49-14.0% 5.31n/a 4.03n/a 41.84n/a311311311Ordinary Seaman (OS)Ordinary Seaman (OS)Ordinary Seaman (OS)ParticipantsWashington% Difference41537825%0% 34.41 26.54-29.7% 46.30 26.54-74.5% 36.85 27.19-35.5% 5.31n/a3.23 3.363.8% 35.87n/a312312312Ticket Seller (Auto)Ticket Seller (Auto)Ticket Seller (Auto)ParticipantsWashington% Difference21660%0% 29.31n/a 29.31n/a 29.94n/a 5.31n/a 3.71n/a 38.97n/a2022 Marine Employees’ Compensation Survey19 Page
IBU(continued)Benchmarkno.313313313No.ofOrgs21No. inimum(average) 26.29n/aHourlysalaryrangemaximum(average) 26.29n/aHourlyactual basepay(average) 26.54n/aHourlyhealth carevalue 1 5.31n/aHourlyretirementvalue 2 3.33n/aHourlytotal comp.(actual basepay health care retirement) 35.19n/aBenchmark titleTicket TakerTicket TakerTicket TakerParticipants /WashingtonParticipantsWashington% Difference314314314Terminal Attn/WatchmanTerminal Attn/WatchmanTerminal Attn/WatchmanParticipantsWashington% Difference11420%0% 25.15n/a 25.15n/a 24.94n/a 5.31n/a 3.19n/a 33.44n/a315315315Information AgentInformation AgentInformation AgentParticipantsWashington% Difference3151467%0.0% 23.29 27.3714.9% 39.02 27.37-42.6% 28.63 27.04-5.9 5.31n/a 2.46 3.4729.2% 35.82n/a316316316Web Information AgentWeb Information AgentWeb Information AgentParticipantsWashington% Difference1114100%0% 29.67n/a 29.67n/a 30.26n/a 5.31n/a 3.76n/a 39.33n/a317317317Shore Gang WorkerShore Gang WorkerShore Gang WorkerParticipantsWashington% Difference1111140%0% 35.04n/a 35.04n/a 35.74n/a 5.31n/a 4.44n/a 45.49n/a19.2%-51.5%-14.4%n/a23.8%n/aIBU - successful benchmarks average % above or below market:2022 Marine Employees’ Compensation Survey20 Page
FASPAA Terminal SupervisorHourlysalaryrangeminimum(average) 43.70n/aHourlysalaryrangemaximum(average) 43.70n/aHourlyactual basepay(average) 43.70n/aHourlyhealth carevalue 1 5.31n/aHourlyretirementvalue 2 5.54n/aHourlytotal comp.(actual basepay health care retirement) 54.55n/aFASPAA Terminal Supervisor - successful benchmarks average % above or below market:n/an/an/an/an/an/aVessel/Terminal Unlicensed - successful benchmarks average % above or below geminimum(average) 49.01 64.0323.3%Hourlysalaryrangemaximum(average) 82.11 64.03-28.2%Hourlyactual basepay(average) 55.48 64.0313.4%Hourlyhealth carevalue 1 5.31n/aHourlyretirementvalue 2 5.11 8.1137.0%Hourlytotal comp.(actual basepay health care retirement) 318318Benchmark titleTerminal SupervisorTerminal SupervisorTerminal SupervisorParticipants /WashingtonParticipantsWashington% DifferenceNo.ofOrgs21No. ofemployees130SalarySchedule50%0%Port CaptainBenchmarkno.319319319Benchmark titlePort CaptainPort CaptainPort CaptainParticipants /WashingtonParticipantsWashington% DifferenceNo.ofOrgs21No. ofemployees42SalarySchedule100%0%Port Captain - successful benchmarks average % above or below market:2022 Marine Employees’ Compensation Survey21 Page
MEBA Port EngineerBenchmarkno.320320320Benchmark titlePort EngineerPort EngineerPort EngineerParticipants /WashingtonParticipantsWashington% DifferenceNo.ofOrgs21No. ofemployees23SalarySchedule100%0%MEBA Port Engineer - successful benchmarks average % above or below market:V/T Port Captain, Port Engineer - successful benchmark average % above or below market:Hourlysalaryrangeminimum(average) 46.38 61.1524.2%Hourlysalaryrangemaximum(average) 77.29 61.15-26.4%Hourlyactual basepay(average) 61.66 61.15-0.8%Hourlyhealth carevalue 1 5.31n/aHourlyretirementvalue 2 5.31 7.7531.4%Hourlytotal comp.(actual basepay health care retirement) /a34.2%n/aThe following vessel/terminal benchmarks failed due to lack of participant responses: 304 Staff Chief Engineer312
We use benchmark jobs to compare the base pay among our competitors. A benchmark job is the state's version of a comparable job in the . o Masters, Mates and Pilots Watch Center Supervisors (MM&P Supervisors) . Contact Terri Parker, Compensation Policy & Planning Analyst, at 360-515-6299 or terri.parker@ofm.wa.gov Thank you for your .