Transcription
PRE-PUBLICATION COPY.This document has been peer-reveiwedand edited but not proofread.Analysis of RacialDisparities in theNew York PoliceDepartment’s Stop,Question, andFrisk PracticesGreg RidgewaySupported by the New York City Police FoundationSafety and JusticeA RAND INFRASTRUCTURE, SAFETY, AND ENVIRONMENT PROGRAM
The research described in this report was supported by the New York City PoliceFoundation and was conducted under the auspices of the Center on Quality Policing(CQP), part of the Safety and Justice Program within RAND Infrastructure, Safety, andEnvironment (ISE).The RAND Corporation is a nonprofit research organization providing objective analysisand effective solutions that address the challenges facing the public and private sectorsaround the world. RAND’s publications do not necessarily reflect the opinions of itsresearch clients and sponsors.R is a registered trademark. Copyright 2007 RAND CorporationAll rights reserved. No part of this book may be reproduced in any form by any electronic ormechanical means (including photocopying, recording, or information storage and retrieval)without permission in writing from RAND.Published 2007 by the RAND Corporation1776 Main Street, P.O. Box 2138, Santa Monica, CA 90407-21381200 South Hayes Street, Arlington, VA 22202-50504570 Fifth Avenue, Suite 600, Pittsburgh, PA 15213-2665RAND URL: http://www.rand.org/To order RAND documents or to obtain additional information, contactDistribution Services: Telephone: (310) 451-7002;Fax: (310) 451-6915; Email: order@rand.org
PrefaceIn February 2007, the New York City Police Department (NYPD) released statistics that indicated that more than a half-million pedestrians had been stopped on suspicion of a crime inNew York City in 2006. Almost 90 percent of the stops involved nonwhites. The departmentimmediately faced questions regarding its stop, question, and frisk (SQF) patterns and practices. The department contacted the RAND Center on Quality Policing (CQP) to conduct anobjective analysis of data collected in street encounters between the police and the public, andthe New York City Police Foundation funded a project that began later that month.This report documents the methods and findings from the RAND researchers’ analysis ofNYPD’s SQF data. This report should be of interest to NYPD executives and command staffand New York City policymakers and community members. This report may also prove usefulto residents and officials in other jurisdictions where similar practices are under considerationand similar issues are being confronted. Related RAND work that may be of interest to readersof this report includes the following: Police-Community Relations in Cincinnati (Riley et al., 2005) Police-Community Relations in Cincinnati: Year Two Evaluation Report (Ridgeway et al.,2006) Testing for Racial Profiling in Traffic Stops From Behind a Veil of Darkness (Grogger andRidgeway, 2006) Assessing the Effect of Race Bias in Post-Traffic Stop Outcomes Using Propensity Scores (Ridgeway, 2006) Race and the Decision to Seek the Death Penalty in Federal Cases (Klein, Berk, and Hickman, 2006) Police Personnel Challenges After September 11: Anticipating Expanded Duties and a Changing Labor Pool (Raymond et al., 2005) Assessing Racial Profiling More Credibly (Ridgeway and Riley, 2004).The RAND Center on Quality PolicingThis research was conducted under the auspices of the Center on Quality Policing (CQP), partof the Safety and Justice Program within RAND Infrastructure, Safety, and Environment(ISE). The center’s mission is to help guide the efforts of police agencies to improve the efficiency, effectiveness, and fairness of their operations. The center’s research and analysis focuson force planning (e.g., recruitment, retention, training), performance measurement, costiii
ivAnalysis of Racial Disparities in the New York City Police Department’s Stop, Question, and Frisk Practiceseffective best practices, and use of technology, as well as issues in police-community relations.The mission of RAND Infrastructure, Safety, and Environment is to improve the development, operation, use, and protection of society’s essential physical assets and natural resourcesand to enhance the related social assets of safety and security of individuals in transit and intheir workplaces and communities. Safety and Justice Program research addresses occupational safety, transportation safety, food safety, and public safety including violence, policing,corrections, substance abuse, and public integrity.Questions or comments about this report should be sent to the project leader, Greg Ridgeway (Greg Ridgeway@rand.org). Information is available online about the Safety and JusticeProgram (http://www.rand.org/ise/safety) and the CQP (http://www.rand.org/ise/centers/quality policing/). Inquiries about the CQP should be made to its associate director, JeremyWilson (Jeremy Wilson@rand.org). Inquiries about research projects should be sent to the following address:Andrew Morral, DirectorSafety and Justice Program, ISERAND Corporation1200 South Hayes StreetArlington, VA 22202-5050703-413-1100, x5119Andrew Morral@rand.org
ContentsPreface. . . . . . . . . . . . . . . . . . . . . . . . . . . . . . . . . . . . . . . . . . . . . . . . . . . . . . . . . . . . . . . . . . . . . . . . . . . . . . . . . . . . . . . . . . . . . . . . . . . . . . . . . . . iiiFigures. . . . . . . . . . . . . . . . . . . . . . . . . . . . . . . . . . . . . . . . . . . . . . . . . . . . . . . . . . . . . . . . . . . . . . . . . . . . . . . . . . . . . . . . . . . . . . . . . . . . . . . . . . . viiTables. . . . . . . . . . . . . . . . . . . . . . . . . . . . . . . . . . . . . . . . . . . . . . . . . . . . . . . . . . . . . . . . . . . . . . . . . . . . . . . . . . . . . . . . . . . . . . . . . . . . . . . . . . . . . ixSummary. . . . . . . . . . . . . . . . . . . . . . . . . . . . . . . . . . . . . . . . . . . . . . . . . . . . . . . . . . . . . . . . . . . . . . . . . . . . . . . . . . . . . . . . . . . . . . . . . . . . . . . . xiAcknowledgments. . . . . . . . . . . . . . . . . . . . . . . . . . . . . . . . . . . . . . . . . . . . . . . . . . . . . . . . . . . . . . . . . . . . . . . . . . . . . . . . . . . . . . . . . . . xviiAbbreviations. . . . . . . . . . . . . . . . . . . . . . . . . . . . . . . . . . . . . . . . . . . . . . . . . . . . . . . . . . . . . . . . . . . . . . . . . . . . . . . . . . . . . . . . . . . . . . . . . . xixChapter OneIntroduction: Review of the New York City Police Department’s Stop, Question, and FriskPolIcy and Practices. . . . . . . . . . . . . . . . . . . . . . . . . . . . . . . . . . . . . . . . . . . . . . . . . . . . . . . . . . . . . . . . . . . . . . . . . . . . . . . . . . . . . . . 1Introduction. . . . . . . . . . . . . . . . . . . . . . . . . . . . . . . . . . . . . . . . . . . . . . . . . . . . . . . . . . . . . . . . . . . . . . . . . . . . . . . . . . . . . . . . . . . . . . . . . . . . . . . 1Levels of Police-Initiated Contacts Between Police and Citizens in New York State. . . . . . . . . . . . . . . . . . . . 2Training of Officers on Stop, Question, and Frisk policies. . . . . . . . . . . . . . . . . . . . . . . . . . . . . . . . . . . . . . . . . . . . . . . . . 3Chapter TwoDescription of the 2006 Stop, Question, and Frisk Data. . . . . . . . . . . . . . . . . . . . . . . . . . . . . . . . . . . . . . . . . . . . . . . 7Chapter ThreeExternal Benchmarking for the Decision to Stop. . . . . . . . . . . . . . . . . . . . . . . . . . . . . . . . . . . . . . . . . . . . . . . . . . . . . . . 13Summary. . . . . . . . . . . . . . . . . . . . . . . . . . . . . . . . . . . . . . . . . . . . . . . . . . . . . . . . . . . . . . . . . . . . . . . . . . . . . . . . . . . . . . . . . . . . . . . . . . . . . . . . . 13Introduction. . . . . . . . . . . . . . . . . . . . . . . . . . . . . . . . . . . . . . . . . . . . . . . . . . . . . . . . . . . . . . . . . . . . . . . . . . . . . . . . . . . . . . . . . . . . . . . . . . . . . . 13Residential Census. . . . . . . . . . . . . . . . . . . . . . . . . . . . . . . . . . . . . . . . . . . . . . . . . . . . . . . . . . . . . . . . . . . . . . . . . . . . . . . . . . . . . . . . . . . . . . 14Arrests in 2005. . . . . . . . . . . . . . . . . . . . . . . . . . . . . . . . . . . . . . . . . . . . . . . . . . . . . . . . . . . . . . . . . . . . . . . . . . . . . . . . . . . . . . . . . . . . . . . . . . 16Crime-Suspect Descriptions. . . . . . . . . . . . . . . . . . . . . . . . . . . . . . . . . . . . . . . . . . . . . . . . . . . . . . . . . . . . . . . . . . . . . . . . . . . . . . . . . . . 18Conclusions. . . . . . . . . . . . . . . . . . . . . . . . . . . . . . . . . . . . . . . . . . . . . . . . . . . . . . . . . . . . . . . . . . . . . . . . . . . . . . . . . . . . . . . . . . . . . . . . . . . . . . 19Chapter FourInternal Benchmarking for the Decision to Stop. . . . . . . . . . . . . . . . . . . . . . . . . . . . . . . . . . . . . . . . . . . . . . . . . . . . . . . . 21Summary. . . . . . . . . . . . . . . . . . . . . . . . . . . . . . . . . . . . . . . . . . . . . . . . . . . . . . . . . . . . . . . . . . . . . . . . . . . . . . . . . . . . . . . . . . . . . . . . . . . . . . . . . 21Introduction. . . . . . . . . . . . . . . . . . . . . . . . . . . . . . . . . . . . . . . . . . . . . . . . . . . . . . . . . . . . . . . . . . . . . . . . . . . . . . . . . . . . . . . . . . . . . . . . . . . . . . 21Methods. . . . . . . . . . . . . . . . . . . . . . . . . . . . . . . . . . . . . . . . . . . . . . . . . . . . . . . . . . . . . . . . . . . . . . . . . . . . . . . . . . . . . . . . . . . . . . . . . . . . . . . . . 22Results. . . . . . . . . . . . . . . . . . . . . . . . . . . . . . . . . . . . . . . . . . . . . . . . . . . . . . . . . . . . . . . . . . . . . . . . . . . . . . . . . . . . . . . . . . . . . . . . . . . . . . . . . . . 26Conclusions. . . . . . . . . . . . . . . . . . . . . . . . . . . . . . . . . . . . . . . . . . . . . . . . . . . . . . . . . . . . . . . . . . . . . . . . . . . . . . . . . . . . . . . . . . . . . . . . . . . . . 30Chapter FiveAnalysis of Post-Stop Outcomes. . . . . . . . . . . . . . . . . . . . . . . . . . . . . . . . . . . . . . . . . . . . . . . . . . . . . . . . . . . . . . . . . . . . . . . . . . . . 31
viAnalysis of Racial Disparities in the New York City Police Department’s Stop, Question, and Frisk PracticesSummary. . . . . . . . . . . . . . . . . . . . . . . . . . . . . . . . . . . . . . . . . . . . . . . . . . . . . . . . . . . . . . . . . . . . . . . . . . . . . . . . . . . . . . . . . . . . . . . . . . . . . . . . . 31Introduction. . . . . . . . . . . . . . . . . . . . . . . . . . . . . . . . . . . . . . . . . . . . . . . . . . . . . . . . . . . . . . . . . . . . . . . . . . . . . . . . . . . . . . . . . . . . . . . . . . . . . . 31Methods. . . . . . . . . . . . . . . . . . . . . . . . . . . . . . . . . . . . . . . . . . . . . . . . . . . . . . . . . . . . . . . . . . . . . . . . . . . . . . . . . . . . . . . . . . . . . . . . . . . . . . . . . . 32Results. . . . . . . . . . . . . . . . . . . . . . . . . . . . . . . . . . . . . . . . . . . . . . . . . . . . . . . . . . . . . . . . . . . . . . . . . . . . . . . . . . . . . . . . . . . . . . . . . . . . . . . . . . . . 35Analysis of Hit Rates. . . . . . . . . . . . . . . . . . . . . . . . . . . . . . . . . . . . . . . . . . . . . . . . . . . . . . . . . . . . . . . . . . . . . . . . . . . . . . . . . . . . . . . . . . . 40Conclusions. . . . . . . . . . . . . . . . . . . . . . . . . . . . . . . . . . . . . . . . . . . . . . . . . . . . . . . . . . . . . . . . . . . . . . . . . . . . . . . . . . . . . . . . . . . . . . . . . . . . . 42Chapter SixConclusions and Recommendations. . . . . . . . . . . . . . . . . . . . . . . . . . . . . . . . . . . . . . . . . . . . . . . . . . . . . . . . . . . . . . . . . . . . . . 43Conclusions. . . . . . . . . . . . . . . . . . . . . . . . . . . . . . . . . . . . . . . . . . . . . . . . . . . . . . . . . . . . . . . . . . . . . . . . . . . . . . . . . . . . . . . . . . . . . . . . . . . . . 43Recommendations. . . . . . . . . . . . . . . . . . . . . . . . . . . . . . . . . . . . . . . . . . . . . . . . . . . . . . . . . . . . . . . . . . . . . . . . . . . . . . . . . . . . . . . . . . . . . . 44AppendixesA.B.C.D.Details of Statistical Models Used in the External-Benchmark Analysis. . . . . . . . . . . . . . . . . . . . . . 47Details of Propensity-Score Weighting. . . . . . . . . . . . . . . . . . . . . . . . . . . . . . . . . . . . . . . . . . . . . . . . . . . . . . . . . . . . . . . 49Estimating False Discovery Rates. . . . . . . . . . . . . . . . . . . . . . . . . . . . . . . . . . . . . . . . . . . . . . . . . . . . . . . . . . . . . . . . . . . . . 51Unified Form 250: Stop, Question, and Frisk Report Worksheet. . . . . . . . . . . . . . . . . . . . . . . . . . . . . . . 53References. . . . . . . . . . . . . . . . . . . . . . . . . . . . . . . . . . . . . . . . . . . . . . . . . . . . . . . . . . . . . . . . . . . . . . . . . . . . . . . . . . . . . . . . . . . . . . . . . . . . . . . 57
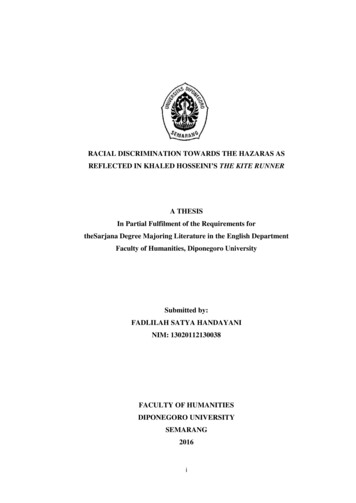
Figures2.1.2.2.3.1.4.1.4.2.Stops per 1,000 People (estimated daytime population). . . . . . . . . . . . . . . . . . . . . . . . . . . . . . . . . . . . . . . 7Seven Most Common Suspected Crimes Reported as Reason for the Stop, by Race. . . . . . . 8Comparison of Stop Rates to Seven External Benchmarks. . . . . . . . . . . . . . . . . . . . . . . . . . . . . . . . . . . 18Maps of the Sample Officer’s Stops and of Similarly Situated Stops Made by OtherOfficers. . . . . . . . . . . . . . . . . . . . . . . . . . . . . . . . . . . . . . . . . . . . . . . . . . . . . . . . . . . . . . . . . . . . . . . . . . . . . . . . . . . . . . . . . . . . . 23Distribution of 2,756 Officer-Level Analyses. . . . . . . . . . . . . . . . . . . . . . . . . . . . . . . . . . . . . . . . . . . . . . . . . . 27vii
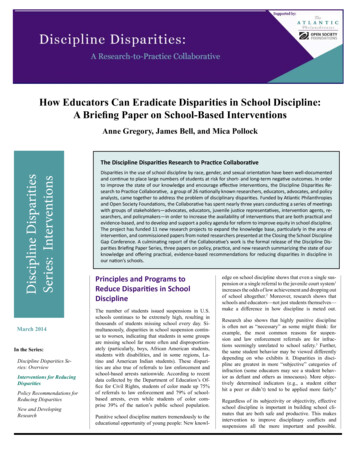
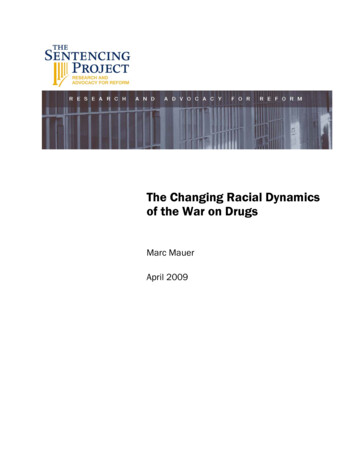
5.5.Frequency of Suspected Crimes and Recovery Rates of Contraband for Frisked orSearched Suspects, by Race. . . . . . . . . . . . . . . . . . . . . . . . . . . . . . . . . . . . . . . . . . . . . . . . . . . . . . . . . . . . . . . . . . . . . . . 11Results of a Residential-Census Benchmark Analysis. . . . . . . . . . . . . . . . . . . . . . . . . . . . . . . . . . . . . . . . . 14Construction of an Internal Benchmark for a Sample Officer. . . . . . . . . . . . . . . . . . . . . . . . . . . . . . 24Comparison of the Percentage of Stops for a Particular Suspected Crime for theSample Officer and the Officer’s Internal Benchmark. . . . . . . . . . . . . . . . . . . . . . . . . . . . . . . . . . . . . . . . . 25Internal-Benchmark Analysis for Stop Rates of Black Suspects. . . . . . . . . . . . . . . . . . . . . . . . . . . . . 28Internal-Benchmark Analysis for Stop Rates of Hispanic Suspects. . . . . . . . . . . . . . . . . . . . . . . . . . 29Internal-Benchmark Analysis for Stop Rates of Hispanic Suspects, Excluding StopsBased on Suspect Descriptions or Calls for Service. . . . . . . . . . . . . . . . . . . . . . . . . . . . . . . . . . . . . . . . . . . . 29Distribution of Stop Features, by Race, for Manhattan South. . . . . . . . . . . . . . . . . . . . . . . . . . . . . . . 33Comparison of Stop Outcomes for White Pedestrians with Those for NonwhitePedestrians Who Are Similarly Situated to the Stopped White Pedestrians. . . . . . . . . . . . . . . 36Comparison of Stop Outcomes for Black Pedestrians with Those for Pedestrians ofOther Races Who Are Similarly Situated to the Stopped Black Pedestrians. . . . . . . . . . . . . . 38Hypothetical Example of a Hit-Rate Analysis. . . . . . . . . . . . . . . . . . . . . . . . . . . . . . . . . . . . . . . . . . . . . . . . . . 41Frisked or Searched Suspects Found Having Contraband or Weapons. . . . . . . . . . . . . . . . . . . . 42ix
SummaryIn 2006, the New York City Police Department (NYPD) was involved in a half-million encounters with pedestrians who were stopped because of suspected criminal involvement. Raw statistics for these encounters suggest large racial disparities—89 percent of the stops involvednonwhites. Fifty-three percent of the stops involved black suspects, 29 percent Hispanic, 11percent white, and 3 percent Asian, and race was unknown for the remaining 4 percent ofthe stops. Forty-five percent of black and Hispanic suspects were frisked, compared with 29percent of white suspects; yet, when frisked, white suspects were 70 percent likelier than blacksuspects to have had a weapon on them.These figures raise critical questions: first, whether they point to racial bias in police officers’ decisions to stop particular pedestrians, and, further, whether they indicate that officersare particularly intrusive when stopping nonwhites.Seeking answers, the NYPD turned to RAND to help it gain a clearer understandingof this issue and identify recommendations for addressing potential problems identified inthe analysis. To examine the issue, RAND researchers analyzed data on all street encountersbetween NYPD officers and pedestrians in 2006, more than 500,000 stops that officers documented in SQF report worksheets (NYPD Unified Form 250 or UF250; see Appendix D fora reproduction).RAND researchers conducted three types of analysis. First, we compared the racial distribution of stops to a variety of benchmarks. This process, commonly referred to as externalbenchmarking, attempts to construct what the racial distribution of the stopped pedestrianswould have been if officers’ stop decisions had been racially unbiased. Constructing valid external benchmarks is a difficult task, since it involves assessing the racial composition of thoseparticipating in criminal activity and the racial composition of those exposed to the patrollingofficers. Both the rates of criminal participation and police exposure are challenging to estimate. We completed analyses using several candidate benchmarks, each of which has strengthsand weaknesses for providing plausible external benchmarks. For example, residential censusdata—that is, the racial distribution of the general population in New York—possibly providean estimate of the racial distribution of those exposed to police but do not reflect rates of criminal participation. As a result, external benchmarks based on the census have been widely discredited. The racial distribution of arrestees has been proposed as a more reliable benchmark.A more promising external benchmark is the racial distribution of individuals identified incrime-suspect descriptions, though this benchmark also has serious pitfalls.Second, we compared each individual officer’s stopping patterns with a benchmark constructed from stops in similar circumstances made by other officers. This process, known asxi
xiiAnalysis of Racial Disparities in the New York City Police Department’s Stop, Question, and Frisk Practicesinternal benchmarking, avoids the primary limitations of external benchmarking and is usefulfor flagging officers who are substantially overstopping nonwhites compared to their peers.Third, we examined the outcomes of stops, assessing whether stopped white and nonwhite suspects have different rates of frisks, searches, uses of force, and arrests.The results from these three analyses are described in more detail in the chapters thatfollow.It is worth noting that most of the report focuses on comparisons between stops involving black, Hispanic, and white suspects. Concerns of racial bias also pertain to other racialgroups and ethnic subgroups, such as those from Asia. Asians represent 3 percent of all stops, arelatively small proportion. However, and unfortunately, statistical analysis is unreliable underthose circumstances.Results of External-Benchmarking AnalysisEvaluating racial disparities in pedestrian stops using external benchmarks is highly sensitive to the choice of benchmark. Therefore, analyses based on any of the external benchmarksdeveloped to date are questionable.Benchmarks based on crime-suspect descriptions may provide a good measure of the ratesof participation in certain types of crimes by race, but being a valid benchmark requires thatsuspects, regardless of race, are equally exposed to police officers.We found that black pedestrians were stopped at a rate that is 20 to 30 percent lowerthan their representation in crime-suspect descriptions. Hispanic pedestrians were stoppeddisproportionately more, by 5 to 10 percent, than their representation among crime-suspectdescriptions would predict.We provide comparisons with several other benchmarks to demonstrate the sensitivityof external benchmarking. The arrest benchmark has been featured prominently in previousanalyses of NYPD stop patterns (Spitzer, 1999; Gelman, Fagan, and Kiss, 2007). However,arrests may not accurately reflect the types of suspicious activity that officers might observe,arrests can occur far from where the crime occurred, and, since police make both the arrestsand the stops, the arrest benchmark is not independent of any biases that officers might have.Black pedestrians were stopped at nearly the same rate as their representation amongarrestees would suggest. Hispanic suspects appear to be stopped at a rate slightly higher (6 percent higher) than their representation among arrestees.The most widely used, but least reliable, benchmark is the residential census. Censusbenchmarks do not account for differential rates of crime participation by race or for differential exposure to the police. Comparisons to the residential census are not suitable for assessingracial bias.Black pedestrians were stopped at a rate that is 50 percent greater than their representation in the residential census. The stop rate for Hispanic pedestrians equaled their residentialcensus representation.
SummaryxiiiResults of Internal-Benchmarking AnalysisThis analysis compared the racial distribution of each officer’s stops to a benchmark racialdistribution constructed to match the officer’s stops on time, place, and several other stopfeatures.This analysis found the following: Five officers appear to have stopped substantially more black suspects than other officersdid when patrolling the same areas, at the same times, and with the same assignment.Nine officers stopped substantially fewer black suspects than expected. Ten officers appear to have stopped substantially more Hispanic suspects than other officers did when patrolling the same areas, at the same times, and with the same assignment.Four officers stopped substantially fewer Hispanic suspects than expected. Six of the 15 flagged officers are from the Queens South borough.To put these findings into perspective, the analysis flagged 0.5 percent of the 2,756NYPD officers most active in pedestrian-stop activity. Those 2,756 most active officers, about7 percent of the total number of officers, accounted for 54 percent of the total number of 2006stops. The remaining stops were made by another 15,855 officers, for whom an accurate internal benchmark could not be constructed, mostly because they conducted too few stops. Whilethe data suggest that only a small fraction of the officers most active in pedestrian stops may beoutliers, the stops made by the 15,855 that we could not analyze may still be of concern.Results of Outcome AnalysisIf there is race bias in the behavior of the 15,000-plus officers whose individual behavior wecould not analyze with the internal benchmark, it may still reveal itself in the patterns of stopoutcomes—that is, post-stop frisks, searches, uses of force, and arrests. Therefore we analyzedthe outcomes of police stops.Our analysis found the following: Officers frisked white suspects slightly less frequently than they did similarly situatednonwhites (29 percent of stops versus 33 percent of stops). Black suspects are slightlylikelier to have been frisked than white suspects stopped in circumstances similar to theblack suspects (46 percent versus 42 percent). While there is a gap, this difference is muchsmaller than what the aggregate statistics indicated. The rates of searches were nearly equal across racial groups, between 6 and 7 percent.However, in Staten Island, the rate of searching nonwhite suspects was significantlygreater than that of searching white suspects. White suspects were slightly likelier to be issued a summons than were similarly situatednonwhite suspects (5.7 percent versus 5.2 percent). On the other hand, arrest rates forwhite suspects were slightly lower than those for similarly situated nonwhites (4.8 percentversus 5.1 percent). Officers were slightly less likely to use force against white suspects than they were to useit against similarly situated nonwhites (15 percent versus 16 percent); however, in Queens,
xivAnalysis of Racial Disparities in the New York City Police Department’s Stop, Question, and Frisk PracticesBrooklyn North, and the Bronx, there was no evidence that use-of-force rates variedacross races. Officers recovered contraband (such as weapons, illegal drugs, or stolen property) in 6.4percent of the stops of white suspects. The contraband recovery rate was 5.7 percent forsimilarly situated black suspects and 5.4 percent for similarly situated Hispanic suspects.Overall, after adjustment for stop circumstances, we generally found small racial differences in the rates of frisk, search, use of force, and arrest. Nonwhites generally experiencedslightly more intrusive stops, in terms of having more frequent frisks and searches, than didsimilarly situated white suspects. While most racial differences in post-stop outcomes weresmall, for some outcomes in some boroughs, the gaps warrant a closer review. For example, theStaten Island borough stands out particularly with several large racial gaps in the frisk rates(20 percent of whites versus 29 percent of similarly situated blacks), search rates (5 percentfor whites versus 8 percent of similarly situated blacks), and use-of-force rates (10 percent forwhites and 14 percent for similarly situated blacks).The raw numbers on recovery rates for contraband indicated that frisked or searchedwhite suspects were much likelier to have contraband than were black suspects. However, afteraccounting for several important factors, the disparity reduces sharply. The recovery rate forfrisked or searched white suspects stopped in circumstances similar to those of black suspectswas slightly greater than it was for black suspects (6.4 percent versus 5.7 percent). When considering only recovery rates of weapons, we found no differences by race. For every 1,000 frisksof black suspects, officers recovered seven weapons, and, for every 1,000 frisks of similarlysituated white suspects, officers recovered eight weapons, a difference that is not statisticallysignificant.ConclusionsThe raw statistics cited in the first paragraph of this summary distort the magnitude and, attimes, the existence of racially biased policing. For example, we found that there are some legitimate factors that explain much of the difference between the frisk rate of black suspects (45percent) and the frisk rate of white suspects (29 percent). Some of those factors include policepolicies and practices that can legitimately differ by time, place, and reason for the stop. As aresult, the raw statistics, while easy to compute, often exaggerate racial disparities. Any racialdisparities in the data are cause for concern. However, accurately measuring the magnitude ofthe problem can help police management, elected officials, and community members decidebetween the need for incremental changes in policy, reporting, and oversight or sweeping organizational changes.Our results using more precise benchmarks do not eliminate the observed racial disparities. However, they do indicate that the disparities are much smaller than the raw statistics would suggest. This result does not absolve the NYPD of the need to monitor the issue,but it also implies that a large-scale restructuring of NYPD SQF policies and procedures isunwarranted.
SummaryxvRecommendationsOverall, we have six recommendations for NYPD to improve interactions between policeand pedestrians during stops and to improve the accuracy of data collected during pedestrianstops.Officers Should Clearly Explain to Pedestrians Why They Are Being StoppedIn 90 percent of the stops, the detained individual is neither arrested nor issued a summons.To mitigate the discomfort of such interactions and to bolster community trust, officers shouldexplain the reason for the stop, discuss specifically the suspect’s manner that generated the suspicion, and offer the contact information of a supervisor or appropriate complaint authority,so that the person stopped can convey any positive or negative comments about the interaction. While the latter suggestion might increase the number of official complaints, it mightalso reduce the number of unofficial complaints that would otherwise circulate in the suspect’ssocial network. For a trial period in select precincts, the NYPD could require that officersgive an information card to those stopped pedestrians who are neither arrested nor issued asummons. An evaluation of the program could identify the kinds of stops likeliest to result inpositive or negative feedback from the stopped pedestrians. Most important, ongoing communication and negotiation with the community about SQF activities are helpful in maintaininggood police-community relations.The NYPD Should Review the Boroughs with the Largest Racial Disparities in StopOutcomesFor most stop outcomes in most parts of the city, we found few, if any, racial differences in therates of frisk, search, arrest, and use of force. However, for some particular subsets of stops,there are racial disparities, and, in some boroughs for some outcomes, the disparities are f
credited. The racial distribution of arrestees has been proposed as a more reliable benchmark. A more promising external benchmark is the racial distribution of individuals identified in crime-suspect descriptions, though this benchmark also has serious pitfalls. Second, we compared each individual officer's stopping patterns with a benchmark .