Transcription
Darden Restaurants, Inc. (NYS:DRI)By Brittany A. Vicariwww.darden.com, (DRI)“Darden is a premier full-service restaurant company featuring a portfolio of category-leading brands that include OliveGarden, LongHorn Steakhouse, Bahama Breeze, Seasons 52, The Capital Grille, Eddie V’s and Yard House.”
Table of ContentsExecutive Summary . 3General Company Information . 4Vision Statement . 4Mission Statement . 4Exhibit 1: Organizational Chart . 6Exhibit 2: EFE Matrix . 8Exhibit 3: IFE Matrix . 10Exhibit 4: CPM . 12Exhibit 5: Financial Ratio Analysis . 13Company Financials . 13Comparison of Competitor Ratios . 14Exhibit 6: SWOT. 16Exhibit 7: SPACE Matrix . 17Exhibit 8: Domestic BCG Matrix . 20Exhibit 9: Domestic IE Matrix . 21Exhibit 10: International IE Matrix . 22Exhibit 11: Grand Strategy Matrix. 23Exhibit 12: Perceptual Maps . 24Exhibit 13: QSPM. 25Exhibit 14: Recommendations . 28Recommendation Notes: . 28Exhibit 15: Value of Firm Analysis . 30Exhibit 16: EPS/EBIT Analysis . 3150-50 Stock/Debt Split . 3220-80 Stock/Debt Split . 33Exhibit 17: Actual Financial Statements. 34Exhibit 18: Projected Financial Statements (over the next 3 years) . 35Notes to Projected Income Statement . 36Notes to Projected Balance Sheet . 36Exhibit 19: Financial Ratios (Historical vs. Projected) . 37
Executive SummaryDarden Restaurants is a casual dining restaurant that operates several brands in the national restaurant industry and isheadquartered in Orlando, FL. It has four reportable segments: Olive Garden, LongHorn Steakhouse, Fine Dining (whichincludes The Capital Grille and Eddie V's), and Other Business (which includes Yard House, Seasons 52, Bahama Breeze,consumer-packaged goods and franchise revenues). As of May 31, 2015, Darden Restaurants owned and operated 1,534restaurants through subsidiaries in the U.S. and Canada under the Olive Garden , LongHorn Steakhouse , The CapitalGrille , Yard House , Seasons 52 , Bahama Breeze , and Eddie V's Prime Seafood and Wildfish Seafood Grille (collectively Eddie V's) trademarks and also had 34 restaurants operated by independent third parties. Its maincompetitors in the casual dining restaurant industry are DineEquity, Inc. and Bloomin’ Brands, Inc.Darden Restaurant’s current and recommended vision statement, mission statement, and organizational charts arelisted in the beginning of the strategic plan. Furthermore, the main focus throughout this strategic plan was to analyzethe internal and external strengths, weaknesses, opportunities, and threats to Darden Restaurants and the restaurantindustry. This analysis allowed for me to see what Darden does well and not so well when compared to competitors andits own past historical data. Many matrices were involved in this analysis as illustrated in Exhibits 2-5. Once this analysiswas complete, many opportunities presented itself for Darden Restaurants to improve its strategies and overallstrategic plan. These potential strategies are further illustrated in the SWOT Analysis in Exhibit 6. These strategies werefurther analyzed as shown in Exhibits 7-13.After careful analysis and consideration, this plan presents 10 recommendations listed in Exhibit 14 for DardenRestaurants to implement over the next three years in order to improve its overall company and financial position in theindustry. These recommendations should be funded by a stock/debt split type of financing illustrated in Exhibit 16. Afterimplementing the recommendations listed, Darden Restaurants will experience financial growth, an increase of 351,546,100 in Net Income from 5/31/16 to 5/31/18, increased financial security, and enhanced financial ratios asfurther illustrated in Exhibits 17-19.
General Company InformationPrincipal Office1000 Darden Center DriveOrlando, FL 32837 USAWebsitewww.darden.comPhone407 245-4000Primary NAICS722110 : Full-Service RestaurantsAuditorKPMG LLPClosing Stock Price57.59 (as of 02/10/2016)Number of Employees10,000 (Approximate Full-Time as of05/31/2015)IncorporatedMarch 1968 , FL, United StatesCountryUnited StatesMergent Dividend AchieverNoExchange and TickerNYS : DRINumber of Shareholders37,176 (approx. record) (as of 06/30/2015)Primary SIC5812 : Eating placesAnnual MeetingIn SeptemberVision StatementCurrent:Non-existent.Revised:Darden Restaurants strives to become the restaurant industry leader nationwide by offering a variety of culinaryinnovations, an inviting atmosphere, and superior customer service in its category-leading restaurant brands.Mission StatementCurrent:Darden’s core purpose is "to nourish and delight everyone we serve." (Retrieved from FAQs on darden.com)Note: Various other statements were written under different sections of the website, but no specific missionstatement was stated.Revised:Our mission is to nourish and delight our diners of all ages (1) by providing superior dishes and customer servicein all of our full-service restaurants (2) located nationwide (3). With our portfolio of category-leading brands andtechnology (7), we are able to profitably grow (5) by providing a range of diners with an engaging atmosphere,many new culinary choices, and exceptional service (4) through the most important contributor to ourcustomers’ dining experience- our well-trained, friendly restaurant staff (9) whose main objective is to put
customers first (6). In addition to delivering our communities an outstanding dining experience, we strive to be agrowing contributor to our community through the Darden Foundation and our other grant programs that giveback millions of dollars to communities annually (8).
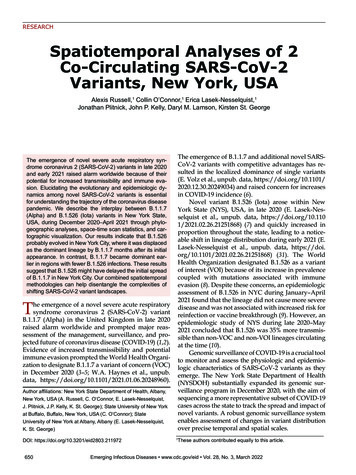
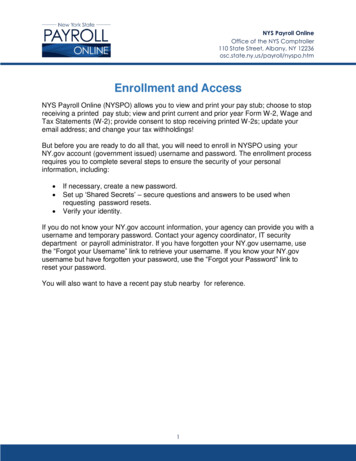
Exhibit 1: Organizational ChartCurrent:Chairperson &Board ofDirectorsPresident andChief ExecutiveOfficerSenior VP,GeneralCounsel &CorporateSecretarySenior VP,CDOSenior VP,CFOSenior VP,CorporateControllerSenior VP,CHROSenior GardenPresident,SpecialtyRestaurantGroup
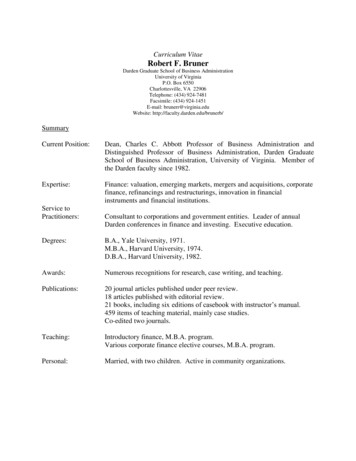
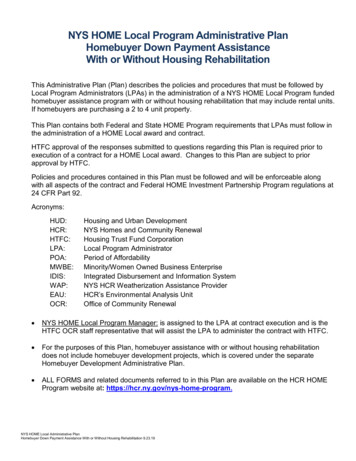
Recommended:Chairperson& Board ofDirectorsChiefExecutiveOfficerVP ofLegalAffairsCDOCFOSenior ternationalMarket,LonghornSteakhouse& OliveGardenPresident,Fine DiningPresident,OtherBusinessThis recommended organizational chart accomplishes the following:oooooThe CEO/President no longer has dual titles.The executive positions report directly to the CEO.A Chief Operating Officer position was established with presidents of divisions reporting to the COO.The divisional units are clear and organized based on an SBU organizational structure with geographicaldivisions.The divisional units are named based on the segments discussed in Darden’s SEC filings and othermatrices.
Exhibit 2: EFE MatrixOpportunities16Over the past 5 years, consumer spending has increased at an average annualrate of 2.2% and is expected to increase by 2.7% annually over the next 5years.Consumer confidence index has increased in industry, from 96.3 in December2015 to 98.1 in January 2016.Quick-service restaurants reflected price increases of 0.5% in the first quarterof 2014.0% income tax rate in Texas, Nevada, Alaska, Florida, South Dakota,Washington, and Wyoming.Individuals age 65 and older in the US will rise to 18.5% by 2025, and theseindividuals favor dining-in by a large margin over all other generations.Restaurants are generating 4x more catering revenue than retailers.7A strong dollar compared to Euro, with 1 equaling .92 Euros.8Among the 500 largest restaurant chains in the US, international unit growthwas 9% in 2013 while US growth was only 2.2%.Unemployment has decreased from 8% in the beginning of 2013 to 5.7% inthe beginning of 2015, resulting in higher consumer spending.Industry revenue forecasted to grow by an average annual rate of 2% fromnow until 2020.2345910Threats12345678910Consumers seek greater convenience at a lower price provided by quickservice and fast casual restaurants who have an average price of 5.30 and 7.40 respectively compared to an average of 13.66 for casual dining and 28.55 for fine dining.Healthy eating index is expected to increase over 2015 with a trend in healthyeating habits rising.According to the USDA, food inflation rose from 2.5% in 2013 toapproximately 3.5% in 2014 which has led to higher purchasing costs for thisindustry.Wage costs account for 32% of an average company's revenue in 2015 in thishighly labor intensive industry.The minimum wage increased from 8.25 to 9.00 in January 2016 and the 2.13 per hour tip wage is expected to increase.Catering services offered at competitors has led to a rise in competitorrevenues.Major competitor DineEquity Inc. has franchised approximately 99% of itslocations and has experienced a steady increase in revenues from franchising.The FDA requires restaurants as a part of a chain with 20 or more locations topost calorie information on menus.Darden Restaurants holds 6% of industry market share while largestcompetitor, DineEquity Inc. holds 7.5%.The Affordable Care Act will make firms with over 50 employees who workmore than 30 hours per week supply health insurance.Total EFE 10.0221.000.120.100.120.040.090.020.042.22
The above EFE matrix was constructed based on external factors that greatly influence Darden Restaurants, Inc. Forexample, the Opportunities and Threats with the highest weights represent those factors that influence the restaurantchain the most based on industry information gathered from research. The casual dining industry was analyzed todetermine these major economic, social, technological, governmental, and competitive trends. Darden Restaurants wasalso compared to two larger competitors, Bloomin’ Brands, Inc. and DineEquity Inc., in addition to the overall restaurantindustry. Per the above chart, an increase in consumer spending and consumer confidence, price changes, convenience,and healthy eating greatly influence the effectiveness of this industry. These external factors were used whendetermining the best recommendations suited for Darden Restaurant’s strategic plan.
Exhibit 3: IFE MatrixStrengths12345678910Darden offers a variety of prices ranging from around 10 to 25depending on the restaurant.A variety of menu options available in its 7 different brands and OliveGarden now offers catering delivery options.Darden maintained labor costs between 30.1% and 32.1% even withincreased inflation.From 2010-2013, US revenue increased by 1.5% due to acquisitions ofnew restaurants.Operating income increased from 643M in 2014 to 774M in 2015.Darden employs 150,000 employees, including hourly employees whotrain for about 63 hours and managers-in-training who take a 7-11week specialized training course, and prides itself on promoting withinto retain workforce.Darden has begun expanding overbroad with a recent contract to open13 restaurants under Olive Garden and Longhorn in Malaysia.Employee turnover rate is 25-30 points lower than industry average.A strong online presence with ability to Google all restaurants and upto-date website.Darden enhanced shareholder wealth by selling Red Lobster to GoldenGate Capital Inc. for 2.1 billion.Weaknesses12345Darden operates mainly full-service and specialty restaurants ratherthan fast, casual restaurants.US revenue decreased by 26.5% in fiscal year 2014 due to lowermarket share in the United States.Darden downsized and lost revenue from selling major restaurant, RedLobster, and plans no acquisitions in the near future.Current ratio decreased from 1.2 in 2014 to 0.9 in 2015.7Darden Restaurants holds 6% of industry market share while largestcompetitor holds 7.5%.Darden has little franchise opportunities compared to a large 99% ofits largest competitor being franchised.Olive Garden expansion is being halted at its current 822 restaurants.8Darden has a low international presence, mainly operating in the US.9Customers experience higher dining times here than at othercompetitors.Darden sources products from 1,500 different vendors in 10 differentcountries.610Total IFE edScore0.080.070.140.140.120.050.030.022.51
The above IFE Matrix was determined based on an analysis of Darden Restaurant’s own internal strengths andweaknesses based on research gathered determining what makes a casual dining restaurant successful in its industry.Much like the EFE Matrix, the statements or factors with the highest weights are most important to Darden’s successand are used when determining a strategic plan. In this case, Darden’s price ranges, variety of menu options, lack of fastdining opportunities, and decrease in revenue generated nationally all play a significant role in determining whatstrategies Darden should implement in the future. These factors were used when determining recommendations laterdiscussed.
Exhibit 4: CPMDardenRestaurantsCritical Success FactorsCustomer ServiceDineEquity, Inc.Bloomin' .1530.4520.3040.60Price Competitiveness0.1520.3040.6030.45Brand Variety0.1240.4820.2430.36Product Quality0.1230.3620.2440.48Market r Loyalty0.0730.2120.1440.28Store .1030.15Financial Profit0.0520.1030.1540.20Employee Dedication0.0440.1620.0830.12Top Management0.0240.0820.0430.06Totals1.00Convenience to Customers2.902.813.29The above CPM matrix was created and analyzed using industry and competitor information. This CPM determines themost important industry factors that lead to success for industry participants like Darden Restaurants. Per the abovechart, the factors with the highest weights, like Customer Service, Price Competitiveness, and Brand Variety are all verysignificant to a company’s success in the casual dining restaurant industry. Darden Restaurants and two of itscompetitors, DineEquity, Inc. and Bloomin’ Brands Inc., were compared and rated on these 12 critical success factors inorder to determine Darden’s place in the industry. Based on this matrix, we can see that Darden can improve upon itscustomer service, prices, product quality, market share, and convenience when compared to its competitors.
Exhibit 5: Financial Ratio AnalysisCompany FinancialsThe following charts were used to compare Darden’s most significant financial ratios based on the most recent and pastyears’ data. When comparing FY2014 to FY2015, Darden Restaurant’s financials are improving or remaining steadydespite the changes in the industry and selling off of an important brand, Red Lobster. For example, Darden’sprofitability ratios, Return on Assets and Return on Equity, have increased meaning that Darden has seen better returnsin FY2015 than in FY2014. Furthermore, Darden’s Quick Ratio rose from 0.11 in FY 2014 to 0.51 in FY 2015 meaning thatthe company has 0.51 of liquid assets available to cover every dollar of current liabilities. Although this ratio rose,Darden still needs to pay attention to the low number and improve this ratio. In addition, Darden’s Current Ratiodecreased meaning that the company now has fewer assets to pay off its current liabilities, possibly from its sell of oneof its major brands: Red Lobster. In the coming years, Darden would need to improve this ratio to remain a healthycompany. The long-term debt to equity ratio has decreased helping the company with its financial outlook. This meansthat the company has less debt and would be able to cover the debt with its equity.**Exchange rate used is that of the Year End reported dateProfitability RatiosROA % (Net)ROE % (Net)ROI % (Operating)EBITDA Margin %Calculated Tax Rate %Revenue per iquidity RatiosQuick RatioCurrent RatioNet Current Assets % TADebt ManagementLT Debt to EquityTotal Debt to EquityInterest 1.91Asset ManagementTotal Asset TurnoverReceivables TurnoverInventory TurnoverAccounts Payable TurnoverAccrued Expenses TurnoverProperty Plant & Equip TurnoverCash & Equivalents TurnoverPer ShareCash Flow per .3817.5130.7814.942.06108.0705/26/20137.38
Book Value per Share 18.4216.315.81Comparison of Competitor RatiosThe following charts were used in comparing significant ratios of Darden Restaurants to its competitors. All results arestated in US Dollars, and most recent comparisons are for FY2014, because FY2015 information for competitors isn’tavailable. DineEquity Inc. performed better than Darden Restaurants and Bloomin’ Brand in the liquidity ratiodepartment, while Darden Restaurants performed better when examining debt management.Company NameBloomin' Brands Inc.Darden Restaurants, Inc.DineEquity IncCurrent Ratio - 20140.711.221.32Company NameBloomin' Brands Inc.Darden Restaurants, Inc.DineEquity IncGross Margin % - 201467.6920.6057.27Company NameBloomin' Brands Inc.Darden Restaurants, Inc.DineEquity IncInventory Turnover - 201417.7818.03-Company NameBloomin' Brands Inc.Darden Restaurants, Inc.DineEquity IncInventory Turnover - 201316.8017.51-Company NameBloomin' Brands Inc.Darden Restaurants, Inc.DineEquity IncLT Debt to Equity - 20142.341.175.16Company NameBloomin' Brands Inc.Darden Restaurants, Inc.DineEquity IncLT Debt to Equity - 20132.941.244.33Current Ratio - 20130.650.541.17Gross Margin % - 201367.7022.1157.72Company NameBloomin' Brands Inc.Darden Restaurants, Inc.DineEquity IncNet Current Assets % TA - 2014(7.16)5.044.08Company NameBloomin' Brands Inc.Darden Restaurants, Inc.DineEquity IncNet Current Assets % TA - 2013(7.96)(9.39)1.97
Company NameBloomin' Brands Inc.Darden Restaurants, Inc.DineEquity IncOperating Margin % - 20144.324.9122.68Company NameBloomin' Brands Inc.Darden Restaurants, Inc.DineEquity IncOperating Margin % - 20135.467.5832.89Company NameBloomin' Brands Inc.Darden Restaurants, Inc.DineEquity IncQuick Ratio - 20140.350.110.80Quick Ratio - 20130.350.120.85Company NameBloomin' Brands Inc.Darden Restaurants, Inc.DineEquity IncROA % (Net) - 20142.784.091.50ROA % (Net) - 20136.626.412.99Company NameBloomin' Brands Inc.Darden Restaurants, Inc.DineEquity IncROE % (Net) - 201417.8413.6112.27ROE % (Net) - 201360.1621.1723.09Company NameBloomin' Brands Inc.Darden Restaurants, Inc.DineEquity IncTotal Asset Turnover - 20141.350.900.27Company NameBloomin' Brands Inc.Darden Restaurants, Inc.DineEquity IncTotal Asset Turnover - 20131.311.330.27Company NameBloomin' Brands Inc.Darden Restaurants, Inc.DineEquity IncTotal Debt to Equity - 20142.391.285.22Company NameBloomin' Brands Inc.Darden Restaurants, Inc.DineEquity IncTotal Debt to Equity - 20132.971.324.38Source: companyreports.php?compnumber 85159
Exhibit 6: SWOTSO Strategies1234Open 30 new Fine Dining or Other segment restaurants in theinternational market, specifically in Mexico or Euro acceptingcountries (S7, O7, O8)Increase menu prices by .05-1% to increase ticket sales (S1, O2,O3)Expand catering options to Longhorn Steakhouse (S2, O6)Enhance appeal to older generation by making websites moreuser friendly and paper mailing promotional ads with coupons bya weekly mailer or in weekly newspapers (S9, O5)ST Strategies1234Implement "healthy menu" insert at all restaurants with 10 newlighter dining options. (S2, T2, T8)Employ only part-time staff working on minimum wage plus tips,but also offer monthly employee contests to win prizes like giftcards to own restaurants/affiliates and offer managementopportunities. (S3, T4, T5, T10)Offer mandatory efficiency training for employees to lowerdining time by 3-5 minutes. (S6, S8, T1)Acquire/Buy other successful, similar restaurants to add tobrands, like those of Bloomin' Brands Inc. (S4, T9)WO Strategies1234Open new Olive Garden Express locations offering new quick,casual menu options. (W1, W9, O3)Expand international business by opening 30 new restaurants inLatin America and/or Europe (W8, O8)Appeal to older generation (larger market) by offering a SeniorDay with 15% off ticket (W1, O5)Acquire other large brand, Bloomin' Brands Inc., to increasemarket share, specifically its fine dining restaurants Bonefish Grilland Flemings Steakhouse. (W2, W5, O10)WT Strategies1234Decrease number of suppliers by half with the remaining halfoffering lowest supply costs. (W10, T3)Open 15 new Longhorn restaurants in Texas, Florida, SouthDakota, Wyoming, and Nevada. (W2, T9)Add additional seating (5-10 new tables) to each restaurant tolower wait times. (W9, T1)Offer domestic franchise opportunities for Olive Garden. (W6,T7)The above chart was constructed by analyzing both the EFE and IFE matrices for Darden Restaurants. After analyzingthese matrices, strategies were constructed that would best suit Darden Restaurants and improve its overall business inthe industry. These strategies are listed above with their corresponding factors from the matrices listed in parentheses.
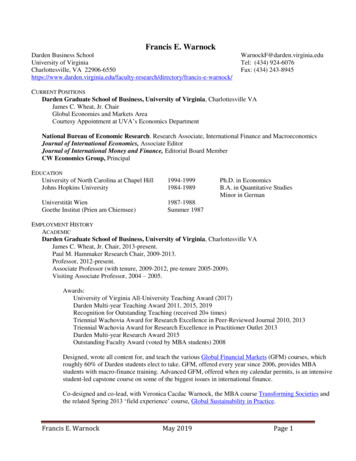
Exhibit 7: SPACE 3.0Bloomin'Brands Inc.Darden DineEquity 5.0Defensive-7.0CompetitiveSPExternal Analysis:Internal Analysis:Financial Position (FP)Stability Position (SP)Return on Investment (ROI)Leverage (long-term debt-to-equity)Liquidity (current ratio)Inventory TurnoverCash Flow per Share36545Financial Position (FP) Average4.6Internal Analysis:Competitive Position (CP) AverageStability Position (SP) Average-4-4-5-5-3-4.2External Analysis:Competitive Position (CP)Market ShareProduct QualityCustomer ServicePrice CompetitivenessBrand VarietyRate of InflationPrice Range of Competing ProductsPrice Elasticity of DemandCompetitive PressureBarriers to Entry into MarketIndustry Position (IP)-4-3-3-2-2-2.8Growth PotentialFinancial StabilityEase of Entry into MarketResource UtilizationProfit PotentialIndustry Position (IP) Average345433.8The SPACE matrix was determined by analyzing internal and external factors of Darden to that of its competitors. Thesefactors were determined based on industry information gathered from research. The analysis compared Darden to itscompetitors based on financial position, stability position, competitive position, and industry position. The ratings foreach company are listed in the table below. Based on this analysis and the above graphic, Darden’s industry position isslightly lower than that of DineEquity Inc. and its stability position is slightly lower than that of Bloomin’ Brands Inc.Therefore, Darden Restaurants has room for improvement in these areas.Darden Restaurants, Inc.RatingsFinancial Position (FP)Return on Investment (ROI)3Leverage (long-term debt-to-equity)6Liquidity (current ratio)5
Inventory Turnover4Cash Flow per Share5Industry Position (IP)Growth Potential3Financial Stability4Ease of Entry into Market5Resource Utilization4Profit Potential3Competitive Position (CP)Market Share-4Product Quality-3Customer Service-3Price Competitiveness-2Brand Variety-2Stability Position (SP)Rate of Inflation-4Price Range of Competing Products-4Price Elasticity of Demand-5Competitive Pressure-5Barriers to Entry into Market-3Your firm's X-axisYour firm's Y-axis1.00.4Estimated FPEstimated IPEstimated CPEstimated SP55-2-4Competitor 1's X-axisCompetitor 1's Y-axis31Estimated FPEstimated IPEstimated CPEstimated SP63-3-4DineEquity Inc.Bloomin' Brands Inc.
Competitor 2's X-axisCompetitor 2's Y-axis02
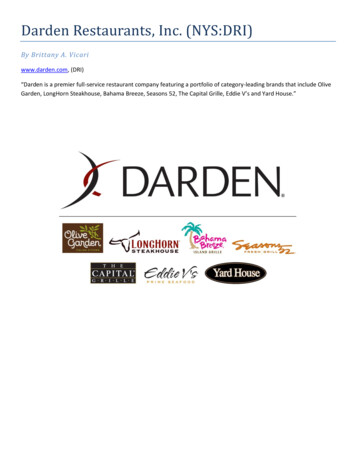
Exhibit 8: Domestic BCG MatrixRelative Market Share PositionHigh 1.0Low 0.0StarsIndustry Sales Growth RateHigh 0.20Question MarksOther BusinessOlive GardenLonghornSteakhouseFine DiningLow -0.20Cash CowsDogsNote: Circles were determined based on the number of domestic restaurants for each segment. Darden’s divisions (orsegments) were compared to other similar divisions in the industry. For example, the top firm for the Olive Gardendivision was compared to itself as it was the firm with the most similar type of restaurants, Longhorn Steakhouse wascompared to Outback Steakhouse of Bloomin’ Brands, Fine Dining was compared to the fine dining segment of Bloomin’Brands consisting of Bonefish Grill and Fleming’s Steakhouse, and lastly the Other segment was compared to other typesof restaurants owned by DineEquity Inc. including Applebee’s and IHOP. (See data table below)Division Namesfor DardenRestaurantsOlive GardenLonghornSteakhouseFine DiningOther BusinessNumber ofdomesticrestaurants forDarden843480Number ofdomesticrestaurants forTop Firm843753Division MarketGrowth RateRelative MarketShare .27
Exhibit 9: Domestic IE MatrixTHE IFE TOTAL WEIGHTED SCORESStrong4.0Weak1.0THE EFE WEIGHTED SCORESHigh4.0Olive GardenLongHornSteakhouseOther BusinessDardenRestaurantsFine DiningLow1.0Note: The bubble sizes are based on the same information listed in the data table for the Domestic BCG Matrix. Theestimated ratings are listed in the table below.Name of DivisionOlive GardenLongHorn SteakhouseFine DiningOther BusinessEstimated IFE Score32.752.52.5Estimated EFE Score32.7522.5
Exhibit 10: International IE MatrixTHE IFE TOTAL WEIGHTED SCORESStron
more than 30 hours per week supply health insurance. 0.02 2 0.04 Total EFE Score 1.00 2.22 . The above EFE matrix was constructed based on external factors that greatly influence Darden Restaurants, Inc. For example, the Opportunities and Threats with the highest weights represent those factors that influence the restaurant chain the most based .