Transcription
2021COL InvestorPresentation1
Company Overview2Established andlicensed by the SEC in1999The leading and fastestgrowing online stockbrokerin the PhilippinesFocused on tappingthe underserved retailinvestor base in thestock marketFounder (Edward K. Lee)retains a 21.7% stakeand actively managesthe Company
21.7%24.3%Edward K. LeeOutstanding Shares4.76 BilFree Float1.16 BilMarket Cap*Public*As of end 202114.9%Daiwa Securities Group25.2%Other Directors & Officer13.9%Alexander C. Yu3Php19.8 Bil
BusinessObjectiveTo be the preferred source of financialservices, a trusted provider of guidance andinvestment and a strong organizationcommitted to delivering great value to itscustomers.Our goal is to be Champion of the Filipino Investor4
COL Milestones1999Licensed by the SECto conduct businessas a broker andseller of securitiesin the Philippines2000-2001Began operating theCOL PH onlinetrading platformCitisecOnline HK Ltd.(COL HK) became atrading participant ofthe HK StockExchangeLaunched the COL HKplatform52006Listed in the PSE atPhp0.136/sh2008Launched the COLEasy InvestmentProgram (EIP)2010Launched the fullservice agency andadvisory team calledthe COL PrivateClients Group (PCG)
COL Milestones2012Officially changedcorporate name toCOL FinancialGroup Inc.62014Granted a MutualFund DistributorLicense by the SEC20152017Launched COL FundSource - the first fundsupermarket in thecountryJapan’s DaiwaSecurities Group, Inc.acquired a 14.9%stake in the company
The Biggest Philippine Based Stockbroker2021 Rank7Broker Name2021 Value Turnover (Php Bil)% of Total381.68.61COL Financial Group, Inc.2CLSA Philippines Inc216.36.53UBS Securities Philippines Inc198.26.24BDO Securities Corp197.66.25Mandarin Securities Corp131.65.86Credit Suisse Securities (Phil) Inc129.24.17BPI Securities Corp127.64.18First Metro Sec. Brgke. Corp124.73.89J.P. Morgan Securities Philippines Inc117.83.710Papa Securities Corp107.93.6Source: PSE
The Biggest Philippine Based StockbrokerTotal Accounts (as of 2020)69%Others8Source: PSE31%COLTotal Online Accounts (as of 2020)53%Others47%COL
Revenue Breakdown 2021Bulk of RevenuesGenerated fromCommissions and InterestCommissions from both Philippines and HKaccount for 79.7% of revenues.Interest income from margin loans and cashplacements account for 14.3% of revenues.Trailer fees from the distribution of mutualfunds account for 1.7% of revenues.94.2%Others1.7%Trailer Fees14.3% Interest79.7%Commissions
Key Operating HighlightsPositives1. Record revenues and profits2. Maintained rank as the country’snumber one stockbroker10Negatives1. Low interest rates hurt interestincome
Pro Forma Consolidated Income Statement (Php Mil)Change2021 Net Income 38% Y/Y2021 net income jumped by 37.7% to a recordPhp581.5 Mil, exceeding the pre-pandemic peakof Php512.7 Mil registered in 2018.Pro forma consolidated revenues were up 19.8%to Php1.3 Bil, also a record high. Growth was ledby the significant jump in commissions, trailerfees, and the booking of Php53.8 Mil in otherincome.Operating profits were up by a faster 31.8% toPhp759.2 Mil as operating expenses increased byonly 5.5%.Profits also benefited from the reduction ineffective tax rate from 26.7% to 23.4%, largely dueto the passage of the CREATE 27.6%Interest246.4182.1(64.4)-26.1%Trailer Fees17.321.54.224.5%Other mmission expenses27.736.38.631.0%Personnel costs201.9231.129.314.5%Professional fees52.054.62.64.9%Stock exch. dues & ntals & -4.9%Advertising & 9%484.6511.226.65.5%Pre-Tax 422.2581.5159.337.7%IncomeTotalExpensesTotalNet Income
Pro Forma Revenue Breakdown (Php Mil)Most Revenue Items H-Self-directedPH- Agency & advisoryHK & .1%39.957.317.443.7%206.6124.7(81.8)-39.6%Other income grew significantly from Php3.1 Mil toPhp53.8 Mil as COL booked a Php52.2 Mil gain from thesale of financial assets.Trailer 71,270.4209.719.8%Trailer fees rose by 24.5% due to an increase in assetsunder administration.Revenue Share74.8%79.7%Self-directed (incl HK)89.0%89.6%Agency & ents83.8%68.5%1.6%1.7%Revenues grew by 19.8% led by the significant increasein commissions and other income.Commission revenues increased 27.6% to Php1.0 Bil, ascommissions from both self-directed clients and theagency and advisory group improved by 28.9% and28.1% respectively.Interest income fell by 26.1%, largely due to the 39.6%decline in interest income from placements. Yields fellsignificantly due to the BSP’s loose monetary policy andbanks’ ample liquidity. Lower interest income fromplacements was partly offset by the 42.7% increase ininterest income from margin loans.12ChangeRevenue BreakdownTotal RevenuesCommissionInterestTrailer Fees
Pro Forma Revenue Breakdown (Php Mil)Most Revenue Items UpSelf-directed clients continued to account for thelion’s share of total commission revenues at 89.6%.Core commission revenues and trailer feesaccounted for 82.1% of total revenues, up from68.1% during the same period last 9.127.6%PH-Self-directedPH- Agency & advisoryHK & .1%39.957.317.443.7%206.6124.7(81.8)-39.6%Trailer 71,270.4209.719.8%74.8%79.7%Self-directed (incl HK)89.0%89.6%Agency & ents83.8%68.5%1.6%1.7%Revenue BreakdownTotal RevenuesRevenue ShareCommissionInterestTrailer Fees13
Pro Forma Breakdown of Expenses (Php Mil)ChangeManageable FixedExpensesOperating expenses increased by 5.5%, largely driven bythe 18.9% increase in trading related expenses.2020Fixed operating expenses were up slightly by 3.5% toPhp438.1 Mil, as higher personnel costs, professionalfees and communication expenses were offset by lowerrentals & utilities, depreciation, advertising &marketing, and other expenses.15Amount%Trading Related ExpensesCommission expenses27.736.38.631.0%Agency & Advisory25.135.09.9-60.4%CROs & Others2.61.3-1.3-151.4%Stock exch. dues & fees33.836.83.19.0%61.573.111.618.9%TotalTrading related expenses rose due to higher tradingactivity.2021Fixed Operating ExpensesPersonnel costs201.9231.129.314.5%Professional ntals & .9%Advertising & 423.1438.114.93.5%Total Expenses484.6511.226.65.5%
ROAE Jumped to 29.6%Selected Financial Ratios2020ROAE improved from 29.6% to 23.6%.The improvement in profitability was driven by anincrease in margins and higher asset turnover.Margins improved due to the strong growth inrevenues, and the highly leveraged nature of thestockbrokerage business.Asset turnover increased due to the higher tradingactivity of clients, partly offset by the lower yields oncash placements.162021Operating Profit Margin54.3%59.8%EBITDA Margin61.5%64.6%Net Margin39.8%45.8%Asset Turnover8.9%9.5%7.56.223.6%29.6%Asset/EquityROAE
Comparative Performance (COL vs. PSE)ChangeStill Number 1COL’s average daily turnover grew strongly by26.1% to Php1.5 Bil in 2021, outpacing the22.5% growth in the PSE’s average dailyturnover.Coupled with the growing share of localinvestors, COL’s market share in terms of valueturnover improved to 8.5% for the wholemarket from 8.3% in 2020. This allowed COL tomaintain its rank as the number 1 broker interms of value turnover in the PSE for thesecond year in a row.2020Amount%PSE Ave. Daily T/O (PhpMil)7,348.2 9,002.11,653.922.5%COL Ave. Daily T/O (PhpMil)1,219.9 1,538.6318.726.1%COL Market Share (Total)8.3%8.5%COL Market Share (Local)15.6%13.2%11No. of Transactions - PSE ('000)54,07657,4313,354.56.2%No. of Transactions - COL ('000)12,48513,221736.15.9%COL Market Share23.1%23.0%11PSE RankingPSE Ranking172021
Strong Balance SheetCash & cash equivalents decreased by 70.0% to Php1.7Bil. This was largely due to the placement of morefunds in investment securities to earn higher yields.Note that investment securities at amortized costincreased by 52.1% to Php9.3 Bil while HTMinvestments increased by 66.6% to Php500.2 Mil.Moreover, clients deployed a larger portion of theirportfolio in the market compared to end 2021. Thiswas also the main reason for the 7.9% drop in tradepayables to Php10.6 Bil.Trade receivables fell by 15.1% to Php958.8 Mil largelydue to the drop in receivables from the clearing houseas selling transactions as of end 2021 were much lesscompared to end 2020.Stockholders’ equity increased by 14.8% to Php2.1 Bildue to the booking of Php581.5 Mil in profits, lessPhp309.4 Mil in cash dividends.BVPS increased to Php0.044/sh.18Pro Forma Consolidated Balance Sheet (Php Mil)Change12/31/2012/31/21Amount%Cash & cash equivalents5,782.41,733.5-4,048.9-70.0%Trade receivables1,129.9958.8-171.1-15.1%Inv’t sec at amortized cost6,163.09,374.33,211.252.1%Other current assets80.3232.8152.5190.0%HTM investments300.2500.2200.066.6%PPE – netOther non-currentassets – 5.2%Total AssetsTrade payables13,695.1 12,980.811,500.910,590.2-910.7-7.9%Other current liabilities271.0185.6-85.4-31.5%Non-current liabilities94.5106.111.712.4%Total Liabilities11,866.310,881.9-984.4-8.3%Total Stockholders’ %Total Liabilities andStockholder’s EquityBVPS13,695.1 12,980.80.0380.044
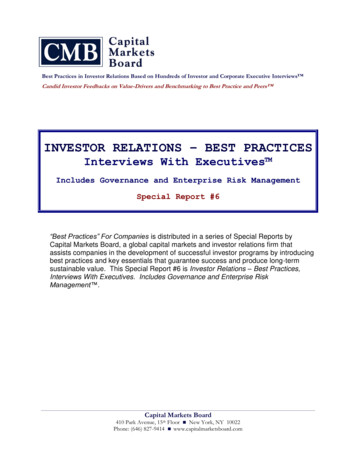
Client Base292,401COL’s client base grew by 11.9% Y/Y to489,154 as of end 2021.247,609489,154437,048SignificantCustomer Growth332,098 11.9%Average monthly additions during the past12 months reached 4,342.2017192018201920202021
Client Equity (Php Mil)72,673201720182019112,55672,398Client equity was up 4.9% Y/Y to Php112.6 Bil asof end 2021.73,102Client Equity up largelyon Higher Deposits107,346 4.8%20202021Net new cash inflows from retail clients reachedPhp7.7 Bil during the past twelve months andwas responsible for the increase in client equityas prices of local stocks were flattish Y/Y.20
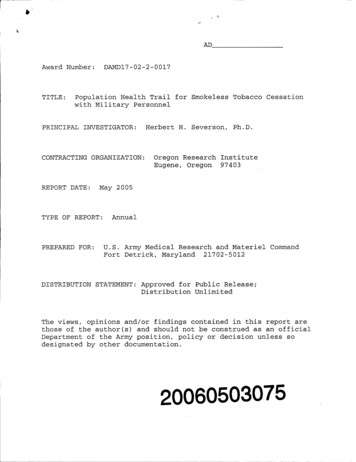
Ave Daily Margin Loans (Php Mil)719536617Average daily margin loans increased by 38.7%to Php719 Mil Y/Y.As of end 2021, the total number of approvedmargin accounts was 1,226, higher by 1.4%compared to the same period last year.518Margin Loans Up822 38.7%Only 32.1% of approved margin accounts utilizedtheir margin lines. In terms of value of margingranted, 13.0% was utilized during the period inreview.2017212018201920202021
2021 Net Sales (in Php Mil, Acc to Type of Fund)COL Accounted for3.7% ofIndustry EquityFund SalesNet SalesIndustryCOL% ShareMoney ed-397.115.6-3.9%Equity fund4,820.3178.63.7%Feeder fund*4,804.375.21.6%Total*2H21 only2258,457.6 247.40.4%
3Q214Q21Average AUA UpTrailer fees up due to increase inaverage AUA on a Y/Y 43,274.63,483.63,529.53,742.63,874.3Average AUA(Non-Money Market Funds Only, in Php Mil)Non-Money Market MF Ave AUASource: PIFA, COL estimates
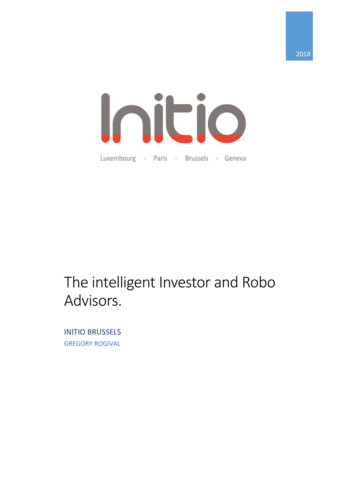
06912.4%12.3%12.0%11.6%MF 07,5263.4%20,000.05,244Growing Number, but lower Percentageof Clients Owned MFs% of Total Clients16.0%14.0%12.0%10.0%8.0%6.0%4.0%2.0%0.0%
0,000.042,91339,88038,06936,34912.3%12.0%11.6%MF 3.4%20,000.05,244Growing Number, but Lower Percentage of Clients Own MFs% of Total RCE: COL ESTIMATES25
DisclaimerThis presentation was prepared solely and exclusively for discussion purposes. This presentation and/or any part thereofmay not be reproduced, disclosed or used without the prior written consent of COL Financial (the “Company”).This presentation, as well as discussions arising therefrom, may contain statements relating to future expectations and/orprojections of the Company by its management team, with respect to the Company. These statements are: (i) presented onthe basis of current assumptions which the Company’s management team believes to be reasonable and presumed correctbased on available data at the time these were made, (ii) based on assumptions regarding the Company’s present andfuture business strategies, and the environment in which it will operate in the future, (iii) a reflection of our current viewswith respect to future events and not a guarantee of future performance, and (iv) subject to certain factors which may causesome or all of the assumptions not to occur or cause actual results to diverge significantly from those projected. Any and allforward looking statements made by the Company or any persons acting on its behalf are deemed qualified in their entiretyby these cautionary statements .This presentation is solely for informational purposes and should in no way be construed as a solicitation or an offer to buyor sell securities or related financial instruments of the Company.26
COL PH online trading platform CitisecOnline HK Ltd. (COL HK) became a trading participant of the HK Stock Exchange Launched the COL HK platform 2000-2001 Listed in the PSE at . 3 UBS Securities Philippines Inc 198.2 6.2 4 BDO Securities Corp 197.6 6.2 5 Mandarin Securities Corp 131.6 5.8 6 Credit Suisse Securities (Phil) Inc 129.2 4.1 .