Transcription
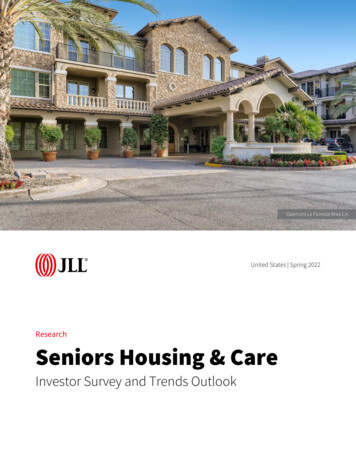
Oakmont La Floresta Brea CAUnited States Spring 2022ResearchSeniors Housing & CareInvestor Survey and Trends Outlook
Fountaingrove LodgeReporthighlightsCapital markets Interest in Seniors Housing swells as investors lookto alternative assets for growth and resiliency. Q1 2021 saw an increase in Seniors Housing andnursing care transaction volume for the firstquarter since the onset of the COVID-19 pandemic,and it was up 61% in Q4 2021. Capitalization-rate compression and priceincreases are expected with rising costs in SeniorsHousing. Rising interest rates and inflation remain top ofmind for many investors.Market fundamentals Market fundamentals have bounced back asrestrictions lessen and demand tailwindspersevere. Seniors Housing occupancy rates have reboundedfrom the lowest points seen due to the disruptionfrom the pandemic. The pace of rent growth in Seniors Housingaccelerated through 2021 and is expected tocontinue in 2022. Primary and Sun Belt markets are experiencing thehighest concentration of new construction.Investor sentiment Market participants grow more bullish on SeniorsHousing and Care investment, with 76% ofrespondents indicating that they intend toincrease their exposure to the sector in 2022. 80% of respondents indicated that we haveendured the worst of the pandemic and expectmarket fundamentals to improve. 11% ofrespondents say it’s still too early to tell, whileanother 9% expect to see a decline in propertyvaluations and an increase in loan delinquenciesover the next 12 months. Most respondents indicated they expect SeniorsHousing capitalization rates to remain the samethroughout 2022, at 47%. Another 38% expectthem to decrease.2 Seniors Housing & Care Spring 2022 Investor Survey and Trends OutlookReport highlights2Capital markets3Property markets7Market outlook13JLL Valuation Index14Investor survey results15Want more information?20 2022 Jones Lang LaSalle IP, Inc. All rights reserved.
Capital marketsTransaction volume picks up two years afterinitial industry disruptionsAt the onset of the pandemic and through 2020,the Seniors Housing and nursing care sectorrecorded its weakest transaction volume since2012. Investment volume was down 43% on a yearover-year basis in Q4 2020. By the end of 2021,however, this trend reversed substantially as thesector recovered from the depth of the pandemicinduced pullback in investor demand. Q1 2021 wasthe first quarter since the onset of the COVID-19pandemic to yield an increase in Seniors Housingand nursing care transaction volume quarter-overquarter at 10.6 billion total, indicating a return ofinvestor interest.By 2021 year-end, volume had bounced back, up61% from Q1, to levels last seen at the close of 2019when the sector’s performance was quite strong.Seniors Housing assets in particular marked a strongrebound; nursing care investment volumes, whichcontinue to be beset by more operationaldifficulties, saw a lesser rebound of 24% on a yearover-year basis. 20100%90% 2580%70%60% 1550%40% 1030%% Portfolio Volume(Billions) 30Transaction VolumeRolling four-quarter transaction volume20% 510%Seniors HousingNursing 134Q20113Q20102Q20090%1Q2008 0% PortfolioSource: National Investment Center for the Seniors Housing & Care Industry, NIC MAP Q4 20213 Seniors Housing & Care Spring 2022 Investor Survey and Trends Outlook 2022 Jones Lang LaSalle IP, Inc. All rights reserved.
Aegis Bellvue Overlake - Vue Sky LoungePrice per unit trends lagging multihousing,but growth is emerging at a steady paceAs a point of comparison, multihousing pricingaccelerated through 2021, reaching an all-time highof 234,800 per unit in Q4 (on a trailing four-quarterbasis), up 27% from year-end 2020. Multihousingcapitalization rates continued in the pre-pandemicdownward trend, reaching an all-time low of 4.59%.Seniors Housing and Care experienced increasedoperating costs during the pandemic, mostlyattributable to PPE purchases and increased staffingcosts. Operators are seeking to pass through higherthan typical rent increases in 2022 and beyond torecapture some of the erosion in profit margins thathas occurred. Further, investors are becoming morewilling to underwrite occupancy and NOI recovery,leading to increased valuations for many SeniorsHousing assets.10.0%9.0% 2108.0% 1607.0%6.0% 1105.0%Multifamily Price per UnitSeniors Housing Price per UnitSeniors Housing Cap RateMultifamily Cap 134Q20113Q20104.0%2Q2009 601Q2008Price per Unit (Thousands)Rolling four-quarters price per unit vs. cap rates 260Capitalization RatesAt year-end 2021, the average Seniors Housing priceper unit was just under 160,000, up 9% from itstrough in Q1 2021 but still below the pre-pandemicpeak of roughly 180,000 per unit. Averagecapitalization rates for Seniors Housing transactionsremained stable at 6.4% from Q2 through Q4 2021, a50-basis-point increase from the beginning of 2020.Similarly, nursing home unit pricing is recoveringfrom the pandemic dip, albeit at a choppier pace.Sources: National Investment Center for the Seniors Housing & Care Industry, NIC MAP Q4 2021; Real Capital Analytics; JLL Research4 Seniors Housing & Care Spring 2022 Investor Survey and Trends Outlook 2022 Jones Lang LaSalle IP, Inc. All rights reserved.
Investors seek alternative assets forgrowth outside of traditional sectorsTransaction volume in alternative sectors increased65% in 2021 from the year prior. In the past 12months, alternative REITs outperformed othersectors by producing average returns of 42%, ascompared to 20% and 17% for all REITs and nonalternatives, respectively.withstood cyclical challenges, supported bystrong demographic tailwinds and governmentfunding to support demand. The pandemic turnedthis resilience on its head, but demand has sinceshown improvement on a quarterly basis, withoccupancy continuing its steady climb back to prepandemic levels. The long-term opportunity is quiteattractive for institutional capital looking to diversifytheir portfolios or hedge against oversoldinvestment classes.As a subset of alternative assets, Seniors Housinginvestor activity is set to flourish. The scale of thesector continues to grow and has depth in everymarket across the U.S. The sector has traditionallyAlternative REITs outperformingAlternative sectors capturing growing share oftransaction volume over the prior cycleNAREIT sector average returns(Feb. 2020–Jan. 2022)42%20%17%All 201920202021AlternativesAlternatives volume ( B)Share of total volume 70.0 60.0 50.0 40.0 30.0 20.0 10.0 -Non-AlternativesDry powder for commercial real estate investment continues to accelerate to all-time highs, reaching 243.7B in February 2022Value AddCoreFund of Funds(Billions) 300 200OpportunisticCore PlusCo-InvestmentDebtDistressed -08Jul-07Dec-06 0Sources: JLL Research, Preqin. Data is for all real estate types for North America–focused funds, Q1 20215 Seniors Housing & Care Spring 2022 Investor Survey and Trends Outlook 2022 Jones Lang LaSalle IP, Inc. All rights reserved.
Rising interest rates and inflation aretop of mind for many investorsHistorically speaking, though, the relationship between benchmark yields or Fed rate-hike cycles andcommercial real estate yields is relatively weak. Strong CRE fundamentals and the sheer weight of uninvestedcapital targeting commercial real estate coupled with strong U.S. macro fundamentals are driving pricing intoday’s market. These factors are expected to serve as countervailing forces against any upward pressure oncap rates driven by inflation and/or rising benchmark yields.Federal funds rate vs. core CRE yields12.00%Average Core CRE Yields10.00%Fed Funds 99720002003200620092012201520182021Seniors Housing cap-rate spreads over benchmark yields have normalized since the onset of the COVID-19pandemic and ended the year near historical averages. The added relative yield coupled with improvingSeniors Housing fundamentals may prove attractive to commercial real estate investors seeking higher returnsas inflation and Fed actions place upward pressure on Treasury yields in the months ahead.Relationship between capitalization rates and the 10-year Treasury10yr UST & Cap Rate10%10yr USTSeniors Housing Quarterly SpreadSeniors Housing Cap RatesSeniors Housing Average 192Q20204Q20202Q20214Q20210%Spread (bps)12%Sources: National Investment Center for the Seniors Housing & Care Industry, NIC MAP Q4 2021; Real Capital Analytics; JLL Research6 Seniors Housing & Care Spring 2022 Investor Survey and Trends Outlook 2022 Jones Lang LaSalle IP, Inc. All rights reserved.
Property marketsOccupancy continued to recoverthroughout 2021The COVID-19 pandemic had a significant impact on Seniors Housing, with stabilized occupancy falling torecord lows at the height of the crisis. Throughout 2021, however, Seniors Housing property marketfundamentals started to recover. Stabilized occupancy rates began to rise by midyear 2021, closing the year at82.8% in primary market locations and 83.7% in secondary market locations.With the 75 population growing at an increasing rate and the amount of new construction down significantly,it is expected that occupancy rates will continue to improve through 2022 and beyond.Seniors Housing inventory change vs. absorption for primary Q20104Q20091Q2009-15,0003Q2013AbsorptionInventory GrowthStabilized Occupancy-5,000Occupancy90%4Q2012Number of units15,000Seniors Housing inventory change vs. absorption for secondary rptionInventory GrowthStabilized Occupancy-5,0004Q2012Number of units10,000Sources: JLL Research; National Investment Center for the Seniors Housing & Care Industry, NIC MAP Q1 2021Fountaingrove Lodge7 Seniors Housing & Care Spring 2022 Investor Survey and Trends Outlook 2022 Jones Lang LaSalle IP, Inc. All rights reserved.
As demonstrated in primary market locations, Seniors Housing occupancy has rebounded from the troughs hitover the past eight quarters. If we look at the lowest recorded occupancy rates of the primary Seniors Housingmarkets since the onset of the pandemic, each market closed out 2021 at a higher occupancy level. There isstill a way to go until they achieve their occupancy peaks from before the unexpected market disturbances;however, this is a positive indication that the sector has endured the worst of the backlash from the pandemicand fundamentals will continue to improve.Primary Seniors living markets occupancy range throughout the pandemicAll markets are up from their lowest levels over the past eight quarters93%Current - 4Q202188%83%78%73%Source: NIC Map Data ServicesSeniors Housing rent has continuously increased over time; however, the pace of rent growth, which had beenpreviously declining, picked up in 2021. By Q4 2021, primary and secondary markets rents were up 2.4% on anannual basis, as compared to 1.6% at the beginning of 2021.Rent in Seniors living facilities has been steadily increasing, with annual rent growth picking up in 2021Seniors living rent 4,4004.0%3.5% 4,2003.0% 4,0002.5% 3,8002.0% 3,6001.5%1.0% 14Q2021 3,200Average RentAnnual Rent GrowthSource: NIC Map Data Services8 Seniors Housing & Care Spring 2022 Investor Survey and Trends Outlook 2022 Jones Lang LaSalle IP, Inc. All rights reserved.
Aegis Living Kirkland WaterfrontConstruction starts accelerate in primary marketsConstruction starts began to pick back up in primary market locations in 2021 after previously tapering off dueto obstacles related to the COVID-19 pandemic, whereas secondary market locations are still lagging.Seniors Housing construction slowed significantly at the onset of the pandemic, governing risk of oversupply.As a percentage of existing inventory, construction was 4.8% at the end of 2021 in primary and secondarymarkets, down from peak levels of 7% at the end of 2019.Construction starts for primary market locationsIndependent Living30,000Assisted LivingMemory Q22010Q42010Q22009Q42009Q22008Q40Construction starts for secondary market locations20,000Independent LivingAssisted LivingMemory 010Q42010Q22009Q42009Q22008Q40Source: National Investment Center for the Seniors Housing & Care Industry, NIC MAP Q4 20219 Seniors Housing & Care Spring 2022 Investor Survey and Trends Outlook 2022 Jones Lang LaSalle IP, Inc. All rights reserved.
Current construction activity is highly concentrated in Sun Belt markets, reflecting an acceleration in migrationpatterns among all age groups but especially those in the 55 cohort. Looking at construction as a percentageof all inventory, eight of the top 10 markets are in the Sun Belt region. Seniors are seeking more affordable, yetstill dynamic, communities in which to retire, and this has prompted developers to follow suit.#1 Austin, TX#2 Jacksonville, FL#3 Memphis, TN#4 Miami, FL#5 Richmond, VA#6 Atlanta, GA#7 Washington, DC#8 Houston, TX#9 Charleston, SC#10 Sarasota, FL#11 Louisville, KY#12 Melbourne, FL#13 Omaha, NE#14 Orlando, FL#15 Nashville, TN#16 Bridgeport, CT#17 Raleigh, NC#18 Columbus, OH#19 Phoenix, AZ#20 Oklahoma City, OK#21 Portland, OR#22 Los Angeles, CA#23 Fort Myers, FL#24 New York, NY#25 New Orleans, .53%6.37%6.10%6.03%6.00%6.00%5.90%Property location concentration25Atlanta, GANew York, NY20Minneapolis, MNProperties under constructionSeniors living construction landscape remainshyper-concentrated in the Sun Belt2021 average construction vs. inventoryLos Angeles, CADetroit, MI15Chicago, ILDallas, TXBoston, MA10Philadelphia, PASeattle, WA50150200250300350Existing propertiesSource: NIC Map Data ServicesDiscovery Village at Sandhill10 Seniors Housing & Care Spring 2022 Investor Survey and Trends Outlook 2022 Jones Lang LaSalle IP, Inc. All rights reserved.
Claiborne at West LakeLong-term demand tailwinds: health, longevity,and quality of life in high demandDespite the distress the Seniors Housing sectorexperienced due to the pandemic, long-termdemand remains solid, stemming from a robustaging population. 30% of the population is made upof individuals 55 years old and older. That 30%accounts for 56% of all healthcare expenditures inthe U.S. today. National healthcare expenditures areforecasted to grow an additional 31% by 2025; the55 population will increase by 6.4% during thesame period. Healthcare expenditures are projectedto account for 19% of U.S. GDP by 2025, meaningthat an estimated 11% of total GDP will beattributable to spending on healthcare and nursingcare by the senior population.The advancements in medical science and thetremendous momentum in the life sciences sectortoday and into the future will bolster consumerdemand for both life-saving therapies and electiveprocedures, keeping individuals alive longer andasserting Seniors Housing as one of the most stableasset classes.Age vs. healthcare expenditure40%Share of populationShare of spending35%35%30%25%24%20%15%21%21%17%10%13%13% 13%13%12%9%5%9%0%65 55–6445–5435–4419–340–18Source: Advisory Board, Kaiser Family Foundation analysis of Medical Expenditure Panel Survey11 Seniors Housing & Care Spring 2022 Investor Survey and Trends Outlook 2022 Jones Lang LaSalle IP, Inc. All rights reserved.
Demand for Seniors Housing product is primarilydriven by the population age 80 , which betterrepresents today’s aged resident. However, goingforward in 2022 and beyond, it is important to notethat the industry has recently entered into a new 10year investment cycle with a massive baby boomercohort that soon will be either planning orconsidering a move into a retirement community.trends, JLL projects that the Seniors Housing sectorwill still be undersupplied by 600,000 units as we getcloser to 2045. This suggests that supply growthwould need to increase by 25,000 units per year tomeet peak demand levels, showcasing themagnitude of demographic tailwinds.Looking closer at these demographics, we see thatthe typical age of Seniors Housing residents is 83. In2030, those at the beginning of the baby boomergeneration will be 84 years old—the prime age formoving into Seniors Housing. Those at the end ofthe baby boomer generation will not reach this ageuntil 2048.Baby boomers consist of those people bornbetween 1946 and 1964. As of 2020, there were 73million of these people and they represent 22% ofthe U.S. population. With the sizable baby boomerdemographic just now beginning to enter theSeniors Housing space, the long-term outlook is thatthis situation will flip starting around 2027–2028 andthere will ultimately be a significant and magnifiedsupply shortage.By 2050, this aged population is expected tocomprise 47.5 million people and account forover 12% of the population. This suggests thatthere will need to be more investment made in thissector to ensure there is affordable housing andcare available.Assuming the reduced capture rate realized duringthe second and third quarters of 2020 holds over thelonger term, along with the reduced construction3,00080 PopulationAdjusted Demand2,50035,000Supply Trend Average30,00025,0002,000Supply shortage1,50020,00015,0001,000Population (Thousands)Units (Thousands)Long-term demand : U.S. Census Bureau and JLL Research12 Seniors Housing & Care Spring 2022 Investor Survey and Trends Outlook 2022 Jones Lang LaSalle IP, Inc. All rights reserved.
Market outlookOur investor survey indicated 80% of respondentsbelieve we have endured the worst of the pandemicand expect market fundamentals to improve, which isa vast improvement from the only 48% who had thesame sentiment this time last year. Coupled with that,76% of respondents expect their exposure to SeniorsHousing to increase over the next year. The SeniorsHousing sector has moved into the recovery phasesince the pandemic-related disruption, backed bystrong long-term demand and increased investorinterest.The Cardinal at North Hills13 Seniors Housing & Care Spring 2022 Investor Survey and Trends Outlook 2022 Jones Lang LaSalle IP, Inc. All rights reserved.
JLL Valuation IndexThe JLL Valuation Index represents an aggregation of market valuations completed by JLL's Seniors HousingValuation Advisory practice group in 2021. The aggregate market values total approximately 45 billion, or9.5% of the estimated Seniors Housing and Care market cap of 475B. The value indications presented in thetables that follow represent statistical ranges of market valuations completed by JLL Valuation Advisory overthe past 12 eUpperdecileMajority Independent LivingOccupancy (%)Effective Gross Rev. per Unit ( )Expense Ratio (%)Cap Rate (%)Value per Unit ( )COVID-19 Expenses ( per 1,853747.00457,292878Majority Assisted LivingOccupancy (%)Effective Gross Rev. per Unit ( )Expense Ratio (%)Cap Rate (%)Value per Unit ( )COVID-19 Expenses ( per 93,372818.50553,5291,075Stand-Alone Memory CareOccupancy (%)Effective Gross Rev. per Unit ( )Expense Ratio (%)Cap Rate (%)Value per Unit ( )COVID-19 Expenses ( per 9590,101829.50368,3331,111Stand-Alone Nursing CareOccupancy (%)Effective Gross Rev. per Unit ( )Expense Ratio (%)Cap Rate (%)Value per Unit ( )COVID-19 Expenses ( per 1,78293117,6839113.00186,3252,351CCRC/LPCOccupancy (%)1Effective Gross Rev. per Unit ( )Expense Ratio (%)Cap Rate (%)Value per Unit ( )COVID-19 Expenses ( per 61,3558475,0969111.50134,4162,650Stabilized indications1 Thestabilized indications represent the amortized net entrance fee income from entrancefee properties valued by JLL in 2021.14 Seniors Housing & Care Spring 2022 Investor Survey and Trends Outlook 2022 Jones Lang LaSalle IP, Inc. All rights reserved.
Investor survey resultsThe JLL Investor Survey focuses on transactional professionals who specialize in the Seniors Housing and Carespace. The sample set for this survey surpassed 100 respondents, encompassing some of the most influentialleaders in the sector. The intention of this survey is to garner insights into current market sentiment fromindustry leaders and to provide expectations for the year ahead.Capitalization rates by investment classRespondents were asked to select the most appropriate capitalization-rate range, applied to year 1 stabilizednet operating income, inclusive of market-level management fees and replacement reserves, for core orprimary market locations, broken out by asset class. Capitalization rates are being compared to pre-pandemicdata from Q1 2020.CoreCapitalizationRates (%)Active AdultClass AClass BClass CQ1 ChangeLow High Avg. 2020 (bps)Q1 ChangeLow High Avg. 2020 (bps)Q1 ChangeLow High Avg. 2020 ndependent ssisted Memory ursing 010.08.78.9-20Non-CoreCapitalizationRates (%)Active AdultClass AClass BClass CQ1 ChangeLow High Avg. 2020 (bps)Q1 ChangeLow High Avg. 2020 (bps)Q1 ChangeLow High Avg. 2020 Independent 0Assisted 0Memory ursing Care9.012.011.211.4-2010.013.012.412.7-3010.5% -109.59.7-20Investment Class &Location SpreadsActive AdultInvestment Class SpreadsCore (bps)Investment Class SpreadsNon-Core (bps)7.010.5Location SpreadsCore vs. Non-Core 152929262Independent Living6413019460140200646070Assisted Living6811218080100180506250Memory Care7070140100110210205090Nursing 040508015 Seniors Housing & Care Spring 2022 Investor Survey and Trends Outlook 2022 Jones Lang LaSalle IP, Inc. All rights reserved.
Unleveraged yield rates by investment classThe percentage of survey respondents relying on the discounted cashflow analysis decreased from 69% to54% over the past year. Respondents were also asked to indicate their minimum unlevered yield rate by bothinvestment class and product type.All marketsClass AClass BQ1 ChangeClass CQ1 ChangeQ1 ChangeUnlevered yield (%) Low High Avg. 2020 (bps) Low High Avg. 2020 (bps) Low High Avg. 2020 0Active AdultIndependent 30Assisted 9-50Memory -40Nursing 09.013.011.010.95Discovery Village at Sandhill16 Seniors Housing & Care Spring 2022 Investor Survey and Trends Outlook 2022 Jones Lang LaSalle IP, Inc. All rights reserved.
Q4 2021 responses are represented in the interior ring of the doughnut graph; the exterior ring containsresponses from our Q1 2020 survey.Composition of respondentsThe largest category of surveyrespondents was represented bydebt providers, at 42%.Investment sales and developersrepresented the next level ofrespondents at 15% and 14% ofrespondents, respectively.Q1 20205%22%11%10% 8% 3%12%15%Q4 202114%Marketing timeRespondents were asked toindicate typical marketing time forSeniors Housing assets, defined asthe number of months betweenthe date a community is listedthrough the date of closing.Though “six months” remainedthe highest percentage at 50% ofrespondents, the “less than sixmonths” time frame surpassedthe “nine months” category as thesecond-highest, evidencingmarket time is decreasing.Outlook for capitalization ratesInvestor sentiment for 2022remains cautious, with 47% ofrespondents indicating that theyexpect no change in SeniorsHousing capitalization rates overthe next 12 months, whereas only15% of respondents are expectingto see capitalization ratesincrease.Q1 2020Q1 20203% 5%4%19% 17%8%20%15%29%Q4 202147%15%22%42%Q4 202138%72%50%14%53%REITLess than 6 monthsIncreaseInstitutional Investor6 monthsDecrease9 monthsNo changePrivate EquityDeveloperDebt Provider20%12 monthsGreater than 12 monthsInvestment SalesOther17 Seniors Housing & Care Spring 2022 Investor Survey and Trends Outlook 2022 Jones Lang LaSalle IP, Inc. All rights reserved.
Opportunity for investmentActive adult 55 takes the lead asthe most sought-after investmentopportunity in 2022, at 31% ofrespondents, over assisted livingat 28%. Skilled nursing andindependent living are tied in thenext tier of opportunities at 17%.Investment exposureMarket participants are even morebullish on Seniors Housing andnursing care investment today,with 76% of respondentsindicating that they intend toincrease their exposure in 2022.The percentage of participantsexpecting to decrease theirexposure dropped to just 4%,meaning only 20% of respondentsexpect the size of their portfolio tobe unchanged during the next 12months.Q1 2020Q1 20209%11%9%24%4%17%8% 4%26%31%Q4 202128%Expected impact of pandemic80% of respondents believe wehave endured the worst of thepandemic and expect marketfundamentals to improve, which isa vast improvement from the only48% who has the same sentimentthis time last year. 11% ofrespondents believe it is still tooearly to tell, while 9% expect tostill see a decline in propertyvaluations and an increase in loandelinquencies in 2022.17% 21%11%20%4%Q4 202176%14%27%Q4 202160%80%Active Adult 55 IncreaseIndependent LivingDecreaseAssisted LivingNo changeMemory CareSkilled NursingCCRC/LPC18 Seniors Housing & Care Spring 2022 Investor Survey and Trends OutlookStill too early to tell andtaking it one day at a timeWe have endured the worstand expect market valuationsand transaction activity toimprove throughout 2021We expect to see a decline inproperty valuations and anincrease in loan delinquenciesthroughout 2021 2022 Jones Lang LaSalle IP, Inc. All rights reserved.
Investment class and locational descriptionsInvestment classClass A: Excellent-quality assets located in desirablemarket locations, primarily core markets but can bein non-core markets. Construction is steel-frame orreinforced concrete, with an average age less than10 years. Building finishes are high-end or superiorto the market with top-quality FF&E, state-of-the-arttechnology and enriched amenities. Captures agreater than its proportionate share of the market,with occupancy levels and rent growth thatoutperform the market, targeting a high-net-worthpopulation. Nursing care properties are bestdescribed as being located on or near a healthcarecampus with state-of-the-art therapy space andequipment. Resident rooms are primarily privatewith quality mix that outperforms the market.Class B: Good- to average-quality assets located incore and non-core market locations. Constructionconsists of steel-frame, reinforced concrete or woodframe with an effective age between 10 and 25 years.Building finishes, FF&E, technology and amenitiesare considered adequate or average to the marketand becoming dated. These properties capture theirproportionate share of the market with averageoccupancy and rent levels consistent with themarket but generally do not compete withinvestment Class A assets. For nursing care,functional design, primarily containing private andsemi-private resident rooms, and adheres to lifesafety code. The payor source is primarily Medicaidwith a census mix and private pay rates consistentwith the market.competitiveness. Resident rooms may not have fullbathrooms or kitchenettes. Rent and occupancylevels typically fall below market averages and maycontain a significant percentage of subsidized rents.For nursing care, properties are located with little tono access to healthcare providers. Theimprovements feature a more institutional designand functional obsolescence with a high percentageof semi-private or ward rooms, outdated mechanicalsystems and inadequate ventilation systems, andmay not meet all life safety code requirements.Market locationCore (Primary): Market locations ar
Research Investor Survey and Trends Outlook Seniors Housing & Care United States Spring 2022 Oakmont La Floresta Brea CA
