Transcription
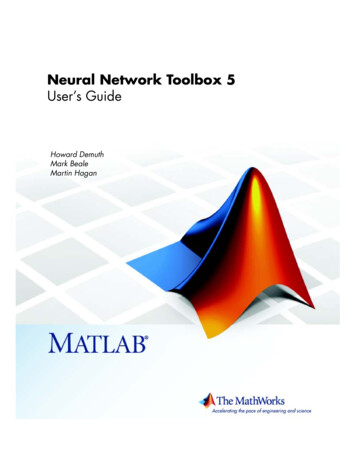
Demystifying the Neural Tangent Kernel from a Practical Perspective:Can it be trusted for Neural Architecture Search without training?Byunggook Na1Ji-Hoon Kim2,3†Dongyoon Han2†Sungroh Yoon1,4†Jisoo Mok1 *123Department of ECE, Seoul National UniversityNAVER AI LabNAVER CLOVA4AIIS, ASRI, INMC, ISRC, and Interdisciplinary Program in AI, Seoul National UniversitySkipAbstractIn Neural Architecture Search (NAS), reducing the costof architecture evaluation remains one of the most crucialchallenges. Among a plethora of efforts to bypass trainingof each candidate architecture to convergence for evaluation, the Neural Tangent Kernel (NTK) is emerging as apromising theoretical framework that can be utilized to estimate the performance of a neural architecture at initialization. In this work, we revisit several at-initialization metricsthat can be derived from the NTK and reveal their key shortcomings. Then, through the empirical analysis of the timeevolution of NTK, we deduce that modern neural architectures exhibit highly non-linear characteristics, making theNTK-based metrics incapable of reliably estimating the performance of an architecture without some amount of training. To take such non-linear characteristics into account, weintroduce Label-Gradient Alignment (LGA), a novel NTKbased metric whose inherent formulation allows it to capture the large amount of non-linear advantage present inmodern neural architectures. With minimal amount of training, LGA obtains a meaningful level of rank correlationwith the final test accuracy of an architecture. Lastly, wedemonstrate that LGA, complemented with few epochs oftraining, successfully guides existing search algorithms toachieve competitive search performances with significantlyless search cost. The code is available at: https://github.com/nutellamok/DemystifyingNTK.1. IntroductionDeep Neural Networks (DNNs) continue to produce impressive results in a wide variety of domains and applications. The remarkable success of DNNs is due in no smallpart to the development of novel neural architectures, allof which used to be designed manually by machine learning engineers by testing a number of architectural design* Work done while interning† Corresponding Authorsat NAVER (magicshop1118@snu.ac.kr)3x3 ConvAvg PoolWeak kernel twisting(a) Low-accuracy ArchitecturesStrong kernel twisting Non-linear behavior(b) High-accuracy ArchitecturesFigure 1. A conceptualized view of how (a) the NTK of a lowaccuracy architecture and (b) that of a high-accuracy architectureevolve during training (gray green). Black planes denote thefunction space realization of weight parameters. On the top leftcorners of (a) and (b), an example of a low- and high-accuracy architecture is provided. Unlike a low-accuracy architecture, a highaccuracy architecture equipped with a large amount of non-linearadvantage experiences strong kernel twisting, such that the principal components of the NTK become more aligned with targetlabels. In Figure 2, we illustrate that LGA captures this differencein the architectures residing in two polar accuracy regimes.choices. To remedy this issue, Neural Architecture Search(NAS), a sub-field of automated machine learning, hasemerged as a feasible alternative to hand-designing neuralarchitectures [13].Although the architectures derived by NAS are beginning to outperform hand-designed architectures, thetremendous computational cost required to execute NASmakes its immediate deployment rather challenging [39,51,52]. The majority of the search cost in NAS is induced bythe need to train each candidate architecture to convergencefor evaluation [35]. In more recently proposed NAS algorithms, the individual training of candidate architectures iscircumvented by a weight-sharing strategy [5, 8, 12, 29, 34,35, 46, 48, 50]. With weight sharing, the computational costof NAS is reduced by orders of magnitude: from tens ofthousands of GPU hours to 1 GPU day. Unfortunately,NAS algorithms that rely on weight-sharing are known toexperience an optimization gap between the performanceof an architecture approximated through weight-sharing and11861
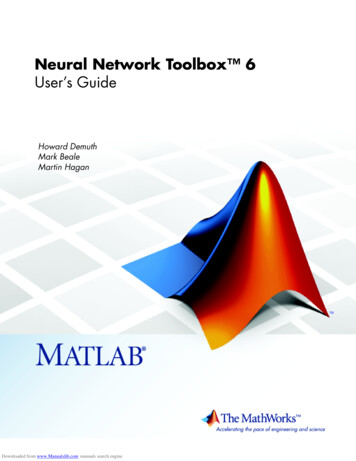
its stand-alone performance [43].Another line of research that aims to accelerate the architecture evaluation process focuses on developing a performance predictor with as few architecture-accuracy pairs aspossible. Minimizing the mean squared error between thepredicted and ground-truth accuracy is the most straightforward way of training such a performance predictor because the problem of performance prediction can naturallybe interpreted as a regression task [9, 26, 40]. The familyof architecture comparators replaces the deterministic evaluation of neural architectures with a relativistic approachthat compares two architectures and determines which oneyields better performance [6, 45]. Apart from weight sharing and performance prediction, some works propose moregeneral proxies for architecture evaluation [1,27,30,31,49].White et al. [41] offer a comprehensive survey of performance predictors in NAS, and in the Appendix, we discussrelated works in more detail.The need to explicitly measure the test accuracy of architectures or train a performance predictor arises from ourlack of theoretical understanding regarding how and whatDNNs learn. Among diverse deep learning theories thatclaim to offer a quantifiable bound on the learning capacity of DNNs, the Neural Tangent Kernel (NTK) framework [21] is garnering a particular amount of attention.Based on the observation that DNNs of infinite widths areequivalent to Gaussian processes, the NTK framework proposes to characterize DNNs as kernel machines [21]. Atthe core of the NTK framework lies an assumption that theNTK computed from an infinitely wide DNN parameterized with randomly initialized weights remains unchangedthroughout training. Thus, the NTK framework suggeststhat the training dynamics of such a DNN can be fully characterized by the NTK at initialization. Motivated by thesolid theoretical ground on which the NTK framework isbuilt, in the field of NAS, NTK-based metrics [4, 44], measured at initialization, have been proposed as an attractivealternative to computing the test accuracy directly.In this paper, we aim to rigorously evaluate how trustworthy of a theory the NTK framework is in the context of NAS by conducting a series of empirical investigations. To begin with, we revisit previously-proposed metricsthat spawn out of the NTK framework: Frobenius Norm(F-Norm), Mean [44], and Negative Condition Number(NCN) [4]. In order to assess whether the NTK-based metrics, computed with randomly initialized weights, are trulyapplicable to NAS, we test them on various NAS benchmarks by measuring Kendall’s Tau rank correlation with thetest accuracy at convergence. Our experimental results showthat the predictive performance of the NTK-based metricsobtained at initialization fluctuates significantly from onebenchmark to another. A more up-close study of how theirpredictive ability changes according to the evaluated archi-High (Avg. acc. 93.60%)Middle (Avg. acc. 77.11%)Low (Avg. acc. 11.55%)0(init.)135Epoch(a) F-Norm100(init.)135Epoch(b) Mean10high non-linearadvantagelow non-linearadvantage0(init.)135Epoch(c) NCN100(init.)135Epoch10(d) LGAFigure 2. How the NTK-based metrics change in the early epochsfor high-, mid-, and low-accuracy architectures. For each accuracy range, 200 architectures are randomly sampled from the NASBench-201 search space, and the averaged test accuracy per architecture set is included in the legend.tecture pool and the weight initialization scheme uncovers additional pitfalls of the NTK framework. Comprehensively, our results seem to indicate that the NTK at initialization does not exhibit a substantial level of reliability forarchitecture selection.Empirically analyzing the time evolution of the NTKreveals that in modern neural architectures that constituteNAS search spaces, the NTK evolves in a highly non-linearmanner. As a result, modern neural architectures tend to exhibit a large amount of non-linear advantage [15, 17, 32].Figure 1 depicts on a high-level how the NTK rotates andevolves during the training process. Inspired by this observation, we introduce Label-Gradient Alignment (LGA), anovel NTK-based metric whose mathematical formulationallows it to coherently capture the non-linear characteristics of modern neural architectures. After only few epochsof training, LGA shows a considerable level of rank correlation with the test accuracy at convergence. As illustrated in Figure 2, delving deeper into how each metricchanges throughout training consolidates that LGA is theonly metric that can accurately reflect the non-linear behavior of modern neural architectures. Lastly, we conduct random [25] and evolutionary search [38] algorithms solely byusing post-training LGA to demonstrate that it can be usedto accelerate existing search algorithms.Our main contributions can be summarized as follows: We rigorously assess the predictive ability of previous NTK-based metrics on various NAS benchmarks11862
and under different hyperparameter settings. Our results imply that the NTK at initialization may be insufficient for architecture selection in NAS. In order to understand the cause of the aforementionedlimitation of the current NTK framework, we analyzethe time evolution of the NTK and reveal that a considerable amount of non-linear advantage is present inmodern neural architectures considered in NAS. We introduce LGA, a novel NTK-based metric thatcan reflect the change in NTK with respect to the target function. Integrating LGA after minimal amount oftraining with existing search algorithms yields a competitive search performance to state-of-the-art NAS algorithms, while noticeably reducing the search cost.It has recently been discovered that under an infinitesimal learning rate and certain types of initialization, in aDNN of infinite width, the approximation in Eq. (1) is exact,and the NTK remains constant throughout training. Therefore, provided that the above assumptions hold, several aspects of the NTK at initialization can be used to fully characterize the training dynamics of a DNN and estimate itsgeneralization performance. Following this theoretical discovery, in NAS, Xu et al. [44] and Chen et al. [4] have proposed to score DNNs at initialization based on the metricsthat spawn out of the NTK.2.2. Previous NTK-based MetricsMetric I: Frobenius Norm Suppose Θθt is the NTK at thet-th epoch. According to Xu et al. [44], for any t 0, thefollowing inequality holds:2. Neural Tangent Kernel yi fθt (xi ) 22 exp( λmin t) yi fθ0 (xi ) 22 ,This section provides an overview of the NTK framework and the NTK-metrics that will be subject to a series ofinvestigations in the later sections. In Section 2.1, we introduce the concept of the NTK, and in Section 2.2, we brieflyreview previously proposed NTK-based metrics.2.1. PreliminariesLet us define a DNN as a function fθ : Rd R, whereθ is the set of trainable weight parameters. Given the target dataset, D {(xi , yi )}Ni 1 , without loss of generality, the NTK framework focuses on a binary classificationproblem, whosePN objective is to minimize the squared loss,LD (θ) i 1 yi fθ (xi ) 22 . Here, xi X and yi Ydenote image samples and the corresponding class labels,respectively. In a small neighborhood region around the randomly initialized weights θ0 , a DNN can be linearly approximated through a first-order Taylor expansion [21]:fθ (x) fˆθ (x; θ) fθ0 (x) (θ θ0 ) θ fθ0 (x),(1)where θ fθ0 corresponds to the Jacobian of a DNN’s prediction, computed with respect to θ0 . The obtained approximation fˆθ can be regarded as a linearized network that mapsweight vectors to functions residing in a reproducible kernel Hilbert space (RKHS) H L2 (Rd ), determined by theNTK at θ0 [32]:Θθ0 (x, x′ ) ⟨ θ fθ0 (x), θ fθ0 (x′ ) ⟩.(2)Note that the NTK is essentially the dot product of two gradient vectors, and is thus equivalent to the Gram matrix ofper-sample gradients. Intuitively speaking, the NTK can beinterpreted as a condensed representation of gradient valuesand gradient correlations. From a geometric perspective,gradient values influence the extent of gradient descent ateach step, and gradient correlations determine the stochasticity of gradient directions [44].(3)where λmin is the minimum eigenvalue of the NTK matrixΘθt . From Eq. (3), we see that the upper bound on the lossterm is determined by λmin ; the larger λmin is, the tighterthe upper bound becomes, thereby yielding a smaller training loss.Since Θθt is always symmetrical by definition, λmin canbe bounded by the Frobenius norm of Θθt :sX λk 2 Θθt F ,(4)λmin kwhere λk denotes the k-th eigenvalue of Θθt , ordered byλmin . . . λmax . Utilizing the Frobenius norm as ametric to score DNNs allows us to circumvent the eigendecomposition of Θθt with the time complexity of O(n3 ).Provided that the NTK does remain constant regardless oftraining as mentioned in Section 2.1, for any value of t, Θθt F can be replaced with Θθ0 F . For the remainderof this paper, we use the abbreviation F-Norm to refer tothis metric, which must be positively correlated with the final test accuracy of a DNN.Metric II: Mean Although Xu et al. [44] show that the Θθ0 F can be leveraged to evaluate randomly-initializedDNNs, they do not directly use F-norm as a metric. Instead, the mean of Θθ0 is proposed as a metric for evaluating DNNs at initialization. The mean of the NTK matrix,denoted by µ(Θθ0 ), can be expressed as follows: N N 1 X X fθ0 (xi ) fθ0 (xj )µ(Θθ0 ) 2N i 1 j 1 θ0 θ0(5)Like F-norm, the Mean metric must also be positively correlated with the final test accuracy.Metric III: Negative Condition Number Lee et al. [23]prove that the training dynamics of infinitely wide DNNs11863
are controlled by ordinary differential equations that can besolved as:where η and I represent the learning rate and the Identitymatrix, respectively. Lee et al. also hypothesize that themaximum feasible learning rate is given by: η 2/λmax .A further study into the relationship between Θθt and thetrainability of DNNs leads Xiao et al. [42] to conclude thatEq. (6) can be re-written in terms of the eigenspectrum ofΘθt as follows:fθt (X ) (I exp( ηλk t))Y,Rank correlation(6)0.6F-NormMeanNCNPreviouly-used search spaces for evaluation0.40.20-0.2(a) NB-101(b) NB-201(CIFAR10)(c) NB-201(CIFAR100)(d) NB-201(ImageNet)(e) NDS-DARTS(f) NDS-ENAS(g) NDS-NASNet(h) NDS-Amoeba0.6Rank correlationfθt (X ) (I exp( ηΘθt t))Y,New search spaces0.40.20-0.2(7)where λk denotes the k-th eigenvalue of Θθt . Pluggingthe maximum feasible learning rate 2/λmin into Eq. (7),Chen et al. [4] see that λmin converges exponentially at therate of 1/c, where c λmax /λmin is the condition number (CN) of Θθt . As CN grows larger, the output of a DNNfθt (X ) will fail to converge to the target label Y. Thus, CNmust exhibit a negative correlation with the final test accuracy. In this paper, to keep the trend in rank correlation consistent with the rest of the investigated metrics, we use theNegative Condition Number (NCN) instead; hence, NCNmust be positively correlated with the final test accuracy.3. Limitations of the NTK at InitializationHere, we test the universal applicability of previousNTK-based metrics, measured at initialization, to diversesearch spaces offered by NAS benchmarks. Even thoughthese at-initialization metrics have been believed to highlycorrelated with the final accuracy, empirical demonstrationsof their predictive abilities have been limited to a singlesearch space: NAS-Bench-201. Therefore, extending thescope of evaluation to a far more diverse set of search spacesthat contain different candidate operations and connectivity patterns is crucial for rigorously verifying the reliability of the NTK-based metrics. In Section 3.1, we provide asummary of the NAS benchmarks that are used for evaluation; more details on the construction of these benchmarks,as well as the image datasets they utilize, can be found inthe Appendix. In Section 3.2, we present the evaluation results and report key findings regarding the practicality ofthe NTK-based metrics. Lastly, in Sections 3.3 and 3.4, wediscuss additional pitfalls of the NTK identified from moreup-close analyses of the NTK-based metrics.3.1. Benchmarks for Neural Architecture SearchNAS-Bench-101 [47] contains 423,000 computationallyunique neural architectures evaluated on CIFAR-10 [22].All of the architectures in NAS-Bench-101 adopt the celltopology, a smaller feedforward module that is stacked repeatedly to construct the final architecture. The maximumFigure 3. Rank correlation evaluation results on various NASbenchmarks. We compute the three metrics using Train and EvalMode BNs. For simplicity, the higher correlation coefficient obtained from the two settings is reported here. The scale and therange of y-axes are set to be the same across all search spaces.depth of each cell and the number of possible connectionsare set to be 7 and 9, respectively, and the following are theavailable candidate operations: 3 3 convolution, 1 1 convolution, and 3 3 max pooling.NAS-Bench-201 [11] contains 15,625 architectures, all ofwhich are evaluated on CIFAR-10, CIFAR-100 [22], andImageNet-16-120 [7]. Similar to NAS-Bench-101, NASBench-201 architectures are also based on the cell topology.Each one of the cells in NAS-Bench-201 has the fixed depthof 4, and the following candidate operations are included inthe search space: zeroize, skip connection, 1 1 convolution, 3 3 convolution, and 3 3 average pooling.NDS [36] offers a comprehensive analysis of commonlyadopted search spaces in NAS. The search spaces supportedby the NDS benchmark include: DARTS [29], ENAS [35],NASNet [52], AmoebaNet [38], and PNAS [28]. Althoughall of these search spaces adopt the cell topology, the design of the cell structure differs from one another; pleaserefer to the Appendix for the summary of differences. Howthe cells are stacked to generate the final neural architecture also varies among papers, but NDS standardizes thisaspect of the search space by utilizing the DARTS architecture configuration. For each search space, NDS trains andevaluates 1K architectures on CIFAR-10.3.2. Benchmark Evaluation ResultsBy using Kendall’s Tau as the measure of rank correlation, we evaluate how reliably the NTK-based metrics computed at initialization can predict the final test accuracy onvarious search spaces. For the sake of computational efficiency, we randomly sample 1,000 architectures from eachsearch space for evaluation. It also appears that there exists no consensus on which batch statistics must be used forthe batch normalization (BN) layer [20] when computing11864
3.3. Fine-grained Rank Correlation EvaluationIn the previous section, 1,000 architectures were randomly sampled from each benchmark to uniformly represent the entire architecture set. We now design a morechallenging experiment, where we rank architectures in descending order and divide them into deciles, denoted byP; P1 contains Top-10% of architectures, P2 contains Top10 20% of architectures, and so on. From each decile,100 architectures are sampled for evaluation. This experiment allows us to determine whether the NTK-based metrics can stably guide the search process by gradually searching for a better architecture. Such a fine-grained experimentis no longer valid in search spaces that contradict the theoretical motivation. Therefore, the experiments in this sectionare conducted only on NAS-Bench-201.We repeat this experiment with 20 different seeds for architecture sampling and visualize the results in the formof box-and-whisker plots. Please refer to Section A6 andFigures A2, A3, and A4 in the Appendix for the evaluation results. They suggest that in most deciles, the predictive ability of NTK-based metrics fluctuates significantlyaccording to the choice of architectures used for evaluation.F-Norm0.6Rank correlationthe NTK. We thus test out both Train and Eval mode BNavailable in PyTorch [33]. Please refer to the Appendix fordetailed experimental settings used in this section.In Figure 3, we report the abbreviated evaluation resultsthat only include the highest rank correlation coefficient obtained for each metric; a comprehensive visualization ofall rank correlation measurement results is provided in theAppendix. Due to the page constraint, the results on NDSPDARTS have also been moved to the Appendix. On NASBench-201, we have successfully reproduced the rank correlation measure for Mean [44] and NCN [4] reported intheir original papers. In NAS-Bench-101 and NDS searchspaces, the degree of rank correlation decreases noticeablyfor all three metrics. In NAS-Bench-101 and NDS-NASNet,in particular, F-Norm and Mean seem to be negatively correlated with the final test accuracy, which goes against theirtheoretical motivation. Considering that the search spacesof NAS-Bench-101 and NDS are more complicated thanthat of NAS-Bench-201, such results may call into questionwhether the NTK framework can be deployed universally tomore complex search spaces.We also note that no single BN usage seems compatible with all three metrics. For instance, on the one hand,using fixed batch statistics (i.e. Eval mode BN) generallyyields high rank correlation for NCN in NAS-Bench-201.On the other hand, in the same search space, using persample batch statistics (i.e. Train mode BN) improves rankcorrelation for F-Norm and Mean. This finding makes it evident that the NTK framework as is may lack considerationof the effect of BN on modern neural architectures.MeanNCN0.40.20XavierKaimingGauss(a) CIFAR10XavierKaimingGauss(b) CIFAR100XavierKaimingGauss(c) ImageNetFigure 4. Rank correlation evaluation results on NAS-Bench-201obtained from different initialization schemes. NCN appears relatively robust to change in initialization schemes, but F-Norm andMean are destroyed with the Gaussian initialization.These results imply that guiding a search algorithm with theNTK-based metrics may not be able to escape from a locally optimal architecture and thus may often lead to unstable search results. Also, progressively shrinking the initialsearch space based on the error distribution of the architectures within it has become a commonly adopted techniquein NAS or general architecture design [5,19,24,37]. In sucha refined search space that consists only of high-accuracyarchitectures, NTK-based metrics may fail to identify a particularly better architecture.3.4. Sensitivity to Weight InitializationConsidering that previous NTK-based metrics have always been computed at initialization, the choice of weightinitialization can be expected to have a non-negligible influence over the NTK computation result. We test howthe NTK-based metrics are affected by Xavier [16], Kaiming [18] and Gaussian initializations. The experiments inthis section are conducted only on NAS-Bench-201 as well.Figure 4 shows the change in rank correlation accordingto different initialization schemes. All three metrics showsome degree of fluctuation when using Xavier and Kaiminginitializations, but when the Gaussian initialization is used,to our surprise, the rank correlation for F-Norm and Meanplummet close to zero. This is an unexpected result becausethe NTK framework assumes that the parameters in a DNNare initialized as iid Gaussians, and thus their function realizations asymptotically converge to a Gaussian distributionin the infinite width limit [21].4. MethodologyWe conjecture that the unreliability of the NTK-basedmetrics obtained at initialization occurs because the underlying theoretical assumptions in the NTK framework areviolated in modern DNNs. As a result, the NTK derivedfrom a modern DNN is likely to evolve in a non-linear manner as training progresses, diverging away from the NTK atinitialization [15, 17, 32]. In Section 4.1, we witness thatthe architectures considered in NAS indeed exhibit highlynon-linear characteristics. Then, in Section 4.2, we presentLabel-Gradient Alignment, a novel NTK-based metric thathas yet to be studied in NAS, and show how it can capture11865
the evolution of the NTK with respect to target labels. Afterwards, in Section 4.3, we corroborate the theoretical motivation behind LGA by demonstrating that after little amountof training, LGA shows a meaningful level of rank correlation with the test accuracy. Please refer to the Appendix fordetailed experimental settings used in this section.Kernel Correlation0204060EpochRelative Kernel Difference80100 0204020402040(a) CIFAR10Epoch6080100608010060801004.1. Time Evolution of the NTKKernel Correlation measures the Pearson’s correlation coefficient between Θθ0 and Θθt : Cov (Θθ0 , Θθt ) /(σ (Θθ0 ) σ (Θθt )). The correlation measurement results arepresented on the left panel of Figure 5. For all three datasets,the correlation between Θθ0 and Θθt decreases rapidly inthe initial epochs and start to stabilize after some amount oftraining, and such a trend becomes more conspicuous withthe growth in data complexity.Relative Kernel Difference measures the relativechange in the NTK from Θθ0 to Θθt : Θθt Θθ0 / Θθ0 .The kernel difference measurement results are visualized onthe right panel of Figure 5. We once again observe that theNTK deviates noticeably from Θθ0 in the initial epochs, butthe relative difference starts to saturate mid-training.Based on both the correlation and the distance measurement results, a singular conclusion can be drawn: modern neural architectures primarily studied in NAS exhibita highly non-linear behavior during training, and thus, theNTK in such architectures experiences a large amount ofkernel twisting. Consequently, the NTK framework, whosecore theoretical results are built on the assumption that theNTK remains constant throughout training, loses its credibility, and the characteristics of the NTK at initializationbecome incapable of accurately representing the final testaccuracy of a neural architecture. This finding can be interpreted as being consistent with recent discovery that thenon-linear advantage in DNNs is what allows them to outperform their linear kernel counterparts [15, 32]. Therefore,we introduce Label-Gradient Alignment, a novel NTKbased metric that can capture the non-linear characteristicsof neural architectures with only few epochs of training.4.2. Label-Gradient AlignmentWhile a neural architecture’s generalization performancemust be one of the most prioritized factors in NAS, obtaining a closed-form characterization of generalization erroron test data that cannot be accessed is impossible. However,provided that the approximation in Eq. (1) is exact, it is possible to formulate generalization guarantees for DNNs bytransferring the generalization bounds computed from theirlinear kernel equivalents. In Bartlett et al. [2], it is shownthat with high probability, the following relationship holds: s f 2Θθ Ex [Θθ0 (x, x′ )]0 , (8)R(f ) R̂(f ) O m002020404060Epoch60Epoch80100 0(b) CIFAR10080100 0(c) ImageNetEpochEpochFigure 5. Analyzing the time evolution of the NTK as training progresses. Five unique architectures, represented by lines of different colors, are randomly sampled. For all three datasets, the kernelcorrelation decreases, and the kernel difference increases.where R and R̂ denote the expected and the empirical risks,respectively, of f argminh H R̂(h) r h 2Θθ , with0r 0 as a regularization constant. f : Rd 1 corresponds to the target function that the DNN is trying to learn, f Θθ0 is the RKHS norm of this target function. One canassume that a DNN generalizes well whenever it achieves alow expected risk, and Eq. (8) indicates that the differencebetween the expected and the empirical risks decreases asthe term f 2Θθ becomes smaller. Through eigendecom0position, f 2Θθ can be re-written as:0 f 2Θθ 0X 1(Ex D [vk (x)f (x)])2 ,λk(9)kwhere {λk , vk } denotes k-th eigenvalue-eigenvector pair ofΘθ0 . We can now see that better generalization performancemay be expected when targets (or labels) align well withtop eigenvectors of the NTK matrix, i.e. the first principalcomponents of the variability of the per-sample gradients.Instead of directly computing Eq. (9), Ortiz et al. [32]offer a more tractable bound on f 2Θθ :0 f 42/ f 2Θθ0 α(f ),where α(f ) Ex,x′ D [f (x)Θθ0 (x, x′ )f (x′ )],(10)where · Θθ0 and · 2 denote the RKHS norm and the l2norm, respectively. In a fully supervised setting, where thetarget function is defined in the form of class labels, targetfunction f in α(f ) can be replaced with target labels Y,thereby yielding:α(Y) Y Θθ0 Y.11866(11)
LGA (Θθ0 µ(Θθ0 )) · (LY µ(LY )), Θθ0 µ(Θθ0 ) 2 LY µ(LY ) 2(12)where µ(LY ) is the average of elements in LY .4.3. NTK-based Metrics after TrainingWe now repeat the rank correlation evaluation experiment conducted in Section 3 after training architectures fort {1, 3, 5, 10} epochs. The post-training rank correlationevaluation results on NAS-Bench-201 are visualized in Figure 6. In terms of rank correlation, LGA is the only metricthat exhibits a steady improvement as training progressesacross all three datasets. In Table 1, we compare LGA after a single training epoch (LGA1 ) with NTK-based metricsobtained at initialization on other NAS benchmarks. Independent of the choice of a benchmark, the rank correlationof LGA1 exceeds that of previous NTK-based metrics.To better understand this characteristic behavior of LGA,we analyze how the NTK-based metrics of high-, mid-, andlow-accuracy architectures change during the training process; please refer back to Figure 2 for the results of this analysis. For high-accuracy architectures, we observe a surge inLGA, which indicates that the concentration of labels onto the principal comp
training with existing search algorithms yields a com-petitive search performance to state-of-the-art NAS al-gorithms, while noticeably reducing the search cost. 2. Neural Tangent Kernel This section provides an overview of the NTK frame-work and the NTK-metrics that will be subject to a series of investigations in the later sections.