Transcription
Teachers’ Use of Educational Technology in U.S.Public Schools: 2009First LookNCES 2010-040U . S . D E PA R T M E N T O F E D U C AT I O N
Teachers’ Use of EducationalTechnology in U.S. Public Schools:2009First LookMAY 2010Lucinda GrayNina ThomasLaurie LewisWestatPeter TiceProject OfficerNational Center for Education StatisticsNCES 2010–040U.S. DEPARTMENT OF EDUCATION
U.S. Department of EducationArne DuncanSecretaryInstitute of Education SciencesJohn Q. EastonDirectorNational Center for Education StatisticsStuart KerachskyDeputy CommissionerThe National Center for Education Statistics (NCES) is the primary federal entity for collecting, analyzing, andreporting data related to education in the United States and other nations. It fulfills a congressional mandate tocollect, collate, analyze, and report full and complete statistics on the condition of education in the United States;conduct and publish reports and specialized analyses of the meaning and significance of such statistics; assist stateand local education agencies in improving their statistical systems; and review and report on education activities inforeign countries.NCES activities are designed to address high-priority education data needs; provide consistent, reliable, complete,and accurate indicators of education status and trends; and report timely, useful, and high-quality data to the U.S.Department of Education, the Congress, the states, other education policymakers, practitioners, data users, and thegeneral public. Unless specifically noted, all information contained herein is in the public domain.We strive to make our products available in a variety of formats and in language that is appropriate to a variety ofaudiences. You, as our customer, are the best judge of our success in communicating information effectively. If youhave any comments or suggestions about this or any other NCES product or report, we would like to hear from you.Please direct your comments toNational Center for Education StatisticsInstitute of Education SciencesU.S. Department of Education1990 K Street NWWashington, DC 20006-5651May 2010The NCES World Wide Web Home Page address is http://nces.ed.gov.The NCES World Wide Web Publications and Products address is http://nces.ed.gov/pubsearch.Suggested CitationGray, L., Thomas, N., and Lewis, L. (2010). Teachers’ Use of Educational Technology in U.S. Public Schools: 2009(NCES 2010-040). National Center for Education Statistics, Institute of Education Sciences, U.S. Department ofEducation. Washington, DC.For ordering information on this report, write toED PubsU.S. Department of EducationP.O. Box 22207Alexandria, VA 22304or call toll free 1-877-4-ED-Pubs or order online at http://www.edpubs.gov.Content ContactPeter Tice(202) 502-7497peter.tice@ed.gov
AcknowledgmentsThe authors would like to recognize the teachers in public elementary and secondary schools whoprovided data on educational technology upon which the report is based. In addition, we thank theschools that provided lists used to select the sample of teachers for the survey. We also thank the sponsorsfrom the Office of Educational Technology.iii
This page intentionally left blank.
ContentsPageAcknowledgments .iiiList of Tables .viAppendix A Tables .viiAppendix B Tables .viiiFirst Look Summary .1Introduction .Selected Findings .13Tables .5Related Reports .21Appendix A: Standard Error Tables .A-1Appendix B: Technical Notes .B-1Appendix C: Questionnaire .C-1v
List of TablesTable1.2.3.4.5.6.7.8.9.10.11.PagePercent of teachers with computers in the classroom every day and percent that canbring computers into the classroom, ratio of students in the classroom to thesecomputers, and percent of these computers with Internet access, by school andteacher characteristics: 2009 .5Percentage distribution of teachers reporting how frequently they or their studentsuse computers during instructional time in the classroom and in other locations inthe school, by school and teacher characteristics: 2009 .6Percent of teachers reporting the availability of various technology devices, and ofthose with the devices available, percent that reported using the devices sometimesor often for instruction during their classes, by school and teacher characteristics:2009 .7Percent of teachers reporting that a system on their school or district network wasavailable for various activities, and of those with a system available, percent thatreported using the system sometimes or often, by school and teacher characteristics:2009 .9Percent of teachers reporting that remote access to various school or districtcomputer applications, documents, or data was available, and of those with remoteaccess available, percent that reported using it sometimes or often, by school andteacher characteristics: 2009 .10Percent of teachers reporting how frequently they used various types of softwareand Internet sites for classroom preparation, instruction, or administrative tasks, byschool and teacher characteristics: 2009 .11Percent of teachers reporting how frequently their students performed variousactivities using educational technology during their classes, based on teachersreporting that the activity applied to their students, by school and teachercharacteristics: 2009 .13Percent of teachers reporting how frequently they used various modes of technologyto communicate with parents or students, by school and teacher characteristics:2009 .15Percent of teachers reporting the extent to which various kinds of education andtraining prepared them to make effective use of educational technology forinstruction, by school and teacher characteristics: 2009 .17Percentage distribution of teachers reporting the number of hours spent inprofessional development activities for educational technology during the last 12months, by school and teacher characteristics: 2009 .18Percentage distribution of teachers who reported participating in professionaldevelopment activities for educational technology during the last 12 monthsreporting agreement or disagreement with various statements about those activities,by school and teacher characteristics: 2009 .19vi
Appendix A Standard errors for the percent of teachers with computers in the classroom everyday and percent that can bring computers into the classroom, ratio of students in theclassroom to these computers, and percent of these computers with Internet access,by school and teacher characteristics: 2009 .A-3Standard errors for the percentage distribution of teachers reporting how frequentlythey or their students use computers during instructional time in the classroom andin other locations in the school, by school and teacher characteristics: 2009 .A-4Standard errors for the percent of teachers reporting the availability of varioustechnology devices, and of those with the devices available, percent that reportedusing the devices sometimes or often for instruction during their classes, by schooland teacher characteristics: 2009 .A-5Standard errors for the percent of teachers reporting that a system on their school ordistrict network was available for various activities, and of those with a systemavailable, percent that reported using the system sometimes or often, by school andteacher characteristics: 2009 .A-7Standard errors for the percent of teachers reporting that remote access to variousschool or district computer applications, documents, or data was available, and ofthose with remote access available, percent that reported using it sometimes oroften, by school and teacher characteristics: 2009.A-8Standard errors for the percent of teachers reporting how frequently they usedvarious types of software and Internet sites for classroom preparation, instruction, oradministrative tasks, by school and teacher characteristics: 2009 .A-9Standard errors for the percent of teachers reporting how frequently their studentsperformed various activities using educational technology during their classes,based on teachers reporting that the activity applied to their students, by school andteacher characteristics: 2009 .A-11Standard errors for the percent of teachers reporting how frequently they usedvarious modes of technology to communicate with parents or students, by schooland teacher characteristics: 2009 .A-13Standard errors for the percent of teachers reporting the extent to which variouskinds of education and training prepared them to make effective use of educationaltechnology for instruction, by school and teacher characteristics: 2009 .A-15Standard errors for the percentage distribution of teachers reporting the number ofhours spent in professional development activities for educational technologyduring the last 12 months, by school and teacher characteristics: 2009 .A-16Standard errors for the percentage distribution of teachers who reportedparticipating in professional development activities for educational technologyduring the last 12 months reporting agreement or disagreement with variousstatements about those activities, by school and teacher characteristics: 2009 .A-17vii
Appendix B TablesTableB-1.B-2.PageNumber and percent of responding teachers in the study sample, and estimatednumber and percent of teachers the sample represents, by school and teachercharacteristics: 2009 .B-4Percent of cases with imputed data in the respondent sample, and percent of caseswith imputed data the sample represents, by questionnaire item: 2009 .B-6viii
First Look SummaryIntroductionThis report provides national data on the availability and use of educational technology among teachers inpublic elementary and secondary schools during the winter and spring of 2009. The data are the results of anational teacher-level survey that is one of a set that includes district, school, and teacher surveys oneducational technology.1 Every year between 1994 and 2005 (with the exception of 2004), the Office ofEducational Technology (OET) in the U.S. Department of Education asked the National Center for EducationStatistics (NCES) to conduct a survey of public schools to track access to information technology in schoolsand classrooms. NCES used its Fast Response Survey System (FRSS) to conduct these surveys. For fall2008,2 this OET-sponsored technology study was redesigned and expanded to incorporate surveys at thedistrict, school, and teacher levels. These three surveys provide complementary information and together covera broader range of topics than would be possible with one survey alone. Prior to 2008, the surveys focused oncomputer and Internet access and use, as well as procedures to prevent student access to inappropriate materialon the Internet and teacher professional development on technology use.3 The set of 2008 surveys collecteddata on availability and use for a range of educational technology resources, such as district and schoolnetworks, computers, devices that enhance the capabilities of computers for instruction, and computersoftware. They also collected information on leadership and staff support for educational technology withindistricts and schools.During the design phase for the set of 2008 surveys, research was conducted to determine how specific topicsand survey questions should be distributed across the three surveys. The surveys were developed to reflecthow information on educational technology is kept within most public school systems. This report presentsresults from the teacher-level survey, including information on the use of computers and Internet access in theclassroom; availability and use of computing devices and software, teachers’ use of school or district networks(including remote access); students’ use of educational technology; teachers’ preparation to use educationaltechnology for instruction; and technology-related professional development activities. The teacher surveycovers the following specific topics: Number of computers located in the teacher’s classroom every day and number that can be brought intothe classroom; Internet access for the computers available in the classroom; Availability and frequency of use for computers and other technology devices during instructional time; Availability and frequency that teachers use systems on the school or district network for variousactivities; Remote access (e.g., access from home) for teachers to use various school or district computer applicationsor data; Types of software and Internet sites used by teachers for classroom preparation, instruction, andadministrative tasks; Students’ use of educational technology during classes;1For results from the district-level survey, see Educational Technology in Public School Districts: Fall 2008 (NCES 2010–003) athttp://nces.ed.gov/pubsearch/pubsinfo.asp?pubid 2010003. For results from the school-level survey, see Educational Technology in U.S. PublicSchools: Fall 2008 (NCES 2010–034) at http://nces.ed.gov/pubsearch/pubsinfo.asp?pubid 2010034.2The district and school surveys collected data for fall 2008. For the teacher survey, sampling lists were collected from schools beginning in fall2008, and survey data were collected from teachers beginning in January 2009.3A list of related reports from the 1994 through 2005 FRSS technology surveys of public schools may be found in the Related Reports section.1
Modes of technology used by teachers to communicate with parents and students; Teacher training and preparation to use educational technology for instruction; and Number of hours spent in professional development for educational technology during the previous12 months, and teachers’ opinions about statements related to this professional development.The questionnaire instructed teachers to use the following definitions when answering the survey.Technology: Information technology such as computers, devices that can be attached to computers(e.g., LCD projector, interactive whiteboard, digital camera), networks (e.g., Internet, local networks),and computer software. We specifically are not including non-computer technologies such asoverhead projectors and VCRs. 4Classroom response system: Wireless system allowing a teacher to pose a question and students torespond using ―clickers‖ or hand-held response pads, with responses compiled on a computer.Document camera: Device that transmits images of 2- or 3-dimensional objects, text, or graphics toa computer monitor or LCD projector.Blogs: Websites where an individual or group creates a running log of entries that can be read byother users, such as in a journal.Wikis: Collaborative websites that allow users to freely create and edit web page content (e.g.,Wikipedia).Social networking websites: Online social networks for communities of people who share interestsand activities or who are interested in exploring the interests and activities of others (e.g., Facebook,MySpace).Teacher in a self-contained classroom: Teaches all or most academic subjects to the same group ofstudents all or most of the day.NCES in the Institute of Education Sciences conducted this FRSS survey during the 2008–09 school year, withcollection of sampling lists starting in September 2008 and collection of teacher surveys starting in January2009. FRSS is a survey system designed to collect small amounts of issue-oriented data from a nationallyrepresentative sample of districts, schools, or teachers with minimal burden on respondents and within arelatively short period of time. For this survey, 2,005 public schools in the 50 states and the District ofColumbia were asked to provide sampling lists of full-time teachers. Questionnaires were mailed to 4,133teachers selected from these sampling lists. The unweighted and weighted list collection response rates were80 percent and 81 percent, respectively. The unweighted and weighted teacher response rates were both 79percent, resulting in overall response rates of 64 percent (unweighted) and 65 percent (weighted).5 The surveyweights were adjusted for list collection and questionnaire nonresponse, and the data were then weighted toyield national estimates that represent all full-time teachers in regular public elementary and secondary schoolsin the United States. The results of a nonresponse bias analysis conducted for the survey to inform thenonresponse weight adjustments, along with additional details about the survey methodology, response rates,and data reliability, are presented in appendix B.45This is the exact wording of the definition provided to respondents on the questionnaire. LCD is the acronym for liquid crystal display.The weighted list collection was calculated using the school base weight without nonresponse adjustment. The weighted teacher response ratewas calculated using a base weight that included the school-level and teacher-level weights but did not include the school or teachernonresponse adjustments. The overall weighted response rate was calculated as the product of the weighted list collection and weighted teacherresponse rates.2
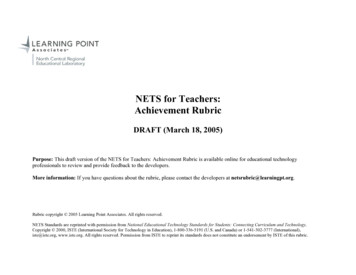
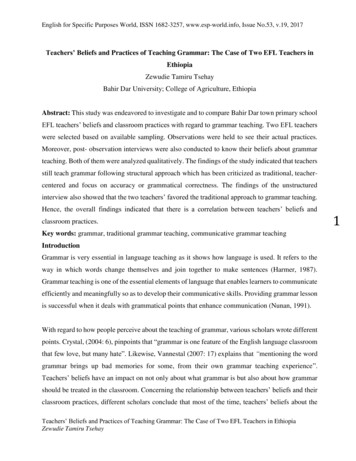
Because the purpose of this report is to introduce new NCES data through the presentation of tables containingdescriptive information, only selected findings are presented. These findings have been chosen to demonstratethe range of information available from the FRSS study rather than to discuss all of the observed differences;they are not meant to emphasize any particular issue. The findings are based on self-reported data from publicschool teachers.All specific statements of comparisons made in the bullets have been tested for statistical significance at the.05 level using Student’s t-statistics to ensure that the differences are larger than those that might be expecteddue to sampling variation. Adjustments for multiple comparisons were not included. Many of the variablesexamined are related to one another, and complex interactions and relationships have not been explored.Tables of standard error estimates are provided in appendix A. Detailed information about the surveymethodology is provided in appendix B, and the questionnaire can be found in appendix C. Appendix B alsoincludes definitions of the analysis variables (i.e., school characteristics) and terms used in the report.Selected FindingsThis section presents key findings on teachers’ use of educational technology in public schools during thewinter and spring of 2009. Ninety-seven percent of teachers had one or more computers located in the classroom every day, while54 percent could bring computers into the classroom (table 1). Internet access was available for 93 percentof the computers located in the classroom every day and for 96 percent of the computers that could bebrought into the classroom. The ratio of students to computers in the classroom every day was 5.3 to 1. Teachers reported that they or their students used computers in the classroom during instructional timeoften (40 percent) or sometimes (29 percent) (table 2). Teachers reported that they or their students usedcomputers in other locations in the school during instructional time often (29 percent) or sometimes(43 percent). Teachers reported having the following technology devices either available as needed or in the classroomevery day: LCD (liquid crystal display) or DLP (digital light processing) projectors (36 and 48 percent,respectively), interactive whiteboards (28 and 23 percent, respectively), and digital cameras (64 and14 percent, respectively) (table 3). Of the teachers with the device available, the percentage that used itsometimes or often for instruction was 72 percent for LCD or DLP projectors, 57 percent for interactivewhiteboards, and 49 percent for digital cameras. Teachers indicated that a system on their school or district network was available for entering or viewingthe following: grades (94 percent), attendance records (93 percent), and results of student assessments (90percent) (table 4). Of the teachers with one of these systems available, the percentage using it sometimesor often was 92 percent (grades), 90 percent (attendance records), and 75 percent (student assessments). Ninety-seven percent of teachers reported having remote access to school email, and of these teachers,85 percent used this remote access sometimes or often (table 5). Eighty-one percent of teachers had remoteaccess to student data, and of these teachers, 61 percent used this type of access sometimes or often. Teachers sometimes or often used the following for instructional or administrative purposes: wordprocessing software (96 percent), spreadsheets and graphing programs (61 percent), software for managingstudent records (80 percent), software for making presentations (63 percent), and the Internet (94 percent)(table 6). Results differed by low and high poverty concentration of the school6 for the percentage of teachers thatreported their students used educational technology sometimes or often during classes to prepare writtentext (66 and 56 percent, respectively), learn or practice basic skills (61 and 83 percent, respectively), and6Poverty concentration is based on the percent of students eligible for free or reduced-price lunch (less than 35 percent and 75 percent or more—referred to as low and high poverty, respectively).3
develop and present multimedia presentations (47 and 36 percent, respectively) (table 7). Percentages arebased on the teachers reporting that the activity applied to their students. Differences were found among low and high poverty schools for the percentage of teachers whosometimes or often did the following: used email or list-serve to send out group updates or information toparents (69 percent compared to 39 percent) or to students (30 percent compared to 17 percent), usedemail to address individual concerns with parents (92 percent compared to 48 percent) or with students (38percent compared to 19 percent), used a course or teacher web page to communicate with parents (47percent compared to 30 percent) or with students (36 percent compared to 18 percent) (table 8). The percentage of teachers that reported that the following activities prepared them (to a moderate ormajor extent) to make effective use of educational technology for instruction are 61 percent forprofessional development activities, 61 percent for training provided by school staff responsible fortechnology support and/or integration, and 78 percent for independent learning (table 9). The percentage of teachers that reported spending the following number of hours in professionaldevelopment activities for educational technology during the 12 months prior to completing the surveywas 13percent for none, 53 percent for 1 to 8 hours, 18 percent for 9 to16 hours, 9 percent for 17 to 32hours, and 7 percent for 33 or more hours (table 10). Of the teachers who participated in technology-related professional development during the 12 monthsprior to completing the survey, 81 percent agreed that ―it met my goals and needs,‖ 88 percent agreed that―it supported the goals and standards of my state, district, and school,‖ 87 percent agreed that ―it applied totechnology available in my school,‖ and 83 percent agreed that ―it was available at convenient times andplaces‖ (table 11).4
Table 1.Percent of teachers with computers in the classroom every day and percent that can bring computers into the classroom, ratio ofstudents in the classroom to these computers, and percent of these computers with Internet access, by school and teachercharacteristics: 2009Computers in the classroomevery dayRatio ofPercent ofstudents in thecomputersPercent ofclassroom towith Internetteachers1computers2accessCharacteristicAll public school teachers .3975.393Computers that can be broughtinto the classroomRatio ofPercent ofstudents in thecomputersPercent ofclassroom towith Internetteachers1computers2access542.496Total computers (in or can bebrought into the classroom)Ratio ofPercent ofstudents in thecomputersPercent ofclassroom towith Internetteachers1computers2access991.7955School instructional levelElementary .985.492522.696991.795Secondary .955.294572.396981.696School enrollment sizeLess than 300 .974.592532.498991.696300 to 999 .975.494532.596991.7951,000 or more .965.392562.396991.695Community typeCity .965.292542.795991.894Suburban .985.493562.397991.696Town .965.293522.796991.895Rural .975.395522.495991.695Percent of students in the school eligible forfree or reduced-price lunchLess than 35 percent .965.993612.197991.59635 to 49 percent .985.492522.596991.79450 to 74 percent .974.994472.996981.89575 percent or more .974.793503.09410041.894Main teaching assignmentGeneral education in self-contained classroom .995.591493.196992.094Mathematics/computer science, science .956.692612.096991.595Other academic subject5.967.797602.297991.797Special education, English as a secondlanguage .993.192491.796991.195Other assignment6 .943.493533.096971.695Elementary/secondary teaching experience3 or fewer years .955.595532.693991.8944 to 9 years .975.494572.297991.69610 to 19 years .975.691532.597991.79520 or more years .974.893522.596991.6951Percent of teachers with one or more computers with the characteristic.2Ratio computed by dividing the number of students in all teachers’ classrooms by the number of computers with the characteristic.3Data for combined schools (those with both elementary and secondary grades) are included in the totals and in analyses by other school characteristics but are not shown separately.4Rounds to 100 percent.5Other academic subjects include English/language arts, foreign languages, and social sciences/social studies.6Other assignments include arts and music; health/physical ed
computer and Internet access and use, as well as procedures to prevent student access to inappropriate material on the Internet and teacher professional development on technology use.3 The set of 2008 surveys collected data on availability and use for a range of educational technology resources, such as district and school