Transcription
Hunterdon CountyNeeds Assessment2020November 18, 2020County Human Services Advisory CouncilAuthored by: Meagan Q. O'ReillyMeagan Q. O'Reilly1
NEEDS ASSESSMENTTable of ContentsPART 1Executive SummaryIntroductionCounty DescriptionNeeds Assessment MethodologyPART 2Key Findings Across All NeedsKey Findings for Each Basic Need Area HousingFoodHealth CareCommunity SafetyEmployment and Career ServicesChild CarePART 3Key Findings for Specialized Service Need Areas Services for Families Caring for a Child of a RelativeBehavioral/Mental Health Services for ChildrenBehavioral/Mental Health Services for AdultsSubstance Use Disorder ServicesDomestic ViolenceParenting Skills ServicesLegal and Advisory Services2
PART 13
Executive SummaryNarrative: In the Words of the CountyThis Human Services Advisory Council Needs Assessment was conducted by the Hunterdon CountyDepartment of Human Services in collaboration with the Human Services Advisory Council (HSAC).The Needs Assessment included the administration of a survey created by the Department ofChildren and Families distributed by the Hunterdon County HSAC to community members. Thesecond part of the needs assessment included a series of focus groups and key informant interviews.The goal of the assessment process and focus groups was to find out detailed information about theservices that exist in the community, and to help identify needs, gaps and barriers. The focus groupsserved as an opportunity for community members, which included consumer representatives, tohave their voices heard regarding various need topics.A review of the data compiled by Rutgers for the needs assessment revealed positive information forHunterdon County as the data shows a great deal of wealth, low crime, high graduation rates, lowunemployment rates, and overall healthy residents. The data also revealed a high cost of living, highchildcare costs, long commutes, high cost of transportation, lack of diversity, fluctuating rates of fatalopioid overdoses, and high rates of depression. The Hunterdon County Department of HumanServices plans to use the survey and focus group recommendations in this report to enhance TheComprehensive Human Services Plan.When reviewing the barriers that exist within the county framework, participants overwhelminglyselected transportation and lack of awareness of services. These are two crucial barriers that impactall basic and specialized need areas identified by DCF. Transportation is a basic need that continues tobe a challenge to meet in Hunterdon County. Due to the geographical size of the county, having aprivate vehicle has become essential for families. For those without their own transportation, it isdifficult to make the LINK transportation system meet each individual need in the county.Transportation is a lifeline to meet one’s basic needs including access to employment, health care,food and housing. The Hunterdon County Department of Human Services is committed to makingimprovements to the LINK transportation system.Lack of awareness of services in the community is something that the various county organizationsincluding HSAC have discussed. Often at community meetings, an agency will advise of a newprogram or an existing program that may not have been highlighted before. Having this informationis wonderful, but what are the people attending the meetings doing with this information theyreceived. Are they sharing information with only their clients, are they talking to their coworkersabout the program, are they talking to their neighbors, their friends?4
Knowing where people access services and using these various touchpoints to make connections iskey to linking someone to services and can be crucial to a client being comfortable with receivingservices. If a client is comfortable and trusts the entity they are working with, there are muchdifferent outcomes for the client and for the worker. Having knowledge and awareness of servicesalso helps the community because less time is spent running around to try and find the right resourcefor the current need. If we dig a little deeper on this barrier, it becomes clear that not everyone in thecommunity attends meetings and we seem to be missing the bigger picture. While there is value incounty and nonprofit partners highlighting programs and what they do through networking atmeetings, we are missing the general public who are not aware of the services we provide. We needto talk about what we do, who we serve and how we serve them.Data sharing is another recurrent theme that comes up in the community as a barrier. Due to HIPPAand other privacy protections client information is protected and with good reason. The barrier isthat if a client does not want to release information to another agency, even if in doing so it benefitsthe client, it cannot be done without their consent. This creates an environment where agencies whomay want to collaborate and help a mutual client cannot. This also creates a potential duplication ofeffort on two agencies who are putting effort into helping the same client with the same needs. Theconnectivity between Hunterdon Medical Center and the County Health department was highlightedto be a model to review during the focus groups as it has been a huge success of a collaborationmodel.The highest need selected by the respondents in the county was Housing. This was not a surprise tofocus group members as most were aware that it is an issue in the county and there are manythoughts on how to address the issue. Some focus group respondents suggested that an emergencyshelter be created for individuals and families, others advocated for more low-income housing to bebuilt and additional supportive housing vouchers. The second highest need selected by therespondents was Healthcare, this was surprising as previous reports indicate that around 95 percentof the county is covered by some health insurance. What was not considered is that havinghealthcare does not mean equal access to doctors, psychiatrists, testing, medication, etc. Althoughmost are covered, the costs of copayments for doctors’ visits and high deductibles keep people fromaccessing the care they need.The highest specialized need selected by the respondents was Behavioral Health for Children and thesecond highest specialized need was Behavioral Health for Adults. The adult and child system sharesimilar challenges including a lack of psychiatrists, long wait times to access treatment and high costswhich include out of pocket expenses for out of network treatment and the cost of copayments tosee a therapist. Focus group respondents suggested that medical students should be incentivized topursue the field of psychiatry and healthcare companies should assist more with behavioral healthneeds as mental health is an integral part of keeping people healthy.5
During the focus group meetings two ways that people attempt to find information when they needassistance came up, one was the internet and the other was through family or friend referrals. Theseare key pieces in changing the way we look at our services in the county. How do we as a communityimprove our internet presence so that it is clear to people who find our web address what we do,who we serve and how we can help them? How do we as a community teach the general publicabout our services? Until we can answer these two critical questions, people will continue to struggleon where to go when they need assistance.In meeting with the community a few things became clear, people who live and work in HunterdonCounty care about their neighbors, want to see others healthy and succeeding in life, and there is atightknit sense of community in Hunterdon County that can provide great value if the community cantap into this resource. These community problems cannot be solved without working collaboratively.These findings suggest that through increasing awareness of services available in the communitycoupled with working towards common goals alongside our nonprofit partners, our community willbe stronger and more capable of assisting our mutual clients.6
IntroductionPurposeThe N.J. Department of Children and Families is partnering with human services organizations in eachcounty to undertake an assessment of local strengths and needs. The goal of this assessment is to collectthe information needed to make sure the right mix of services and activities are available in every countyin New Jersey to support families. The findings from the needs assessment can be used to support thedevelopment of local recommendations to assist with decision making; the identification of high priorityhuman service needs and barriers to service delivery for New Jersey’s communities; the coordinationand improvement of services to the Departments' target populations; the planning, funding,coordination and implementation of Department Initiatives.This statewide approach to county-specific needs assessments aligns with DCF’s existing county basedcontinuous quality improvement review cycle, in which each county is evaluated every two years. Thefindings from the needs assessment will be embedded into the DCF’s existing ChildStat process andshared with DCF staff and stakeholders during the county’s ChildStat session. ChildStat is a learning,management, and accountability tool used by DCF to support continuous quality improvement, fostera shared sense of accountability and promote system-wide problem solving around critical issuesaffecting child and family outcomes. A ChildStat session incorporates analysis and interpretation ofadministrative data to support planning and dialogue between DCF executive management and seniorleadership and system partners.7
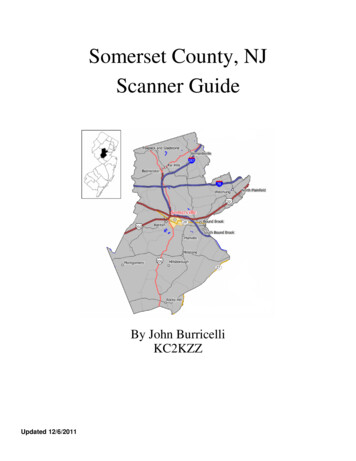
County DescriptionNarrative: In the Words of the CountyHunterdon County encompasses a large geographic area with many wide open spaces. Thepopulation in the county is one of the lowest in the state and still has a rural quality. HunterdonCounty is surrounded by rolling hills, mountains, vineyards, farmer’s markets, rivers, streams andcreeks which make it a desirable place to live and visit. Around 41 percent of the total land inHunterdon County is farmland. It is also a popular destination for camping, fishing, hunting, canoeing,kayaking, swimming and tubing. Hunterdon County has 20 parks and over 350 preserved farms.Hunterdon County is the 8th largest county in New Jersey at 430 square miles, but is the 4th smallestin population, at 125,051 as of 2018 U.S. Census Bureau estimates (50.1 percent females and 49.9percent males). Many parts of the county have retained a rural quality; however, the county hasseen significant growth in the past decade. The latest American Community Survey reported that themedian age in Hunterdon County was 46.2 years. An estimated 20.2 percent of the population wasunder 18 years, 28.2 percent was 18 to 44 years, 34.4 percent was 45 to 64 years, and 17.2 percentwas 65 years and older. According to an ESRI survey profile conducted in 2019, Hunterdon County’s55 and older population is projected to grow by 3.1 percent over the next four years.There are 26 municipalities in Hunterdon County which include: Alexandria Township, BethlehemTownship, Bloomsbury Borough, Califon Borough, Clinton Town, Clinton Township, DelawareTownship, East Amwell Township, Flemington Borough, Franklin Township, Frenchtown Borough,Glen Gardner Borough, Hampton Borough, High Bridge Borough, Holland Township, KingwoodTownship, Lambertville City, Lebanon Borough, Lebanon Township, Milford Borough, RaritanTownship, Readington Township, Stockton Borough, Tewksbury Township, Union Township, andWest Amwell Township.Hunterdon County was recently recognized as the Safest County in America to raise a child by Savethe Children in their Global Childhood Report released in 2020 based on the following data sets:18.9 child deaths before age 18 per 100,0001.6 teen pregnancies per 1,000 girls9.4 percent child hunger with the last year3.6 percent high school dropout rateIn reviewing the data from the American Community Survey, the racial breakdown in HunterdonCounty is 93 percent White, 3 percent Black or African American, 0 percent American Indian or8
Alaskan Native, 5 percent Asian, 0 percent Native Hawaiian or Other Pacific Islander, 1 percent Other,and 6 percent Hispanic/Latinx. These percentages have remained steady from 2013 to 2017. Thepercentage of White residents in Hunterdon County is higher than the state average of 70 percent.The percentage of Black or African American residents in Hunterdon County is less than the stateaverage which is 15 percent. The percentage of Asian residents in Hunterdon County is less than thestate average of 10 percent. The percentage of Hispanic/Latinx in Hunterdon County is less than thestate average of 20 percent.The foreign-born population in Hunterdon County is estimated to be 8.8 percent and has fluctuatedslightly over a five-year period between 8.4 percent in 2013 to 9 percent in 2016 according to the2017 American Community Survey estimates (Rutgers Data, 1.4). The foreign-born population inHunterdon County is the fourth lowest in the state and below the state average of 22 percent.In terms of language, Hunterdon County English-only speakers make up 89.6 percent of thepopulation, which is much higher than the state average of 69 percent (Rutgers Data, 1.7). Over time,the population of English only speaking individuals in Hunterdon County has remained steady from2013 to 2017 at almost 90 percent (Rutgers Data, 1.8). Flemington, which has the lowest percentageof white residents, has the highest percentage of foreign-born residents at 33.2 percent and has thelowest percentage of English-only speakers at 57 percent (5 yr American Community SurveyEstimates, 2017).Hunterdon County has the fourth lowest number of children under 18 which falls in line with thegeneral population size when compared to the other New Jersey counties as noted above. The largestgroup of children in the County are between the ages of 12-17 years old making up 35 percent of thetotal number of children.At the point in time of December 31, 2018 which is part of the Rutgers data provided, HunterdonCounty had the lowest number of children served by CP&P of all the New Jersey counties, with 295children served within their home and 29 children served in out of home placements.Only 4 percent of Hunterdon County families with children under the age of 18 live in poverty, incomparison the state average is 12 percent and the national average is 17 percent. Hunterdon Countyis the most expensive New Jersey county to live in, at 111,459 per year, according to the EconomicPolicy Institute report from 2018. The median household income in Hunterdon County is 110,969which is higher than both the state median and national median household income. Flemington andGlen Gardner have the lowest median income in Hunterdon County.Despite Hunterdon County’s wealth, there are families in the county that struggle to make ends meetand are in need of supportive services to maintain their basic needs. In 2014-2018 according to9
American Community Survey Data, cost-burdened households in Hunterdon County, accounted for30.5 percent of owners with a mortgage, 22.8 percent of owners without a mortgage, and 53.1percent of renters. Low-income residents experience similar difficulties to others living in poverty,and also face unique issues living in a wealthy, rural area. This burden directly impacts a household’sability to save or develop assets, as well as their ability to survive a layoff, divorce, health crisis orother emergency.The Department of Human Services in Hunterdon County encompasses the following Divisions:Administration: The Administrative unit encompasses mental health, substance abuse, youth, juvenilejustice, disabilities and transportation services. Additional responsibilities include contracting, fiscal,and the county adjustor’s office.Division of Housing: The Division of Housing administers rental subsidies through Section 8 HousingChoice vouchers for 477 households. Of the households served, 39 percent include individuals withdisabilities, 42 percent include seniors, and 23 percent are families with children. Thirty eight percentof subsidized households have members who are employed, and 85 percent of subsidized householdsare categorized in the Extremely Low Income Limits in Hunterdon County.Division of Social Services: The Division of Social Services administers state and federally mandatedpublic assistance programs and social services programs, as well as additional County-funded servicesfor eligible individuals and families.Division of Social Work Services: The Division of Social Work Services oversees multiple programsincluding Jersey Assistance for Community Caregiving (JACC), Adult Protective Services (APS), SocialServices for the Homeless-STATE (SSH- STATE) and SSH-TANF funding, Dr. Orlie Pell Grant Funding,Senior Citizen Emergency Program funding, Home Health Services, and the County Adjustor.Division of Senior Disabilities and Veterans Services: This Division provides information and referral,advocacy, assistance, and services to county residents 60 years and over. Case management servicesare also provided for seniors and people with disabilities. The Veteran’s Service Officer providesassistance to veterans who need linkage to benefit programs.Transportation: The LINK system is a public transportation service that is contracted with a thirdparty vendor, which is currently Easton Coach Company, to provide public shuffle routes, deviated fixroute service, and on demand transportation. The LINK is predominately funded by NJ Transit, TheFederal Transit Authority and County funding.10
Hunterdon County is part of the Tri-County CoC along with Sussex and Warren Counties. Currently,Family Promise of Sussex County is the Lead Agency and Collaborative Applicant. The Tri-County CoCis responsible for relaying information between Tri-County CoC and their local continua, identifyingways to coordinate and link resources across the three counties to avoid duplication of services andfacilitate movement toward permanent housing, evaluation and monitoring of all HUD fundedprograms including CoC and ESG dollars, and oversight of the HUD Homeless Assistance Grantapplication process.The New Jersey Department of Education Office of Special Education Programs, Special Educationdata shows that in 2018 Hunterdon County had 3,500 children (the fourth lowest number of children)receiving Special Education (Rutgers data, 15.1). In New Jersey the 2017 and 2018 data show thatHunterdon County had 19 percent of children classified which is similar to the state average of 17.9percent. Regarding Early Intervention Services, the 2017-2018 data show that Hunterdon County hasthe fourth lowest number of children receiving services with a total of 116 for this time period(Rutgers data, 15.3).11
Needs Assessment MethodologyQuantitative and qualitative data from various sources and stakeholders related to housing, food,health care, community safety, employment and career services, child care, services for families caringfor a child of a relative, behavioral/mental health services for children, behavioral/mental healthservices for adults, substance use disorder services, domestic violence services, parenting skills servicesand legal and advocacy services were collected to inform this needs assessment.County Data ProfileDCF provided a county data profile to the county Human Service Advisory Council (HSAC) to supportthe HSAC in identifying key topics to be explored in more depth. The data profile consists of the mostrecently available administrative data related to demographic population and selected indicators ofpoverty, housing, food security, childcare, health care, transportation, employment, community safety,mental health and substance use. The sources for the data included in the profile include a combinationof federal databases. The primary purpose of the county data profiles is to support the HSAC needsassessment team in identifying key areas to prioritize during the focus group data collection efforts.Approach for Prioritizing NeedsThe HSAC Planning and Integration Committee was tasked with developing recommendations for theprioritized needs areas using the data compiled by Rutgers in addition to existing county-based needsassessments. Several planning meetings were set up with HSAC Planning and Integration Committeemembers to discuss and set the prioritized need areas.Overall, the data provided shows that Hunterdon County performs well in most of the identified needareas when compared to the state average and other counties in the state. The data regardingHousing describes a lesser need in the area of household income spent on housing. However,Hunterdon County has the highest cost of living in the state estimated at a cost of 9,288 per month.Hunterdon County residents who earn less than 9,288 per month, struggle to make ends meet. Thisis further exacerbated by a lack of affordable rentals in the county. Although there have been somerecent affordable housing developments constructed in the county, there remains a need for starterhousing for young people who want to start a family in the county. Based on this information, theHSAC Planning and Integration committee suggested that housing be one of the focus areas.The data provided for childcare costs explains that statewide there appears to be a direct correlationbetween the median income in the county and higher childcare costs. In Hunterdon County the costsare over 1,400 per month for infant and toddler childcare, with childcare for toddler’s being slightlyhigher than infant care. During the meeting, committee members expressed that there is a need fordaycare providers for infants which could influence the increase in the price of childcare. Adequateand safe childcare is essential for working families. The group decided to add childcare as a need area12
due to assumptions that there is a lack of affordable childcare in the county. As childcare subsidiesare income based an assumption was also made that Hunterdon residents may not be eligible forchildcare subsidies due to income limits and also assumed that people living in the county may not beable to pay for childcare due to the high cost of living.Specific data for legal services was not included in the data provided, however the committeediscussed that this was a need in the county specifically a need for local providers of free or low-costlegal assistance. The committee explained that for community members to obtain assistance withImmigration or Social Security applications they need to travel far distances to Middlesex or MercerCounty to receive this assistance. It was also noted in the planning meeting that the contrast betweenfree legal assistance and paying for legal assistance, even on a sliding scale fee, was a burden forsome families in the county.The fourth need area identified by the committee was services for families caring for a child of arelative. This need was selected by the committee as it was assumed that kinship care resourcesaren’t well known in the county. There also isn’t a sense of how many Hunterdon County residentsmay be caring for a child of a relative and could benefit from these services.The committee discussed the possibility of a request by the focus group participants to discuss otherneed areas if the committee would be amenable to this request. It was decided that when the focusgroups are conducted if most of the participants identify other need areas after completing thesurvey, that the focus group facilitator would adjust the focus areas before asking the need areaquestions. Using this adjusted methodology, the four highest need areas as determined by the DCFsurvey responses were: 1. Housing, 2. Healthcare, 3. Behavioral/Mental Health Services for Childrenand 4. Behavioral/Mental Health Services for Adults.The data provided by Rutgers highlighted two areas of concern regarding transportation. The firstconcern is the average commute time to work. The second concern is the cost of transportationcompared to the average income in the county. The committee group members decided not toidentify this specific need area as committee members recognized that this issue would most likely bebrought up during each focus group session as transportation impacts the other identified areas andcontinues to be a barrier for low income residents in the county.13
The four need areas selected by the county to be the focus areas and primary topics in the qualitativedata (e.g. focus groups and key informant interviews) collection included:1. Housing2. Health Care3. Behavioral/Mental Health Services for Children4. Behavioral/Mental Health Services for AdultsFocus GroupsIn an effort to implement a uniform needs assessment approach across counties to support statewidetrend analysis, DCF required HSACs to conduct a series of focus groups. The purpose of the focus groupswas to collect qualitative information to better understand the scope, nature and local context relatedto addressing community needs that influence families.Focus groups sessions were scheduled for approximately one and half hours with the first thirtyminutes being designated for introductions and survey completion and the remaining hour beingdesignated for the focus group dialogue. In each focus group session, participants were asked tocomplete a standard survey to gather data about the key topic areas outlined in the aforementioneddata profiles. The survey was developed to identify areas of strength and areas in need of improvementrelated to county-based supports and service array. The survey consists of demographic data andapproximately 10 questions related to each of the eleven basic and service needs. Six of the questionsare based on a five-point Likert scale ranging from Strongly Disagree to Strongly Agree.Upon completion of the surveys, the focus group participants were asked to transition into the dialoguecomponent of the session. The dialogue requirement was intended to allow participants to highlighttheir experiences and perceptions as community members and provide opportunity for a deeperdiscussion and assessment of top barriers in each area of need. Group members discussed two selectedbasic and service need priority areas. Facilitators use a structured protocol to explain the purpose,goals, confidentiality and informed consent and objectives of the focus group.Recruitment.The HSAC Planning and Integration Committee agreed that the group would host the first focusgroup with HSAC members who are also Human Services Providers. The committee also discussed theDCF needs assessment during other county wide meetings so that the community members wereaware of the goals of the focus groups. Outreach was made via letters and emails to key partners inthe community who have direct connections to community members who have DCP&P involvementor CSOC involvement. Outreach was also made by the Human Services Administrator to County14
Administration, Office of Emergency Management staff, and the Chamber of Commerce to assist inmaking connections with community partners. Outreach was made by committee members whohave relationships with Youth organizations.Focus Group Participants. A total of 8 focus groups were conducted in this county as part of this needsassessment. These focus groups were conducted from December 11, 2019 to November 6, 2020. Therewas a total number of 40 participants. The number of participants in each focus group ranged from aminimum of 3 and a maximum of 10 participants. During the focus group sessions, a total of 56 surveyswere completed.Key Informant InterviewsKey informant interviews were conducted to gather additional feedback from County Human ServicesDirectors and other identified individual selected by the HSACs regarding considerations for addressingthe needs and concerns that were highlighted in the data profiles and focus group sessions. Facilitatorsuse a structured protocol to explain the purpose, goals and objectives of the focus group.Recruitment.Key Informants were approached by the Human Services Administrator and were invited tovoluntarily participate in the interview.Key Informant Interview Participants. A total of 2 interviews were conducted in this county as part ofthis needs assessment. The total number of participants included was 2. These interviews wereconducted from July 16, 2020 to August 18, 2020. There was a total of 2 surveys completed during theinterview sessions.Participant DemographicsAs described in the above sections, both focus group and interview participants completed the needsassessment survey. Below we combine information for all participants to provide an overview of theparticipant demographics.15
Role in the Community (not mutually exclusive)County ResidentStaff or Volunteer with a Community-Based Organization (e.g., Health andHuman Services providers, Planning Board Participants)Staff or Volunteer with a Public Service Organization (e.g., paramedics, firefighter, police officers, air force, judges)Local Business Owner in the CountyCommunity leader and advocate in the county (e.g., hold a volunteer office,clergy, activist)OtherNumber ofParticipants41262363AgeUnder 1818-2425-3435-4445-5455-6465 and overNumber , third gender/transgenderPrefer Not to SayOtherNumber ofParticipants488000RaceAmerican Indian or Alaska NativeAsianBlack or African-AmericanNative Hawaiian or Other Pacific IslanderWhite or CaucasianMulti-Race (2 or More of the Previous)OtherNumber ofParticipants11704322EthnicityHispanic, Latino or Spanish OriginsNo Hispanic Latino or Spanish OriginsNumber ofParticipants64416
Number ofParticipants02461628Education LevelGrades Preschool-8Grades 9-12-Non-GraduateHigh School Graduate or
Hunterdon County is the 8th largest county in New Jersey at 430 square miles, but is the 4th smallest percent males). Many parts of the county have retained a rural quality; however, the county has seen significant growth in the past decade. The latest American Community Survey reported that the median age in Hunterdon County was 46.2 years.
