Transcription
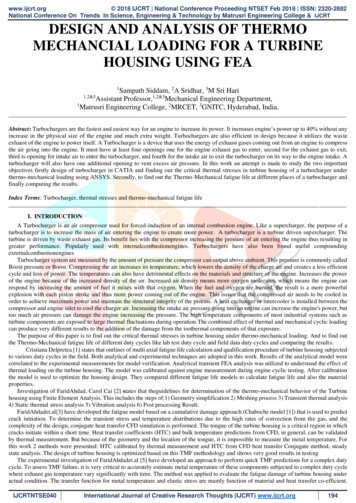
www.ijcrt.org 2018 IJCRT National Conference Proceeding NTSET Feb 2018 ISSN: 2320-2882National Conference On Trends In Science, Engineering & Technology by Matrusri Engineering College & IJCRTDESIGN AND ANALYSIS OF THERMOMECHANCIAL LOADING FOR A TURBINEHOUSING USING FEA1Sampath Siddam, 2A Sridhar, 3M Sri Hari1,2&3Assistant Professor,1,2&3Mechanical Engineering Department,1Matrusri Engineering College, 2MRCET, 3GNITC, Hyderabad, India.Abstract: Turbochargers are the fastest and easiest way for an engine to increase its power. It increases engine’s power up to 40% without anyincrease in the physical size of the engine and much extra weight. Turbochargers are also efficient in design because it utilizes the wasteexhaust of the engine to power itself. A Turbocharger is a device that uses the energy of exhaust gases coming out from an engine to compressthe air going into the engine. It must have at least four openings one for the engine exhaust gas to enter, second for the exhaust gas to exit,third is opening for intake air to enter the turbocharger, and fourth for the intake air to exit the turbocharger on its way to the engine intake. Aturbocharger will also have one additional opening to vent excess air pressure. In this work an attempt is made to study the two importantobjectives firstly design of turbocharger in CATIA and finding out the critical thermal stresses in turbine housing of a turbocharger underthermo-mechanical loading using ANSYS. Secondly, to find out the Thermo-Mechanical fatigue life at different places of a turbocharger andfinally computing the results.Index Terms: Turbocharger, thermal stresses and thermo-mechanical fatigue lifeI. INTRODUCTIONA Turbocharger is an air compressor used for forced-induction of an internal combustion engine. Like a supercharger, the purpose of aturbocharger is to increase the mass of air entering the engine to create more power. A turbocharger is a turbine driven supercharger. Theturbine is driven by waste exhaust gas. Its benefit lies with the compressor increasing the pressure of air entering the engine thus resulting ingreater performance. Popularly used with internalcombustionengines. Turbochargers have also been found useful compoundingexternalcombustionenginesTurbocharger system are measured by the amount of pressure the compressor can output above ambient. This pressure is commonly calledBoost pressure or Boost. Compressing the air increases its temperature, which lowers the density of the charge air and creates a less efficientcycle and loss of power. The temperatures can also have detrimental effects on the materials and structure of the engine. Increases the powerof the engine because of the increased density of the air. Increased air density means more oxygen molecules, which means the engine canrespond by increasing the amount of fuel it mixes with that oxygen. When the fuel and oxygen are burned, the result is a more powerfulexplosion with each piston stroke and thus more power coming out of the engine. This issues that the compressed air needs to be cooled inorder to achieve maximum power and maintain the structural integrity of the pistons. A heat exchanger or intercooler is installed between thecompressor and engine inlet to cool the charger air. Increasing the intake air pressure going into an engine can increase the engine's power, buttoo much air pressure can damage the engine increasing the pressure. The high temperature components of most industrial systems such asturbine components are exposed to large thermal fluctuations during operation.The combined effect of thermal and mechanical cyclic loadingcan produce very different results to the addition of the damage from the isothermal components of that exposure.The purpose of this paper is to find out the critical thermal stresses in turbine housing under thermo-mechanical loading. And to find outthe Thermo-Mechanical fatigue life of different duty cycles like lab test duty cycle and field data duty cycles and comparing the results.Cristiana Delpretea [1] states that outlines of multi axial fatigue life calculation and qualification procedure of turbine housing subjectedto various duty cycles in the field. Both analytical and experimental techniques are adopted in this work. Results of the analytical model werecorrelated to the experimental measurements for model verification. Analytical transient FEA analysis was utilized to understand the effect ofthermal loading on the turbine housing. The model was calibrated against engine measurement during engine cyclic testing. After calibrationthe model is used to optimize the housing design. They compared different fatigue life models to calculate fatigue life and also the materialproperties.Investigation of FaridAhdad, Carol Cai [2] states that theguidelines for determination of the thermo-mechanical behavior of the Turbinehousing using Finite Element Analysis. This includes the steps of:1) Geometry simplification 2) Meshing process 3) Transient thermal analysis4) Static thermal stress analysis 5) Vibration analysis 6) Post processing Result.FaridAhdadet.al[3] have developed the fatigue model based on a cumulative damage approach (Chaboche model [1]) that is used to predictcrack initiation. To determine the transient stress and temperature distributions due to the high rates of convection from the gas, and thecomplexity of the design, conjugate heat transfer CFD simulation is performed. The tongue of the turbine housing is a critical region in whichcracks initiate within a short time. Heat transfer coefficients (HTC) and bulk temperature predictions from CFD, in general, can be validatedby thermal measurement. But because of the geometry and the location of the tongue, it is impossible to measure the metal temperature. Forthis work 2 methods were presented: HTC calibrated by thermal measurement and HTC from CFD heat transfer Conjugate method, steadystate analysis. The design of turbine housing is optimized based on this TMF methodology and shows very good results in testingThe experimental investigation of FaridAhdadet.al [5] have developed an approach to perform quick TMF predictions for a complex dutycycle. To assess TMF failure, it is very critical to accurately estimate metal temperature of these components subjected to complex duty cyclewhere exhaust gas temperature vary significantly with time. The method was applied to evaluate the fatigue damage of turbine housing underactual condition. The transfer function for metal temperature and elastic stress are mainly function of material and heat transfer co-efficient.IJCRTNTSE040International Journal of Creative Research Thoughts (IJCRT) www.ijcrt.org194
www.ijcrt.org 2018 IJCRT National Conference Proceeding NTSET Feb 2018 ISSN: 2320-2882National Conference On Trends In Science, Engineering & Technology by Matrusri Engineering College & IJCRTThermal and elastic stress analytical methods were component with FE approach for complex geometry and duty cycle. From the comparisonstudy result from analytical method are matching quite with FE results. The Elastic-plastic stress was determined by Glinka method which isbased on strain energy density. Turbine Housing of turbocharger has been considered which a quite expensive component operating at a veryhigh temperature. The life prediction show that the tongue region will start to fail only after 87000 kilometers.II. FINITE ELEMENT MODEL GENERATIONThe Finite element method is the dominant discretization technique in structural mechanics. The basic concept in the physical interpretationof the FEM is the subdivision of the mathematical modal into non-overlapping components of simple geometry called finite elements orelements for short. The response of each element is expressed in terms of a finite number of degrees of freedom characterized as the value ofan unknown function at a set of nodal point.The response of the mathematical model is then considered to be approximated by that of the discrete model obtained by connecting orassembling the collection of all elements. The disconnection-assembly concept occurs naturally when examining many artificial and naturalsystemsi)Element TypeFinite element method generationwill generate a finite element mesh of node and geometric element type. These geometric element typesare relative to the ANSYS element name via an element variant number. The element variant mapping for ANSYS may be displayed by usingthe FEMGEN.a)Element used for Thermal AnalysisSOLID 87 (3-D 10-Node Tetrahedral Thermal Solid)Figure 1shows the element typeSOLID 87 is well suited to irregular meshes the element has element has one degree of freedom,temperature, at each node. The element is applicable to 3-D, Steady-State or transient thermal analysis.Figure1: SOLID 87 Element Typeb)Element used for Structural AnalysisSOLID 92 (3-D 10-Node Tetrahedral Structural Solid)Figure 2 show the element type SOLID 92 have a quadratic displacement behavior and are well suited to model irregular meshes. Theelement is defined by ten nodes having three degrees of freedom at each node: translations in the x, y, and z directions. Temperature andfluencies may be input as element body loads at the nodes. The element also has plasticity, creep, swelling, stress stiffening, large deflection,and large strain capabilities.Figure 2: 3D 10-node Tetrahedral Solid Element TypeIII. EXPERIMENTAL APPROACHa)METHODOLOGYFigure 3: Methodology for thermo mechanical fatigue lifeIJCRTNTSE040International Journal of Creative Research Thoughts (IJCRT) www.ijcrt.org195
www.ijcrt.org 2018 IJCRT National Conference Proceeding NTSET Feb 2018 ISSN: 2320-2882National Conference On Trends In Science, Engineering & Technology by Matrusri Engineering College & IJCRTFigure 3shows the methodology followed to find out the Thermo-Mechanical Fatigue life. This fatigue life is nothing but the number ofcycles required to initiate the crack in the component.b) THERMAL FATIGUE LIFE PREDICATION FOR TURBINE HOUSINGOne of the root causes of the engine performance loss is failure of the turbine housing, which is mainly due to the transient thermal loadingfrom the inlet exhaust gas. The cyclic stress generated under cyclic loading varies with temperature. In general, the traditional way to optimizethe design of the turbine housing is based on FE MethodThis involves: 3D FE Mesh generation of Turbine housing, Thermal Analysis with boundary conditions such as heat transfer coefficient and bulk temperature to predict metaltemperatures under transient condition Transient Metal temperature is used as an input for elastic plastic analysis.The turbine housing of turbocharger is mounted on Diesel Engine and is made up of Ductile Iron material. FE analysis carried out assumingunder free conditions with no effect of the external load [6].Material PropertiesChanges in temperature can significantly vary the material properties. Therefore, both the high and low temperature extremes associatedwith the application should be considered. For applications subjected to large temperature variation, you'll need to take into account thedimensional change when assembled/bound with other materials of different coefficient of thermal expansion. Following factors that need tobe considered when the operating temperatures are above normal room temperature. Part dimensions increase proportional to length,temperature increase, and coefficient of thermal expansion and contraction. Strength and modulus will be lower than at room temperatureshows that strength decreases with increasing temperature. Material may exhibit a rubber-like behavior with low modulus and high degree ofdrawing. The material properties are changes with the temperature such as yield stress, young’s modules and poison ratio.Thermal Analysis:Finite element Model is imported to ANSYS to change element type from SOLID 92 to SOLID 87 for TETRA element with Thermalboundary conditions. The thermal boundary conditions applied at the different parts of the housing is tabulated in table 1. These data can beobtained from determined utilizing information regarding the flow velocities inside the volu11te as determined by computational fluiddynamics analysis or turbine gas temperatures measurements calibrated from tests. The material properties utilized in this analysis were inputas a function of temperature as shown in tableTable1: Thermal Boundary ConditionsSl.NoComponent12345Inlet VoluteWheel ContourOutlet SectionA-SurfaceExternalConvectionCoefficient(W/m2 C)90050050015050The thermal simulation solutions enable to model thermal response including all the modes of heat transfer which could be affecting theresponse simultaneously. The object of the thermal study is often to understand thermal response of the structure. Meshing quality and densitywill have an influence on the final stress value and deformation. A refined mesh grid should be created in order to obtain an accurate result,especially in the following region: Regions of large stress gradient, such as the area around the tongue Stress concentration regions, such as at a locating pin hole Regions which cracked or failed during the testing or application process Other regions, such as on a contact surface.If there is an external pressure load applied, it is better to use a mapped mesh. Once the loads are applied on the nodes, this will help toeliminate the extra moment caused by the force loads. Another important issue is to select the thermal component when doing the mesh. TheANSYS default requires that the maximum strain increment occurring within one load step not exceed 15%. Thus, during a large temperatureor stress gradient time period, more load steps are recommended in order to aid the convergence. Time point density should be moreconcentrated during time periods when plasticity is likely to occur.IV. RESULTS4. 1 Thermal PlotsThermal results are presented with the following guidelines:1. Temperature distribution at different time point and different angle of view, particularly to show the Maximum Temperatureof the component.2. Figure 4.1 shows temperature for lab test duty cycle.3. Figure 4.2 shows temperature for City road duty cycle.4. Figure 4.3 shows temperature for Motorway road duty cycle.5. Figure 4.4 shows temperature for Country road duty cycle.6. All the values have been scaled to 0-100.IJCRTNTSE040International Journal of Creative Research Thoughts (IJCRT) www.ijcrt.org196
www.ijcrt.org 2018 IJCRT National Conference Proceeding NTSET Feb 2018 ISSN: 2320-2882National Conference On Trends In Science, Engineering & Technology by Matrusri Engineering College & IJCRTFigure 4.1: - Thermal Plot for Lab Test Duty CycleFigure 4.2: - Thermal Plot for City Road Duty CycleFigure 4.3: - Thermal Plot for Motorway Road duty CycleFigure 4.4: - Thermal Plot for Country Road duty Cycle4. 2 Structural Analysis Plots:Elasto-Plastic structural analysis results are presented with stress distribution plots for Von-Mises Stress and Plastic Strain. The viewsare taken with special care to clearly show critical regions that exceed material strength which are likely to fail due to TMF. For non-linearanalysis, plastic strain intensity plots are generated.4. 3 Von-Mises Stress plotsFigure 4.5 shows the Von-Mises stress plots represents the beginning of yielding for material due to higher tensile stress the regionrepresents in red color distribution is having higher values and blue color shows the lower yielding stress value. The maximum Von Misesgenerated in the Turbine housing at tongue region because the thickness of the housing is less at that section, and also as the temperaturedistribution was more. We can observe the temperature distribution in the Figure4.1 to Figure 4.4IJCRTNTSE040International Journal of Creative Research Thoughts (IJCRT) www.ijcrt.org197
www.ijcrt.org 2018 IJCRT National Conference Proceeding NTSET Feb 2018 ISSN: 2320-2882National Conference On Trends In Science, Engineering & Technology by Matrusri Engineering College & IJCRTFigure 4.5: Von-Mises stress Plot4.4 Plastic Strain Intensity Plot:The figure 4.6 shows the plastic strain in the turbine housing due to thermo-mechanical fatigue. From the figure we can find the strain ismax is at the tongue region, which is named as Location: 1. and also other regions where plastic strain may occur are also considered. Thoselocations are named as Location: 2 and Location: 3, which are considered at neck regions. As there is an abrupt change in geometry stressesmay occur at these locations also.Figure 4.6: - Plastic Strain PlotV. CONCLUSIONSThe fowling studies were performed on the turbine housingwith the objective to find the Thermo-Mechanical Fatigue life of different dutycycles and to find out the most severe duty cycle. In this study we mostly concentrated mostly on TMF life calculation not on optimization asit requires Computational Fluid Dynamic analysis over the flow of exhaust gas.1. 3D Thermal, Elastic and Plastic FEA Analysis of the housing with different duty cycles.2. Stress distribution over the component with comparison of temperature.3. Thermo-Mechanical Fatigue life calculation by using Chaboche Model for all duty cycles.5.1 Lab test duty cycleThe figure 4 has shown the comparision of stress distribution, temperature and time. It was obsorbed from the figure that the out-Phasetype loading where, as the temperature increases the 3 rd principal stress dominates compared to 1st principal stress. Signed Von-Mises stresswas used to predict the life as there is a change in shift in between 1 st principal stress and 3rd principal stress.Figure 5.1: 1-Stress Distribution lab test duty cycleCity road duty cycleThe figure 5 has shown the comparision of stress distribution, temperature and time. It was obsorbed from the figure that the out-Phasewhere, as the temperature increases the 3rd principal stress dominates compared to 1 st principal stress. Here all the values are scaled between0-100 and the maximum temperature was 5000C.IJCRTNTSE040International Journal of Creative Research Thoughts (IJCRT) www.ijcrt.org198
www.ijcrt.org 2018 IJCRT National Conference Proceeding NTSET Feb 2018 ISSN: 2320-2882National Conference On Trends In Science, Engineering & Technology by Matrusri Engineering College & IJCRTFigure 5.2: 2 Stress Distribution a City road cycleMotorway road duty cycleThe figure 6 has shown the comparision of stress distribution, temperature and time. It was obsorbed from the figure that the observe OutPhase where, as the temperature increases the 3rd principal stress dominates compared to 1st principal stress. Here all the values are Scaledbetween 0-100 and the maximum temperature was 500 0 C.Figure 5.3: 3-Stress Distribution Motorway road cycle5.2. Duty CyclesLab Test Duty Cycle: Graph: 5.1 shows the thermal duty cycle with respective time period. The total cycle time is 800 Sec. Out of thatfirst 70% will be continuous heating then there will be sudden change i.e. cooling phase will happen. The remaining 30% will be alterationsof the phases are applied. The maximum temperature of the heating phase is 800c and the minimum temperature at cooling phase is 200c.Inorder to get exact regions where plastic strain is occurring we considered this much phase differGraph: 5.4-Lab Test Duty CycleField Data Duty Cycles:The following graphs shows the different field duty cycles which are obtained from different road conditions, like City road, Motorwayroad and Country road. The maximum time points in these graphs are 800Sec and the Temperature points also 800Deg C. Exhaust GasTemperature over a period of time can be observe in the following Charts for various road conditions.City RoadGas h: 5.5-Exhaust Gas temperature at City roadIJCRTNTSE040International Journal of Creative Research Thoughts (IJCRT) www.ijcrt.org199
www.ijcrt.org 2018 IJCRT National Conference Proceeding NTSET Feb 2018 ISSN: 2320-2882National Conference On Trends In Science, Engineering & Technology by Matrusri Engineering College & IJCRTMotorway RoadGas h: 5.6-Exhaust Gas temperature at Motorway roadCountry RoadGas h: 5.7-Exhaust Gas temperature at Country road5.3 .FATIGUE LIFE CALCULATIONThe life estimation of the components before crack initiation is calculated by Chaboche’s fatigue model. The causes of cracks duringthermal shock testing are low cycle fatigue. If the plastic strain is not varying during the cycle, the material behavior is in the high cycle fatigueregime, where as if plastic strain varies through the cycle, the material behavior is in the low cycle fatigue regime. For design optimization theanalyst and designer should minimize the plastic strain amplitude and the tensile stress, when it is occurred at high temperature, as much aspossible. Hence we need to normalize or the Signed Von-mises the stress with the tensile strength, evaluated at the instantaneous metaltemperature, throughout the thermal cycle. The Closer to UTS the elasto -plastic stress is, the shorter the expected life. But the Chaboche’smodel is a stress based model, this bilinear kinematic property of material shows that, if there is a small change in stress creates large changein strain. That result would not be a realistic one.Analytical Equation for Fatigue life calculationChaboche’s fatigue damage model is proposed with normalized stress concept of constant amplitude is given byNf WhereSu* S max S S max . (1) S max Sl CnorS . (2)SU (T ) SU (T )S max max .(3) . (4)Sl (S ) Sl 0 1 bnor S / Su (5)Cnor (S ) Cnor 0 1 b'nor S / SuEquation 1 to Equation 5 represents the formulation to calculate fatigue life (Nf). In equation.2 SU(T) represents ultimate tensile strengthat instantaneous temperature, as the material properties was changing with temperature mean stress was divided by ultimate tensile strength.Such as Lab Test duty cycle, City road duty cycle, Motorway road duty cycle . Out of all field data duty cycles Country road duty cycle wasmore severe. From these results we can say that the damage due to lab test duty cycle is the percentage distribution was 40% of Country road30% of City road and 30% of Motorway road duty cyclesTable 2: Fatigue life resultsIJCRTNTSE040Sl.noDuty CycleLocation: 1Location : 2Location: 31.Lab Test2.54E031.52E042.68E042.3.City RoadMotorway rnational Journal of Creative Research Thoughts (IJCRT) www.ijcrt.org200
www.ijcrt.org 2018 IJCRT National Conference Proceeding NTSET Feb 2018 ISSN: 2320-2882National Conference On Trends In Science, Engineering & Technology by Matrusri Engineering College & IJCRTThermo-mechanical analysis on turbine housing of turbocharger suggested high thermal stresses occurring at tongue region of volute.Thermo-mechanical fatigue life was calculated and compared at the regions where plastic strain is occurring for different field data duty cycles.Fatigue life results show Country road duty cycle is more severe than the other field data duty cycles like City road and Motorway road.A lab test duty cycle was predicted in such a way that the sum of damage percentage of each field data duty cycle match to it1.Study onchange in material properties of turbine housing.Shape optimization of tongue region to reduce stresses, but it is dependent on aerodynamic performance of the turbocharger.VI. REFERENCES[1][2][3][4][5][6]Cristiana Delpretea, “Multi axial damage assessment and life estimation: application to an automotive exhaust manifold”.Farid AHDAD, Carol CAI, “Finite Element Analysis of Turbine Housing”, Honeywell Turbo Technologies, NUMBER EDI00423, REVISION 2, PP. 7-16, Date Published: 08-10-2007Michal Vajdak, “Thermal Stress Analysis of Turbine Housing”, Honeywell Turbo Technologies, NUMBER 06-0854, REVISIONA, Date Published: 12-11-2006MickaelCormerais, Pascal Chesse, Jean-Francois Hetet, “Turbocharger Heat Transfer Modeling Under Steady and TransientConditions”, Int. J. of Thermodynamics, Vol. 12 (No. 4), PP. 193-202, Date Published: December 2009Dr. Farid AHDAD, RagupathyKannusamy, Damodharan B., “Analytical Approach of TMF Prediction for Complex Loading”,Honeywell Turbo Technologies, NUMBER GT2010-23440, PP 3-10, Date Published: June 14-18, 2010Dr. Farid AHDAD, RagupathyKannusamy, Damodharan B., “Analytical Approach of TMF Prediction for Complex Loading”,Honeywell Turbo Technologies, NUMBER GT2010-23440, PP. 3-10, Date Published: June 14-18, 2010IJCRTNTSE040International Journal of Creative Research Thoughts (IJCRT) www.ijcrt.org201
National Conference On Trends In Science, Engineering & Technology by Matrusri Engineering College & IJCRT IJCRTNTSE040 International Journal of Creative Research Thoughts (IJCRT) www.ijcrt.org 196 Figure 3shows the methodology followed to find out the Thermo-Mechanical Fatigue life. This fatigue life is nothing but the number of