Transcription
EmployeeExperiencePlaybookUse cases for Workplace AnalyticsApril 2021
Workplace Analytics users (project lead and analysts) who plan to explore thebusiness values and kick off analysis projects for employee experienceNote: Playbook content is designed for users with a basic level of understanding of WorkplaceAnalytics PrimaryusersWorkplace Analytics service delivery partners who plan to deliver serviceengagements for boosting employee experienceNote: Partners are expected to be badged before accessing and utilizing the playbook contentIntendedaudience Microsoft Sales, external sales partners, or others who hope to learn how to useWorkplace Analytics for employees’ experience analysisNote: This is not intended to be a “scoping document” for service offeringsNotes The playbook showcases the art of the possible and how to use the latest thinking andanalysis with Workplace Analytics data to boost your employees’ experience. High-level guidance and considerations for running projects and analysis. Thisplaybook is not intended to be a technical how-to guide. For how-to instructions, seeWorkplace Analytics training resources or reach out to your Workplace Analyticssupport team.2
IntroductionGenerating insightsTable ofcontents Improve ways of working Protect employee wellbeing Boost managerial excellence Enable teaming and networksAugmenting analysis with engagement survey dataFrom insights to actionAppendix Project guidelines Survey data integration Sample analysis3
Introduction4
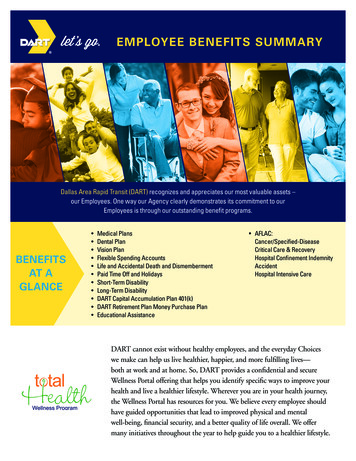
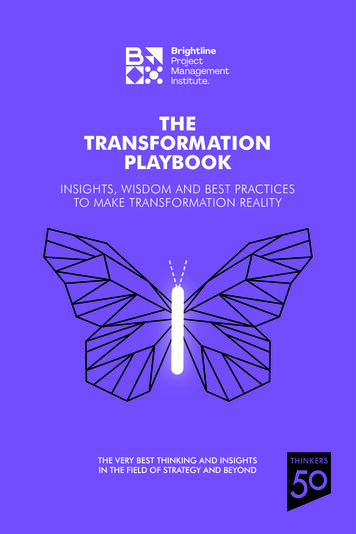
Employee experience consists of all aspects of an employee’s hPurposeSix key elements of a great employee experience that affect theirengagement with work and their overall job satisfaction5
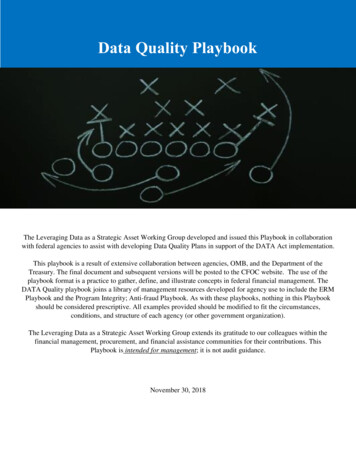
Why is employeeexperience important?WellbeingStrongly related to company outcomesResearch shows that companies that score in the top 25% onemployee experience report three times the return on assets andtwice the return on sales of companies in the bottom quartile1EmpowermentConnectionPredictive of lower turnoverIn high-turnover organizations, teams in the top quartile for employeeengagement see 25% lower turnover than bottom quartile teams; inlow-turnover organizations, the difference is a massive 65%2GrowthFocusFoundational to strong culture“Experiential organizations” (companies whose employees rate themhighly on cultural, technological, and physical environment) appear11.5 times as often in Glassdoor’s Best Places to Work3Purpose1 “The Financial Impact of a Positive Employee Experience”, IBM Smarter Workforce Institute 20182 “How Employee Engagement Drives Growth”, Gallup 20133 “Why the Millions We Spend on Employee Engagement Buy Us So Little”, HBR 20176
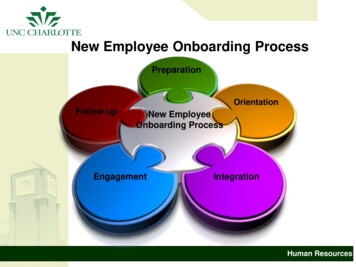
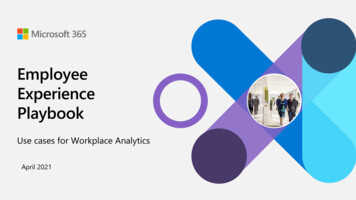
Workplace AnalyticsActionable insights to manage employee experience strategicallyNativeMicrosoft 365 dataStart with aggregatedbehavioral data fromeveryday work incollaboration tools OrganizationalcontextMap behavioral data toorganizationalattributes to revealcollaboration patterns SurveydataBring in other datasources to connectcollaboration patternsto business outcomes ActionableinsightsUse powerful insights tomake better businessdecisions and transformyour organizationWorkplace Analytics provides flexible privacy controls for data access and usage and compliance to help you protect your data7
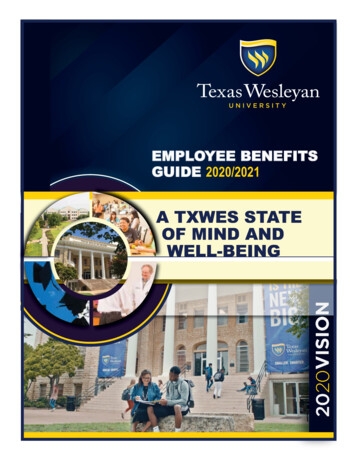
Transform workplaceDriving changewith WorkplaceAnalyticsScale successful interventions,observe the spread ofbehaviors, and adapt changeprograms based on learnings4A continuous andexperimental datadriven process thatcultivates a culture ofchange and leads tosuccessGenerate insightsOperationalizePilot interventions and utilizedashboards to monitorchange while maintaining apulse on the behaviors of theoverall organization1WorkplaceAnalytics dataand qualitativecontext3Quantify the impact of employeeand team actions on employeeexperience and identify areas toimprove2Design interventionsBridge the gap betweenrecommendations and changeby developing interventionsthat enable workers to adoptnew behaviors8
Generating insights9
Four core pillars you can analyze and develop with Workplace Analyticsto improve overall employee experienceImproveways of workingProtect employeewellbeingBoost managerialexcellenceEnable teamingand networksHow can we improve theway work gets done toshape the day-to-dayemployee experience?What specific behaviorscan be encouraged toimprove employeework-life balance?What managerial practicesshould be tackled toimprove support andempowerment?How can workplacesocial networks beimproved to boost asense of community?10
Pillar 1Improve ways of working11
Improve ways of working: Value propositionOrganizational leaders ask Are teams spending theirtime efficiently? Is collaboration load anissue? Do employees have time tofocus on their mostimportant work? How is remote workingaffecting the way we getthings done? Are we agile at makingdecisions?What we’ve learned from the researchRemote Managers Are Having Trust Issues40% of managers expressed low self-confidence intheir ability to manage workers remotelyBurnout is reaching epidemic proportions80% of time spent in meetingsor answering colleagues’ requestsIt’s a systems problem, not a personal problem81-95% of individuals concurrently workin more than one teamSources: Emerging From the Crisis, Harvard Business Review 2020 Collaborative Overload, Harvard Business Review 2016 The Overcommitted Organization, Harvard Business Review 201712
Improve ways of working: Themes and thought startersThemeAnalysis questions How much time is spent in collaboration each week?Capacity Are employees in control of their calendars? Do employees have focus time to get work done?Agility Are meetings efficient and adequate for theirintended objectives? Are employees communicating efficiently? Are teams engaged at the right time in a project?Decisionmaking Are stakeholders available to make key decisions? Is there room to optimise rhythm of business meetings? Are teams prioritizing the right projects?Ways of working assessment in Power BI13
Improve ways of working: Example analysesCapacityAgilityWhat does a typical workweek look like?How much time are teams spending indifferent types of meetings?Are employees in control of their calendars?Are teams using the most efficient channelsfor communication?Decision makingIs there room to optimise rhythm of businessmeetings?Are stakeholders available to make keydecisions?14
Improve ways of working: Key Workplace Analytics metricsThemeMetricCollaboration hoursWhy it mattersAre individuals spending too much oftheir time in collaboration, leaving notime for heads-down work?Too much collaboration (more than50% of the work week) reduces theability to get focused work doneTime in selforganized meetingsNumber of hours spent in meetingsorganized by the person with atleast one other personAre employees able to maintaincontrol over their calendars or is itprimarily dictated by outside forces?Higher level of control over calendarsenables employees to remainengaged and empowered throughincreased autonomyLong or largemeetingsNumber of hours the person spentin meetings with 19 attendees orthat lasted more than one hourAre individuals primarily in smallgroup, decision-making meetings orin less-effective large or longmeetings?Meetings with 19 attendees orover 1 hour long are less likely to behigh-quality, decision-makingmeetingsEmails sent to up to 5recipientsNumber of emails the person sendswhere the recipient ranges from 1-5Could employees migrate some emailactivity to faster channels ofcommunication (such as Teams)?Teams chats and unscheduled callsallows employees to get quicker andmore direct answersRhythm of businessmeeting hoursHours spent in meetings thatinclude the keywords that indicaterhythm of business meetingsIs there room to optimize rhythm ofbusiness meetings?Reducing time spent in rhythm ofbusiness meetings creates capacityfor more decision-making meetingsOpen one-hourblocksNumber of one-hour blocks in theperson’s calendar without meetingsduring the workdayHow long would it take to get teammembers to attend a meeting andmake a decision?Blocked calendars can create longdelays in projects if people aren’table to attend meetingsAgilityDecisionmakingWhat to look forNumber of hours the person spentin meetings, in IMs, and on email Email and IM hours Meeting hoursCapacityDefinition15
Improve ways of working: Additional resourcesResourceDescriptionWays of working assessment (Power BI)A Power BI dashboard that includes a basic library ofanalyses in the topics of Collaboration culture andEmployee experienceWays of working tracker (Power BI)A Power BI dashboard to help analyst track changes incollaboration over time, and track key indicators toimprove employee wellbeing, meeting culture, andmanager effectivenessVisualization functions (wpa R package)A set of flexible functions enable analysts to createprebuilt visualizations and tables with any WorkplaceAnalytics metric their choiceCollaboration reports (wpa R package)An out of the box report that contains a summary ofmetrics and visualisations relating to collaboration,including time spent in meetings and emails16
Pillar 2Protect employee wellbeing17
Protect employee wellbeing: Value propositionOrganizational leaders askWhat we’ve learned from the research Are our employees facing an‘always on’ culture?The Employee Burnout Crisis Is our culture creating aburnout risk?Burnout is responsible for up 50%of workforce turnover Are our managersencouraging the rightbehaviors? Are long hours a resourceallocation problem?The HappinessAdvantageHigher levels of optimismand social connections,dramatically improvebusiness outcomes Which activities drive afterhours work?Sources: The Employee Burnout Crisis, BusinessWire 2017The Happiness Advantage, 2019 A Primer on MeasuringEmployee EngagementPeople analytics is the tool tounderstand what drivesengagementThe Mystery of theMiserable EmployeesThe issue was overcrowdedmeetingsA Primer on Measuring Employee Engagement, Harvard Business Review (HBR) 2014The Mystery of the Miserable Employees, NY Times 201918
Protect employee wellbeing: Themes and thought Analysis guiding questions Are employees able to balance work and personaltime? Can we identify groups most at risk of burnout? Are employees able to switch off? Are employees embracing flexible work schedules? Are employees able to engage in uninterrupted focustime? Is the organization able to respond to urgent needswithout risking employee wellbeing? Are employees maintaining communities within theworkplace? Are employees interacting informally?Wellbeing Assessment Power BI19
Protect employee wellbeing: Example analysesBalanceFlexibilityResilienceCommunityAre employees able to balancework and personal time?Are employees embracing aflexible work schedule?Are employees able to engagein uninterrupted focus time?Are employees maintainingcommunities in the workplace?Can we identify groups most atrisk of burnout?What are the most commonworking patterns?Can employees respond to urgentneeds without risking wellbeing?Are employees interactinginformally?20
Protect employee wellbeing: Key Workplace Analytics etricDefinitionWhat to look forWhy it mattersAfter hourscollaborationNumber of hours the person spentin meetings, in IMs, and on emailoutside of working hoursAre there employees collaboratingsignificantly outside their regularworking hours?High levels of collaboration afterhours can erode employee moraleand contribute to burnoutWorkweek spanThe time between the person's firstand last email, meeting, call, or chatfor each day of the work weekHow long is the typical workweek?Are pockets employees doingunusually long hours?Long workweek spans can signal alack of personal time for employeesto switch off and rechargeCollaboration hours(by hour of the day)Hours spent in meetings, in IMs, andon email with at least one otherperson, split by hour of the dayHow is collaboration activitydistributed during the day? Areemployees taking breaks?Flexibility is recognised as anecessity for the modern workforceand is linked to boosting morale andperformanceTotal focus hoursTotal number of hours with two ormore one-hour blocks of time wherethe person had no meetingsDo employees have enough time tofocus / do individual work?Meeting-free focus time is key foremployees to be able to completeindividual tasksCollaboration hours(urgent)Hours spent in email that includethe keywords that indicate urgencyGroups that have significant emailactivity labelled as urgent. Thesegroups might be experiencing a verystressful work environment.High levels of urgent collaborationmight indicate a reactive andstressful work cultureMeeting hours(intimate)Number of hours the person spentin meetings with 2 to 5 attendeesDo employees have enoughopportunity to engage with others ona small group setting?A strong support system at work canbe critical for employees’ wellbeingwhen tackling stressful worksituations21
Protect employee wellbeing: Additional resourcesResourceDescriptionVisualization functions (wpa R package)A set of flexible functions enable analysts to create prebuilt visualizations and tables with any WorkplaceAnalytics metric their choiceWorking patterns report (wpa R package)An out-of-the-box report that contains analysis touncover common employee working patters, and howthese evolve over timeFlexibilty score (wpa R package)A score that measures the flexibility of a team or anorganization, based on their flexibility to control when tostart work, flexibility to shift your schedules (takebreaks), and the flexibility to keep hours under control22
Pillar 3Boost managerial excellence23
Boost managerial excellence: Value propositionOrganizational leaders ask What can we learn from ourbest managers? Do we have micromanagers? Are employees receivingenough coaching from theirmanagers? Are managers sufficientlyconnected across their peersto identify opportunitiesand remove barriers? Are managers rolemodeling healthy workingbehaviors?What we’ve learned from the researchManagement is not just a soft skillYou can develop data-drivenmanagement practicesTalent is more scarce than capitalAnd the opportunity cost is much higherIf you multitask during meetings, yourteam will tooManagers are not fully aware of the impacts oftheir behaviorsSources: What great managers do daily, HBR 2016 What if companies managed people as carefully as they manage money, HBR 2017 If You Multitask During Meetings, Your Team Will Too, HBR 201824
Boost managerial excellence: Themes and thought startersThemeAnalysis guiding questionsCoach Are employees receiving sufficient coaching time withtheir managers? Is manager workload an issue?Empower Are managers balancing oversight with employeeempowerment and autonomy? How are manager working styles impacting employeeempowerment, workflows and trust?Connect Do managers have a large, diverse and influentialnetwork to enable and support their teams? Do well-connected and influential managers havewell-connected teams?Model Are managers modeling good work/life balance? What manager workstyles exist across the company?Manager effectiveness assessment in Power BI25
Boost managerial excellence: Example analysesCoachEmpowerConnectModelAre managers spending enoughtime in 1:1s with their teams?Are managers coaching andempowering their direct reports?Do managers have the networks toenable and support their teams?Do managers model good worklife balance?Does managing more peoplelead to insufficient coaching?Are managers providing visibilityto leadership for their directs?What impact does a manager’snetwork have on their employees?Which manager working stylesexist across the company?26
Boost managerial excellence: Key Workplace Analytics metricsThemeMetricDefinitionWhat to look forWhy it mattersCollaboration hours(managers)Number of hours managers spent inmeetings, in IMs, and on emailDo managers have enough time tocoach their direct reports?Overloaded managers will find itchallenging to devote time to coachtheir direct reportsMeeting hours withmanager 1:1Number of meeting hours involvingonly the person and their managerAre employees receiving sufficientcoaching time with their manager ina 1:1 setting?Lack of regular check-ins betweenmanagers and their directs mightnegatively impact engagementMeeting hours withmanagerNumber of meeting hours whereattendees included at least theperson and their managerAre managers spending too muchtime in meetings with their directreports?There is an opportunity to empoweremployee autonomy throughreducing manager co-attendanceInternal network sizeNumber of people within thecompany with whom the person hadat least two meaningful interactionsin the last four weeksAre managers widely connectedacross the organization? Are theirconnecting their team members?Employees with managers that actas “connectors” typically have higherengagement scoresInfluence scoreA numeric score that indicates howwell connected a person is withinthe companyAre managers connected with keydecision makers?Best connected managers can bemore effective at untappingopportunities and driving teamengagement.After hourscollaborationNumber of hours the person spentin meetings and on email outside ofworking hoursAre managers working excessivelyafter-hours, potentially modeling thewrong behaviors to their team?Managers that frequently work latesignal an expectation of similarbehavior from their teamsCoachEmpowerConnectModel27
Protect employee wellbeing: Additional resourcesResourceDescriptionVisualization functions (wpa R package)A set of flexible functions enable analysts to create prebuilt visualizations and tables with any WorkplaceAnalytics metric their choice.Coaching report (wpa R package)An out-of-the-box report that contains a summary ofmetrics and visualizations relating to key coachingmetrics, including 1:1 time and time spent betweenmanagers and their direct reports.28
Pillar 4Enable teaming and networks29
Enable teaming and networks: Value propositionOrganizational leaders ask Do employees have theconnections needed tosupport their ideas and/orproblem solve? Which groups of employeesplay key roles in the networkas influencers or bridges?What we’ve learned from the researchConnections play a centralrole in fostering purposeand well-beingPeople, not the job, lead tocareerfulfillment What informal communitiesexist within theorganization?Relationships canexplain workplaceperformanceLooking at attributes alonewill take firms only so farSources: To Be Happier at Work, Invest More in Your Relationships, HBR 2019 Better People Analytics, HBR 201830
Enable teaming and networks –Themes and thought startersThemeConnectivityAnalysis guiding questions Are there opportunities to bring specific groupscloser? Is the collaboration culture hierarchical or flat?Influence Which groups of employees play key roles in thenetwork as influencers or bridges?Networks Are employees with different skills interacting tospread skills and innovate? What informal communities exist within theorganization?Onboarding Do employees build the connections needed toquickly come up to speed? Do managers spend time with new hires to acceleratethe process?31
Enable teaming and networks: Example analysesConnectivityInfluenceNetworksOnboardingAre there opportunities to bringspecific groups closer?What roles are best connectedin the organization?Are employees with key skillsinteracting sufficiently?Are new employees quicklycoming up to speed?How common are interactionsbetween levels?How is influence distributedacross the organization?What informal communitiesexist within the company?Are managers spending enoughtime with new hires?32
Enable teaming and networks: Key Workplace Analytics initionWhat to look forWhy it mattersNetwork sizeNumber of people with at least 2meaningful interactions in the last 28days with the time investorAre employees having meaningfulinteractions with a broad enoughgroup of people?Network size can be predictive ofengagement, innovation, and senseof belongingCollaboration hoursNumber of hours the person spentin meetings and on email and IMHow are teams/individuals investingtheir time across different teams,function and levels in theorganization?Collaboration activities might alignor diverge from the expectedoperating modelInfluence indexNumeric score that indicates howwell connected a person is withinthe organizationAre influencers well-representedacross teams/organizations andlevels?Some teams will require higherinfluence to work effectively acrossmultiple business unitsStrong and diversetiesNumeric scores that indicate howstrong and tight / varied and broada person’s connections areDo employees have a good mix ofstrong and diverse ties?Strong ties indicate goodconnection and engagement, whilediverse ties present good sources ofvaried information from across thecompanyNetwork size(new hires)Number of people who had at least 2meaningful interactions in the last 28days with the time investorHow long does it take for newemployees to come up to a similarlevel of connectivity than their peers?New hires network size can taketime to ramp up, but is predictive ofhigher engagement and lowerattrition over timeManager 1:1 hoursNumber of hours the person spentin meetings with their managerAre employees receiving sufficientcoaching time with their manager ina 1:1 setting to help onboard?Increased manager 1:1 supportduring onboarding help set upemployees for successOnboarding33
Enable teaming and networks: Additional resourcesResourceDescriptionNetwork visualizations functions (wpa Rpackage)A set of functions that create network visualizations withthe person-to-group and person-to-person queriesCommunity detection (wpa R package)A set of functions that help to discover hiddencommunities inside a network visualization, based oncollaboration flows between employeesConnectivity report (wpa R package)An out-of-the-box report that contains a summary ofmetrics and visualisations relating to connectivity,including internal and external network size34
Augmenting analysiswith engagementsurvey data35
Employee surveys can pinpointwhich groups are doing poorlyacross engagement metrics, but it isdifficult for them alone toextrapolate why this is the caseWorkplaceAnalyticsEmployeesurveysWorkplace Analytics provides anobjective and data-driven approachto understanding factors that mightbe impacting employee sentimentDeeper insights to develop effectiveinterventions and accelerate change36
Augmenting analysis: Value propositionEngagement surveyWorkplace AnalyticsHow employees feelWhat employees doAre my career goals being met?Are there barriers to simplify work?Can I balance work and personal life?Frequency of manager 1:1sTime spent in large recurring meetingsGrowth in after-hours workQuarterly, subjective, non-responder biasWeekly, objective, unbiasedSurvey provides the who and what: Teams that needs help Areas of improvementWorkplace Analytics provide the how: What behaviors does my team need to change toachieve improvement?Workplace Analytics tracks progress of behavioralchange: Are desirable behaviors being achieved over time?37
Augmenting analysis: Survey integration in practice1234Step 1:Step 2:Step 3:Step 4:Brainstormhypotheses for eachsurvey question ofinterestUpload surveyresponse toWorkplace AnalyticsIdentify behaviorscorrelated to surveyresponsesExamine thesignificance of therelationship38
Augmenting analysis with survey data: Example analysesImprove ways ofworkingProtect employeewellbeingBoost managerialexcellenceEnable teaming andnetworks39
From insights to action40
IndividualBuild knowledge and shift preferencesDashboardsLearning and developmentInline suggestionsCollectiveInduce different social expectationsEmployeeBehaviorIntervention typesBehaviors are responsesto an employee’simmediate contextshaped by individual,social and environmentalfactorsPolicies and rewardsPerformance feedback guidelinesInformational campaignsEnvironmentalChange structures, systems and toolsOrganizational designTechnologyWorkspace planningExampleLow employee engagement highlycorrelated with infrequent managerone-on-one meetingsManager 1:1 trainingReward managers for employee developmentCreate more spaces for private conversations41
Ways of working: Example opportunities and interventionsOpportunityAddress collaborationoverload in groups withlow-focus time andhigh meeting and emailactivityReduce size andfrequency of recurrentmeetings and reallocateeffort to strategicprioritiesDiscouragemultitasking and trackconflicting meetingsKPI as you addresscollaboration overloadExample interventions Rollout Workplace Analytics Collaboration Plan. Use inlinesuggestions to encourage less meetings Express that leadership and managers are interested inseeing a change as they role model declining a meeting,they do not believe they should attend and request theirsubordinates do the same Quickly identify the costliest meetings and work with theleaders that are generating the most meeting hours to seewhich ones they can cut back on Display a public counter with time and money saved toincrease awareness of cost of meetings to organizers Create a no-meeting (Fri)day or half-day blocker Crowdsourcing best practices for meeting behavior andpromote them across the organization Encourage stand-up style meetings to minimise distractions Track KPIs week on week and evaluate whatteams / initiatives are being most effectiveKPIs Weekly Meeting HoursWeekly Email Hours Percentage of meetinghours with 11 attendeesPercentage 11 attendeemeetings that are recurrent Low-quality Meeting Hours Conflicting meeting hours Multitasking meeting hours42
Employee wellbeing: Example opportunities and interventionsOpportunityReduce after-hoursactivity by streamliningearly morning andevening meetings, IMsand emailsReduce long workweekspans and after-hoursactivity for thoseemployees who are inhighest demand (and athighest risk of burnout)Increase sense ofbelonging andengagement bystimulating small groupconversationsExample interventionsKPIs Rollout Workplace Analytics Wellbeing Plan. Use inlinesuggestions to encourage less after-hours activity After-hours collaborationhours Create awareness with team leaders around hours beingspent working after-hours and encourage employees tochange behaviors with actionable tips Workweek span Regularly review staffing allocations to free up burden onthose who might be most vulnerable After-hours collaborationhours Make it a habit to ask others whether they have enoughbandwidth before assigning additional tasks Workweek span Work with others to gain an accurate reflection on howmuch effort a project requires and assign resourceseffectively Help employees maintain strong employee connectionsthrough informal and recreational meetings (brown bags,lunch and learns, and happy hours) and instant messages Small group meeting hours(meetings with less than 8people) Develop communities of interest for employees to join orencourage employees to join existing ones Internal network size43
Managerial excellence: Example opportunities and interventionsOpportunityExample interventionsEnable managers with MyAnalytics leadership Insights,helping them to understand and change behaviors basedon their own personal work patternsKPIs Meeting hours Focus hours Meeting hours withmanager 1:1 Manager coaching hour 1:1Encourage managers to delegate and empower employeesto run meetings and make decisions Meeting hours withmanager Make small budget to time opportunities available forprojects initiated by employees Meeting hours organizedby level Make sure all voices are heard during meetings, also thoseof the more junior participantsFree up time formanagers to spendmore time on coachingand developing theirdirect reports Review manager-employee ratios and set a threshold onthe number of direct reports per managerPromote a coachingculture by encouragingpeople managers tohave regular 1:1meetings with theirreports Create awareness with people managers aroundimportance of 1:1 meetings to change behaviors withactionable tips, best practices and training Generate friendly competition with light social pressure toencourage managers to increase their time spent in 1:1sFree up time formanagers and boostemployee developmentby giving employeesmore autonomy inmeetings 44
Teaming and networks: Example opportunities and interventionsOpportunitySet new hires up forsuccess by enablingemployee connectivityin their first few weeksExample interventions Stimulate specificcross-groupconnections to fosterinnovation, sense ofbelonging andengagementEnhance innovationand engagement byremoving barriersbetween communitiesof collaboration KPIsDevelop communities of interest and stimulate new hires tojoin these in their first weeksStimulate or train managers to schedule frequent recurring1:1’s with their new hiresHave managers set up informal conversations with keycontacts across the company for their new hires Internal network sizeSmall group meeting hours(meetings with less than 8people)Work with managers to create contacts across theorganization so they can facilitate connections for theirdirect reportsCreate an organization-wide mentoring program bringingtogether mentors and mentees from different teams.Organize cross-company hackathons to stimulatecollaboration and connections around passion projectsacross the organization Internal network sizeSmall group meeting hours(meetings with less than 8people)Create agile team compositions based on organiccollaboration communitiesInform seating plans based on these informal wor
collaboration tools Survey data Bring in other data sources to connect collaboration patterns to business outcomes Actionable insights Use powerful insights to make better business decisions and transform your organization Workplace Analytics Actionable insights to manage employee experience strategically