Transcription
ALAMEDA COUNTYOral HealthNeeds AssessmentOffice of Dental Health2019
ACKNOWLEDGEMENTSWriting and EditingSahiti Bhaskara, BDS, MPHMiriam Abrams, Miriam Abrams and AssociatesEllen Darius, RDH, MS, MPHMary Collett, MPH, RDQuamrun Eldridge, MPH, MHAJulie Williamson, MPHEditing ConsultantMary Anne Morgan, MPH, Morgan ConsultingGraphic DesignYvonne Day-Rodriguez, Y. Day Designs
Table of ContentsIntroduction . . . . . . . . . . . . . . . . . . . . . . . . . . . . . . . . . . . . . . . . . . . . . . . . . . . . . . . . . . . . . . . . . . . . . 2Methodology . . . . . . . . . . . . . . . . . . . . . . . . . . . . . . . . . . . . . . . . . . . . . . . . . . . . . . . . . . . . . . . . . . . . 3MODEL. . . . . . . . . . . . . . . . . . . . . . . . . . . . . . . . . . . . . . . . . . . . . . . . . . . . . . . . . . . . . . . . . . . . . . . . . . . . . . 3QUANTITATIVE DATA INDICATORS. . . . . . . . . . . . . . . . . . . . . . . . . . . . . . . . . . . . . . . . . . . . . . . . . . . . . 4QUALITATIVE DATA COLLECTION PROCESS . . . . . . . . . . . . . . . . . . . . . . . . . . . . . . . . . . . . . . . . . . . . 5Oral Health Data for Alameda County . . . . . . . . . . . . . . . . . . . . . . . . . . . . . . . . . . . . . . . . . . . . . 6ALAMEDA COUNTY DEMOGRAPHIC PROFILE . . . . . . . . . . . . . . . . . . . . . . . . . . . . . . . . . . . . . . . . . . . 6Oral Health Status of Alameda County Residents Through the Lifecourse. . . . . . . . . . . . 8EARLY CHILDHOOD (O TO 5 YEARS OLD). . . . . . . . . . . . . . . . . . . . . . . . . . . . . . . . . . . . . . . . . . . . . . . 8SCHOOL AGED CHILDREN (6 TO 20 YEARS OLD). . . . . . . . . . . . . . . . . . . . . . . . . . . . . . . . . . . . . . . . 11ADULTS (18 TO 64 YEARS OLD) . . . . . . . . . . . . . . . . . . . . . . . . . . . . . . . . . . . . . . . . . . . . . . . . . . . . . . . . 14PREGNANT WOMEN . . . . . . . . . . . . . . . . . . . . . . . . . . . . . . . . . . . . . . . . . . . . . . . . . . . . . . . . . . . . . . . . . 17OLDER ADULTS (65 YEARS AND OLDER) . . . . . . . . . . . . . . . . . . . . . . . . . . . . . . . . . . . . . . . . . . . . . . . 18POPULATIONS WITH SPECIAL HEALTH CARE NEEDS . . . . . . . . . . . . . . . . . . . . . . . . . . . . . . . . . . . 20HOMELESS CHILDREN AND FAMILIES . . . . . . . . . . . . . . . . . . . . . . . . . . . . . . . . . . . . . . . . . . . . . . . . 23Oral Health Workforce. . . . . . . . . . . . . . . . . . . . . . . . . . . . . . . . . . . . . . . . . . . . . . . . . . . . . . . . . . . 24Qualitative Data: Findings from Key Informant Interviews and Focus Groups. . . . . . . 27GAPS IN LOCAL DATA . . . . . . . . . . . . . . . . . . . . . . . . . . . . . . . . . . . . . . . . . . . . . . . . . . . . . . . . . . . . . . . 28RECOMMENDATIONS TO ADDRESS DATA GAPS. . . . . . . . . . . . . . . . . . . . . . . . . . . . . . . . . . . . . . . . 29Progress Toward 2012-17 Strategic Plan Goals:Key Activities and Systems Change Results . . . . . . . . . . . . . . . . . . . . . . . . . . . . . . . . . . . . . . 30STRATEGY 1: ACCESS . . . . . . . . . . . . . . . . . . . . . . . . . . . . . . . . . . . . . . . . . . . . . . . . . . . . . . . . . . . . . . . 30STRATEGY 2: EDUCATION . . . . . . . . . . . . . . . . . . . . . . . . . . . . . . . . . . . . . . . . . . . . . . . . . . . . . . . . . . . 32STRATEGY 3: ORAL HEALTH WORKFORCE DEVELOPMENT . . . . . . . . . . . . . . . . . . . . . . . . . . . . . . 33STRATEGY 4: COORDINATION AND OVERSIGHT . . . . . . . . . . . . . . . . . . . . . . . . . . . . . . . . . . . . . . . 34STRATEGY 5: EVALUATION . . . . . . . . . . . . . . . . . . . . . . . . . . . . . . . . . . . . . . . . . . . . . . . . . . . . . . . . . . 35Conclusion. . . . . . . . . . . . . . . . . . . . . . . . . . . . . . . . . . . . . . . . . . . . . . . . . . . . . . . . . . . . . . . . . . . . . . 36Endnotes . . . . . . . . . . . . . . . . . . . . . . . . . . . . . . . . . . . . . . . . . . . . . . . . . . . . . . . . . . . . . . . . . . . . . . . 37Appendix: Focus Group and Key Informant Interview Report. . . . . . . . . . . . . . . . . . . . . . . 38
IntroductionDental disease can contribute to poor quality of life and poor health outcomes and shares commonrisk factors with other medical conditions such as diabetes, heart disease and poor reproductive/birth outcomes. While dental disease is largely preventable and treatable, children from low-incomefamilies, older adults (age 65 and older), racial and ethnic minorities, low-income pregnant womenand people with special health care needs struggle to gain access to quality dental care. Untreated tooth decay(dental caries) and periodontal disease lead to unnecessary pain, infection, and tooth loss.Funding from the California Department of Public Health, Office of Oral Health enabled Alameda County toconduct this oral health needs assessment. A comprehensive environmental scan was undertaken to describecurrent local oral health trends and to catalogue the system of resources and services now available using bothprimary and secondary data. The assessment that follows also highlights the progress that has been made sincethe first Strategic Plan was implemented. The assessment findings were shared with the Oral Health SteeringCommittee, community partners and stakeholders to help inform the development of the 2019-24 Oral HealthStrategic Plan. It guided their decisions about where to focus efforts to strengthen the existing network for oralhealth and to address gaps in prevention, education and early treatment.ACRONYMSACPHDAlameda County Public Health DepartmentBRFSSBehavioral Risk Factor Surveillance SystemCAPEAlameda County, Community Assessment, Planning and Evaluation unitCDCCCommunity Dental Care CoordinatorsCHDPChild Health Disability PreventionEDEmergency DepartmentFQHCFederally Qualified Health CenterFVfluoride varnishHTHCHealthy Teeth Healthy CommunitiesHUDDepartment of Housing and Urban DevelopmentIDDintellectual and developmental disabilityMPCAHMaternal Paternal Child and Adolescent HealthODHAlameda County Office of Dental HealthRDHAPRegistered Dental Hygienists in Alternative PracticeWICWomen, Infants and ChildrenNote: data in the body of the text throughout this document are drawn from the source noted in theaccompanying figures.2Alameda County Office of Dental Health Needs Assessment 2019
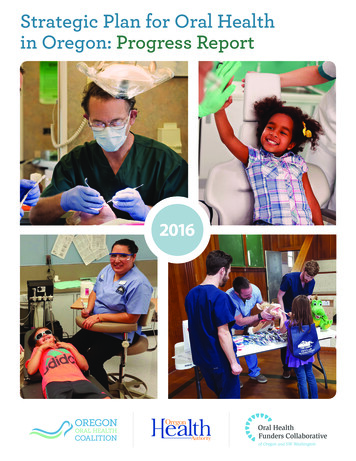
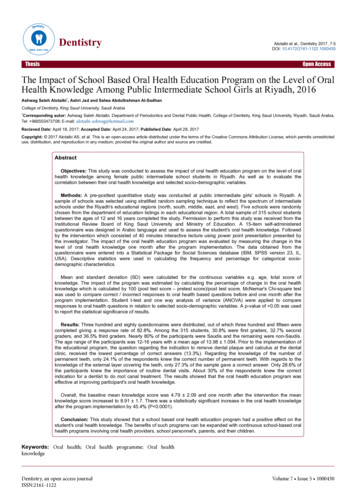
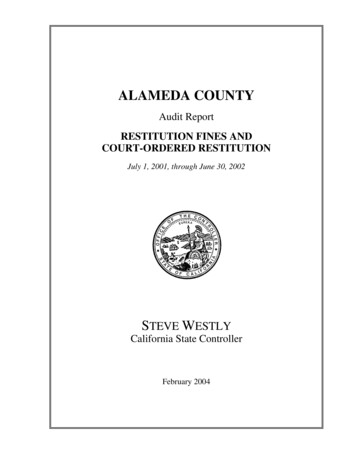
MethodologyModelThe seven-step model for conducting needs assessments developed by the Association of State andTerritorial Dental Directors was used as a guide to conduct Alameda County’s oral health needsassessment. The steps are outlined below:Figure 1: Seven Step Needs Assessment ModelSTEP 1Identify partners and form advisorycommitteeSTEP 7Evaluate needs assessmentSTEP 2Conduct self-assessment to determinegoals and resourcesSTEP 3Plan the needs assessmentCoreSTEP 6Prioritize issues and report findingsUtilize needs assessment for programplanning, advocacy and educationOptional(choose optionaldata elements tosupplement core)Conduct inventoryof available primaryand secondary data[STEP 5Organize and analyze dataDetermine need for primary data collection[Identify resources[Select methods[STEP 4Collect dataDevelop work planSOURCE: Association of State and Territorial Dental Directors, Kuthy, RA; Siegal, MD;Phipps, K. Assessing Oral Health Needs: ASTDD Seven Step Model (2003).Alameda County Office of Dental Health Needs Assessment 20193
The Oral Health Strategic Plan Steering Committee developed the framework and parameters for the needsassessment process in March of 2018. The combined quantitative and qualitative data collected over the nextthree months painted a fairly comprehensive picture of the oral health status and experiences of AlamedaCounty residents. At a stakeholder retreat in June 2018, the Committee used the needs assessment findings todevelop an expanded and more inclusive vision for oral health. The focus areas from the 2012 Plan were revisedand a new one added, based on the assessment’s finding of gaps in access to oral health prevention andservices for specific populations in Alameda County.Quantitative Data IndicatorsWith input from the Steering Committee, a comprehensive list of data indicators was identified (see below).Selected indicators from this list were explored, inventoried and/or collected based on data availability andcapacity to collect information in the given timeline. Assessment data was collected from a variety of sources:the California Department of Health Care Services, Center for Oral Health, Medi-Cal Dental Program, AlamedaCounty Office of Dental Health (ODH), Alameda County Dashboard, Women, Infants and Children (WIC), HeadStart/Early Head Start programs, school district data, the Behavioral Risk Factor Surveillance System and others.The most comprehensive local data available was on utilization of oral health services by Medi-Cal eligiblechildren 0-20 years of age and/or those who participated in specific program services such as at Head Start,WIC or the school districts. Local service utilization data was also available for pregnant women and adultsunder age 65 who are enrolled in Medi-Cal. Some additional data was available for adults living in the OaklandHayward-Berkeley Metropolitan Service Area. In cases where local countywide data was not available, thisreport drew from programmatic data, convenience samples and state or national data to fill in some of the gaps.Data for priority age and population groups that was not available was determined and will be collected over thecoming years.COMPREHENSIVE INDICATOR LISTNote: Bolded indicators are those that were analyzed for this reportI. Oral Health Outcome-Related»»»»»»»Untreated tooth decay (children and older adults)Caries experienceNeed for dental treatment (children and older adults)Prevalence of dental sealants (children)Perceived oral health status (children)Tooth loss (older adults)Oral and pharyngeal cancer—suspicious oral lesionII. Access to Care/Service Utilization»»»»»»4Dental exam in the past year (all children Medi-Cal adults and older adults)Preventive dental service (children, adults, older adults)–Medi-CalTreatment service (children, adults, older adults)–Medi-CalPlacement of dental sealants (children)–Medi-CalTooth cleaningAvoidable emergency room visits (children, adults, older adults)Alameda County Office of Dental Health Needs Assessment 2019
III. Risk Factors»»»»Demographic factors (percentage Free and Reduced-Price Lunch eligible children in public school; race/ethnicity for all age groups)Tobacco useDiabetes, alcohol use, Human Papilloma Virus (HPV) exposure, disabilityWater fluoridationIV. Intervention Strategies»»»»Safety-net clinics/Federally Qualified Health Centers (FQHCs)/community clinicsSchool-based health centersSchool-based oral health programs (prevention-focused)Kindergarten Oral Health Assessment response ratesV. Workforce, Infrastructure and Policies»»Dental provider capacity (number of dental professionals and by category of client served)Allied and non-dental professionals—current role and future opportunities in oral healthQualitative Data Collection ProcessThe Steering Committee was also interested in information that would illuminate the actual real-life experiencesof Alameda residents and include insights from the provider network. A consultant was hired to collect andanalyze the qualitative data for this assessment. Eleven interviews and seven focus groups were conductedbetween March 22 and April 27, 2018. Participants were selected to reflect the county’s geographic diversity andeach supervisorial district, as well as perspectives from a broad range of populations and agencies includingchildren, foster youth, pregnant women, immigrants, older adults, homeless families, people with specialhealth care needs, FQHC staff, WIC, Alameda County Public Health Department (ACPHD) leadership, andcommunity partners. A focus group of parents of children with special needs was also conducted. In addition,group meetings were conducted with the existing ODH Prenatal Workgroup and Integration with Primary CareWorkgroup, which included representatives from other FQHCs, dental and medical providers, etc. from acrossthe county. Separate group meetings were also held with ODH managers and with ODH staff. (See the detailedreport in the Appendix).Alameda County Office of Dental Health Needs Assessment 20195
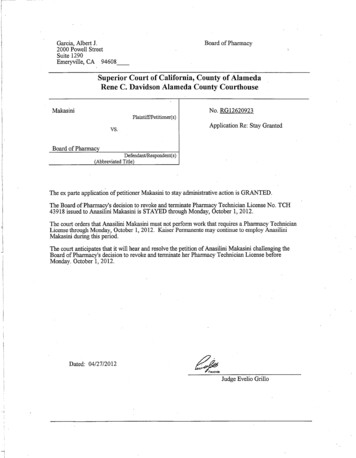
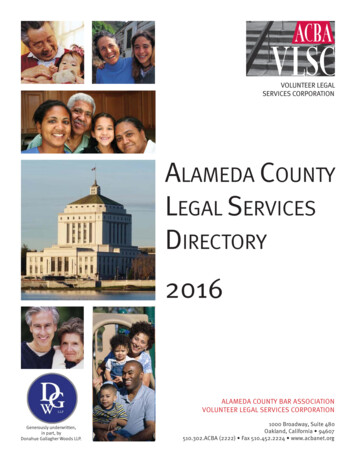
Oral Health Data for Alameda CountyAlameda County Demographic ProfileThe total population of Alameda County as of this report is 1.65 million people. To create the County’sdemographic profile, resident data was examined by age, race, income (as measured by families living inpoverty) and highest level of education. Most of Alameda County’s residents are over 21 years of age, withchildren aged birth to 20 years old constituting nearly 25% of the County’s population (See Figure 2). Much likethe rest of California, Alameda County also has a growing older adult population. In California, by 2030, 1 out of5 individuals will be 65 years and older.1Figure 2: Alameda County Residents by Age Category, 201865 5–6418–2040.3%20.1%21–34SOURCE: Healthy Alameda County Data Portal; Available at http://www.healthyalamedacounty.org/Alameda County is a diverse community. As shown in Figure 3, Whites are the largest population group followedby Asians. Across all race categories, 22.7% of individuals are of Hispanic/Latino ethnicity.Figure 3: Alameda County Population by Race, 2018Other or Multi Racial17.3%American Indian/Alaskan Native.6%Native Hawaiian/Pacific Islander.9%Black/African American10.7%40.4%White30.2%AsianSOURCE: Healthy Alameda County Data Portal; Available at http://www.healthyalamedacounty.org/6Alameda County Office of Dental Health Needs Assessment 2019
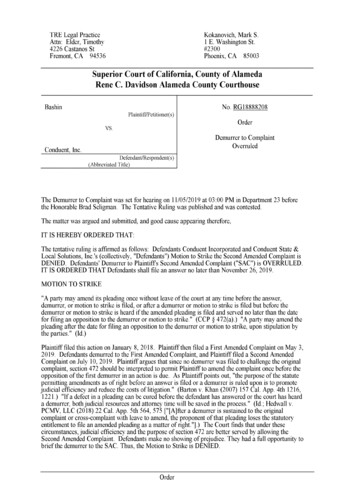
Eight percent of Alameda County families live below the federal poverty level, which is lower than the Californiaaverage (See Figure 4).Figure 4: Families Living in Poverty and Families with Children Living in Poverty,Alameda County and California, 2018Alameda Families Livingin Poverty9.9%20.1%18.4%18.3%01521.6%20.8%Families with Children 12.9%Living in PovertyAlameda CountySOURCE:Healthy Alameda County Data Portal; Available at forniaAlameda County had a similar overall distribution to California in highest educational attainment. In the County,53% 2.3% 2.9%fewer individuals had less than an associate degree but more had a bachelor’s degree or greaterwhen1.6%compared to the California average (See Figure 5).6.9%06.4%5.8%Less thanSomeHighSomeAssociate Bachelor'sMaster's Professional DoctorateSchoolAttainment,College,DegreeDegree andDegreeDegreeFigure ,2018 DegreeGrade30%School,GraduateNo DiplomaNoDegreeAlameda .7%21.6%6.4%20.1%18.4%3% 2.3%15Less thanSomeHigh9thHigh 9.9% School108%GradeSchool,Graduate6.9%No Diploma 5.8%SomeCollege,NoDegreeAssociate Bachelor'sDegreeDegree6.4%7.7%12.9%8%2.3%Alameda County1.6%Master's Professional DoctorateDegreeDegreeDegree5SOURCE:Healthy Alameda County Data Portal; Available at http://www.healthyalamedacounty.org/3%02.9%Less thanSomeHighSomeAssociate Bachelor's9thHighSchoolCollege,DegreeDegreeOffice Gradeof DentalSchool,Health Needs2019GraduateAssessmentNoNo DiplomaDegree2.9%1.6%Master's Professional DoctorateDegreeDegreeDegree7
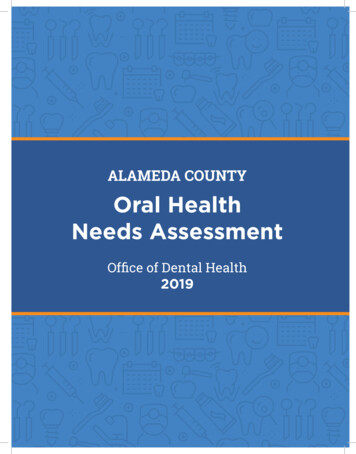
Oral Health Status of Alameda County ResidentsThrough the LifecourseEarly Childhood (0 to 5 years old)An infant’s teeth are vulnerable to tooth decay as soon as they appear, sometimes between 6 and 12 months of age.Untreated tooth decay can cause unnecessary pain and infections that may lead to problems with eating, speaking,playing and learning. To achieve favorable dental disease prevention at the population-level through upstreammeasures, it is critical to introduce and establish good oral health practices as early as possible. The AmericanAcademy of Pediatric Dentistry recommends that every infant should receive an oral health risk assessment fromhis/her qualified health care professional by six months of age. They also recommend that parents establish a dentalhome for infants by 12 months of age and that caregivers should implement oral health hygiene measures no laterthan the time of eruption of the first primary tooth. Finally, it is recommended that favorable dietary habits (e.g. lowsugar, high protein) and optimal exposure to fluoride be established as early as possible.CURRENT STATUSIn 2016, nearly one in three (32.8%) children 0-5 years of age screened at selected Women, Infants and Children(WIC) clinics in Alameda County showed evidence of untreated dental decay. Disparities exist by race/ethnicity.Asian children (45.1%) and Black/African American children (34.7%) had a higher prevalence of untreated toothdecay compared to their counterparts. These data represent the children who were screened at selected WICsites that receive dental services during WIC Dental Days.Recent national data shows similar trends. Although tooth decay is on the decline, certain racial and ethnicgroups continue to have a higher burden of disease. The take-away from Figure 6 below, although notrepresentative of all of Alameda County, is that disparities by race/ethnicity are an important consideration as weassess oral health.Figure 6: Prevalence Of Untreated Tooth Decay Among a Convenience Sample of 0-5 Year Old WICChildren Screened (N 924), by Race/Ethnicity, RacialWhiteTOTALSOURCE: WIC Dental Days Clinic Screening Data, ODH, 20168Alameda County Office of Dental Health Needs Assessment 2019
Nearly 85% of children 0-5 years old in the Head Start and Early Head Start programs in the County wereestimated to have received a dental assessment in 2016 (Alameda County Public Information Report, 2016).Twenty-five percent (25.2%) of these children were identified as needing treatment for dental disease, asillustrated in Figure 7:Figure 7: Percent of Early/Head Start Children Screened in 2016 (ages 0-5) with Dental DiseaseSOURCE: Public Information Report Data, Office of Head Start, U.S. Department of Health and Human Services, 2016UTILIZATION OF DENTAL SERVICESWhile utilization rates of any dental services by Alameda County’s youngest Medi-Cal eligible residents (0-5yrs)is comparable to the State average, it is still very low. Only a little over 3 out of 10 young children had a dentalvisit during the past year according to 2016 data (See Figure 8). Service utilization was even lower among theyoungest children (0-2-years old). Only 28.2% children 1-2 years of age had a dental visit during the past year.Utilization was highest among 3-5-years old (49.8%):Figure 8: Utilization of Dental Services (Annual Dental Visit) by Medi-Cal Eligible Children,by Age Group, Alameda County and California, 2016Alameda County60%49.8% 51.7%50California4035.7% 34.8%28.2%302010023.2%30%25.6%252%2.2%20.8%2018.3% 1 year old1-2 years old21.6%18.4%20.1%3-5 years oldTOTAL0-5 years old1512.9%SOURCE: California Department of Health Care Services, Open Data Portal; Available at 08%3% 2.3%Less than9thGradeSomeHighHighSchoolSchool,GraduateNo DiplomaSomeCollege,NoDegreeAssociate Bachelor'sDegreeDegreeAlameda County Office of Dental Health Needs Assessment 20192.9%1.6%Master's Professional DoctorateDegreeDegreeDegree9
Use of preventive dental services, critical for improving population oral health, is also low. Overall, only 32.7%of the 0-5-year-old children received at least one preventive dental service during the past year according to2016 data.Figure 9: Utilization of Preventive Dental Services by Medi-Cal Eligible Children,by Age Group, Alameda County and California, 201646.3% Alameda County25.6%1%25 1 years old1-2 years old2020.8%18.3%3-5 years21.6% oldTOTAL0-5 yearsold20.1%18.4%SOURCE: California Department of Health Care Services, Open Data Portal; Available at https://data.chhs.ca.gov/1512.9%9.9%USE OF EMERGENCY DEPARTMENTSFOR PREVENTABLE DENTAL CONDITIONS108%8%7.7%Use of Emergency Departments(EDs) for non-traumatic dental conditionsis an indicator of poor access to6.9%6.4%5.8%dental care. Having untreated and symptomatic dental disease (unmet need for dental care) without access53% healthto services in a timely/appropriate manner can also result in visits to the ED. When assessing oralof a2.3% 2.9%1.6%community, lower ED use for preventable and non-traumatic dental conditions is favorable.The rate of utilization of0 EDsforthannon-traumaticdentalbychildren0-5 yearsMaster'sof age Professionalis lower in DoctorateLessSomeHigh ege,DegreeDegreeDegreeDegreeAlameda County compared Gradeto the statewideaverage.Yet,Noyoung children continue to visit EDs forunmet DegreedentalSchool,Graduateneeds. Between 2012 and 2016, theNorateof ED visits per Degree100,000 individuals was 246.5 among children youngerDiplomathan one year, 368.3 among 1-2 year old and 266.2 among 3-5 year old children (see Figure 10). In AlamedaCounty, rates of ED visits by all children 6-17 years of age (irrespective of insurance category) were highestamong children 6-9 years old (203.5 visits per 100,000). It is noteworthy that of all children 0-18 years of age,children ages 1-2 years had the highest rate of visiting EDs for non-traumatic dental conditions. Between 2012and 2014, among Alameda County residents enrolled in Medi-Cal ages 0 through 20, there was a total of 4,259dental-related ED visits. Nearly half (47.5%) of the ED visits for preventable dental conditions were made bychildren 0-5 years of age.10Alameda County Office of Dental Health Needs Assessment 2019
Figure 10: Rate of Non-Traumatic Emergency Department Visits, By Age Group,Alameda County and California, 2012-2016500Alameda .7203.530%200218.525.6%10020021.6%20.8% 1 yearsold151018.3%1-2 yearsold9.9%6.9%3-5 yearsold157.3 152.9107.1 112.52520.1%18.4%6–9 years 10–13 years 14–17 years12.9%oldoldoldRATE PER 100,000 INDIVIDUALS8%6.4%5.8%7.7%8%SOURCE: Office of Statewide Health Planning and Development; California Department of Public Health, Office of Oral Health, 2016.503% 2.3%Less than9thGradeSomeHighHighSchoolSchool,GraduateNo DiplomaSomeCollege,NoDegreeAssociate Bachelor'sDegreeDegree2.9%1.6%Master's Professional DoctorateDegreeDegreeDegreeSchool Aged Children (6 to 20 years old)NOTE: For Medi-Cal data, the age group for children extends up to 20 years.Dental decay continues to be the most common disease of children 6-11 years old and adolescents/teens12-19 years of age. At the age of 6, most children experience the eruption of their first permanent tooth. It isrecommended that children receive a caries risk assessment followed by application of dental sealants on theirpermanent molar teeth soon after eruption. Age-appropriate and evidence-based/evidence-informed measuresintroduced at schools can have favorable large-scale outcomes for oral health. School-based programs(screening, risk assessment, fluoride varnish and dental sealant application and oral health education) reachunderserved, low-income children with preventive care and can increase access to timely dental care amongchildren with unmet treatment needs. School-based sealant programs have the potential to reduce racial, ethnicand economic disparities in the prevalence of dental sealants among school age children. The CommunityPreventive Services Task Force recommends school-based sealant programs based on strong evidence ofeffectiveness in preventing caries in children.2CURRENT STATUSCurrently, county-wide representative data estimates for status of oral health among school age children isunavailable but some data was collected by specific programs in schools in Oakland and Berkeley. Amongchildren screened through the Berkeley Sealant Program in 2017, nearly 21% of students had untreated toothdecay with nearly 7% of students having severe tooth decay. Among children screened through the OaklandStudent Smiles program, nearly 45% of students had untreated tooth decay with nearly 13.6% of students havingsevere tooth decay (See Table 1).Alameda County Office of Dental Health Needs Assessment 201911
Table 1: Percent of Children in Oakland Student Smiles Program with Decay, 2014, 2017Any Decay (class 2,3, and 4)Severe Decay (class 3 and .9%80913.6%All Three CombinedSOURCE: Oakland Student Smiles Program Data, ODH, 2014 and 2017CALIFORNIA’S KINDERGARTEN ORAL HEALTH ASSESSMENTIn 2016, only 35% of schools from 7 Alameda County school districts reported Kindergarten Oral Health Assessmentdata. Eighty-four percent of the 5,400 eligible kindergarteners at those schools had an assessment. Of those whosubmitted assessments, about 8% had untreated tooth decay. Fourteen percent of the eligible kindergarteners inreporting school districts quoted “financial burden” or “lack of access” as reasons for not receiving an assessment.UTILIZATION OF PREVENTIVE DENTAL SERVICESMedi-Cal Eligible ChildrenLess than half (44.5%) of the Medi-Cal eligible children ages 6-20 in Alameda County had a dental visit during thepast year according to 2016 data. The older children–aged 15-20 years—had lower utilization rates as indicatedby annual dental visit than their younger counterparts (6-14 years), as shown in Figure 11.Figure 11: Annual Dental Visit by Medi-Cal Eligible Children, by Age Group,Alameda County and California, 201660%54%Alameda 5%24.6%California27.2%30%25.6%256–9years old2010–14years old21.6%15–1820.8%19–2018.4%yearsyears old18.3%old20.1%TOTAL(6–20years old)1512.9%NOTE: For Figure 11, Annual Dental Visit is defined as a yearly dental visit to a dental providerthat results inthe receipt of any dental service in the range of codes D0100-D9999.9.9%10 Department of Health8% Care Services, Open Data Portal;8%SOURCE: CaliforniaAvailable at https://data.chhs.ca.gov/7.7%6.9%6.4%5.8%51203% 2.3%Less than9thGrade2.9%1.6%Alameda County Office of Dental Health Needs Assessment 2019SomeHighHighSchoolSchool,GraduateNo DiplomaSomeCollege,NoDegreeAssociate Bachelor'sDegreeDegreeMaster's Professional DoctorateDegreeDegreeDegree
Figure 12 summarizes the use of preventive dental services for all Medi-Cal eligible children aged birth to 20 years old:Figure 12: Utilization of Preventive Dental Services by Medi-Cal Dental Eligible Children,by Age Group, 2016Alameda County60%48.1%504051.8%California38.7%38.7%32.7% 31.7%40.7%32%302030%10025.6%250–5 years old6–14 years old2021.6%20.8%15-20 years oldTOTAL20.1%(0-20 years old)18.4%18.3%NOTE: For Figure 12, Preventive Dental Services are defined as a dental visit that results in the receipt of a preventive servicethat lies within the codes D1000-D1999. For example, D1206: Topical application of fluoride varnish or D1351: Sealant per tooth.1512.9%SOURCE: California Department of Health Care Services, Open Data Portal; Available at https://data.chhs.ca.gov/9.9%108%8%7.7%6.9%6.4%A smaller percentage of Medi-Caleligible5.8% children received dental sealants in Alameda County compared tostatewide data. Over 12%a dental5 of children 6-9 years of age and 6.4 % of children 11-14 years of age received3% 2.3% 2.9%sealant during the past year according to data from 2016 (Figure 13). While this is not a measure of theactual1.6%number of children with dental sealants on their permanent molar, this estimate serves as a proxy for the number0thanSomeHighSomeAssociate Bachelor'sMaster's Professional Doctorateof Medi-Cal eligible childrenLessreceivingsealants annually.9thGradeHighSchoolSchool,GraduateNo reeFigure 13: Receipt of Dental Sealants by Medi-Cal Eligible Children, by Age Group, 201620%Alameda 2020.8%21.6%18.3% 6–9 18.4%years old10–14years old20.1%15 Department of Health Care Services, Open Data Portal; Available at https://data.chhs.ca.gov/12.9%SOURCE: California109.9%6.9%8%5.8%6.4%7.7%50Alameda County Office8%3% 2.3%Less thanSomeHighSomeAssociate Bachelor's9thHighSchoolCollege,DegreeDegreeof DentalNeedsAssessmentGrade HealthSchool,GraduateNo 2019No DiplomaDegree2.9%1.6%Master's Professional DoctorateDegreeDegreeDegree13
Adults (18 to 64 years old)People are susceptible to tooth decay, periodontal disease and other dental conditions throughout their lives.National data shows that dental caries often go untreated among adults. Best practices for good oral healthinclude visiting a dentist for preventive services every 6 months, and early diagnosis and treatment of dentaldisease to prevent further deterioration of condition of teeth and mouth.Survey data from the Behavioral Risk Factor Surveillance System (BRFSS) showed that 35% of the noninstitutionalized adults (18-64 years of age) in the Oakland-Hayward-Berkeley Metropolitan Statistical Area havehad at least one permanent tooth extracted due to tooth decay or gum disease in 2014 (Figure 14):Figure 14: Adults (18-64 years old) Who Have Had at Least One Permanent Tooth Extracted
Alameda County Office of Dental Health Needs Assessment 2019 7 Eight percent of Alameda County families live below the federal poverty level, which is lower than the California average (See Figure 4). Figure 4: Families Living in Poverty and Families with Children Living in Poverty, Alameda County and California, 2018 0 2 4 6 8 10 12%