Transcription
NSW DEPARTMENT OF EDUCATIONGEOGRAPHYCONTINUUMS K-10PAGE 3ILLAWARRA EECSPATIAL TECHNOLOGY& VISUAL DEPICTIONSPAGE 7FIELDWORKTECHNIQUES & TOOLSPAGE 14GEOGRAPHYIEEC Geographical ToolkitA focus on fieldwork plus:MapsSpatial technologiesVisual representationsSurveysPrepared for Geography Curriculum Networks IllawarraSometimes takingphotos and leaving onlyfootprints isn’t enough.Geography informs oursense of place,perceptions of identityand connection withculture and theenvironment.Geography enables ourpredisposition andcapacity to act.!1
NSW DEPARTMENT OF EDUCATIONILLAWARRA EECGeographical ToolsIllawarraEnvironmentalEducation CentreContentsGeography K-10 Syllabus: interconnected continuums3Fieldwork - a fundamental geographical tool4Planning for Fieldwork5Illawarra Environmental Education Centre Fieldwork Snapshots6Geographical tools: spatial technologies - ST7 vertical aerial photographs Google Tour BuilderGeographical tools: visual representations - VR10 sketch maps oblique aerial historic photographs field sketching and photography ground level photographsFieldwork techniques14 beach profiles transectsPhysical factors and tests16 temperature humidity sunlight intensity wind speed direction slope soil description soil moisture water salinity soil pH turbidity of water organic matter in soil soil salinitySurveys - Fieldwork29Resources30Illawarra EEC contacts and booking inquiries31EZEC NSW Environmental and Zoo Education Centres32This resource sets out therange of geographicaltools used by the IllawarraEnvironmental EducationCentre. The IEEC providesexperienced educators towork alongside Geographyteachers and students inthe use of these tools asthey work through theinquiry process.!2
NSW DEPARTMENT OF EDUCATIONILLAWARRA EECGeography K-10 Syllabus - interconnected continuumsSyllabus overviewGeographical inquiry skillsAcquiringGeographical nvironmentInterconnectionGeographical toolsgeographicallyProcessinggeographicalVisual leCommunicatingSustainabilitySpatial technologiesMapsFieldworkGraphs & l literacy & geographical skill setsInformed, responsible & active citizens“I’m increasingly mindful of the degree to which geography,distance and weather have moulded my sensory palate, myimagination and expectations”.This model is an adaptation basedon Dr Grant Kleeman, MacquarieUniversity presentation CanberraGeography Roadshow Nov. 2015.Tim Winton, 2015, Island Home : a landscape memoir!3
NSW DEPARTMENT OF EDUCATIONILLAWARRA EECFieldwork - a fundamental geographical tool (a syllabus extract)Fieldwork is an integral and mandatory part of the study of Geography as it facilitates anunderstanding of geographical processes and geographical inquiry. Fieldwork can enhancelearning opportunities for all students because it caters for a variety of teaching and learningapproaches. The enjoyable experience of active engagement in fieldwork helps to create andnurture a lifelong interest in and enthusiasm for the world students live in.Fieldwork involves observing, measuring, collecting and recording information outside theclassroom. Fieldwork can be undertaken within the school grounds, around local neighbouringareas or at more distant locations. In some instances it may be necessary to use information andcommunication technology to undertake virtual fieldwork. Where fieldwork is proposed forAboriginal and/or Torres Strait Islander sites, participants should be familiar with protocols forworking with Aboriginal communities and ensure appropriate consultation with localcommunities and education consultants occurs.Fieldwork enables students to: acquire knowledge about environments by observing, mapping, measuring and recordingphenomena in the real world in a variety of places, including the school explore geographical processes that form and transform environments use a range of geographical tools to assist in the interpretation of, and decision-making about,geographical phenomena locate, select, organise and communicate geographical information explore different perspectives on geographical issues.Fieldwork activities should be carefully planned to achieve syllabus outcomes. Fieldwork activitiesshould be integrated with the teaching and learning program to take full advantage of theenhanced understanding that can be achieved through direct observation, field measurementsand inquiry learning. Fieldwork activities may be specific to a topic or may be integrated acrossthe Geography curriculum.Students must undertake and participate in fieldwork in each Stage of learning. In the early yearsof learning students should be guided to observe their local area such as weather and vegetationor interviewing family and community members about connections to other places.There will be an increasing emphasis on independent observation and analysis of data in Stages4–5. There are many opportunities for fieldwork in Stages 4–5 such as investigating geomorphicprocesses that create local landscapes, investigating the characteristics of a local place orobserving aspects of human-induced environmental changes that challenge sustainability in localor regional landscapes.BOSTES, 2015 Geography K-10 Syllabus, page 32!4
NSW DEPARTMENT OF EDUCATIONILLAWARRA EECPlanning for FieldworkExcursions policy The Department of Education has specific policies relating to excursions and bushwalking.Reference No:School excursions are structured learning experiences provided by, or under the auspices of,PD/2004/0010/V07 the school which are conducted external to the school site. They can pose risks. The policyand procedures are directed at managing such risks. Follow your school’s excursion policy.Excursions policyImplementationProceduresLasted updated16.2.16Contains: Introduction; educational value; inclusivity; duty of care; parents, caregivers andvolunteers; child protection; risk management; connect; transport; student behaviour;overseas excursions; accounting and administration relating to excursions; briefing studentsprior to excursions; billeting of students on excursion; related documents and adviceSelecting site/sOnce the purpose of the fieldwork has been determined as well as the relevant scope ofskills to be developed through fieldwork a site needs to be chosen that: is close to school to reduce travel time and cost and maximise time in the field. offers toilet facilities and shelter (if required as student comfort is a priority). has obvious features easy for students to observe and measure. offers previously researched information that can be used as secondary source material egenvironmental impact studies, urban development applications, management plans forreserves, national and state parks. may be appropriate for an expert to visit to speak to students eg fisheries officer, townplanner, Landcare volunteer, park manager etc,Before the day Visit the study site at least once prior to the field day. Estimate the time needed to undertake the fieldwork. If there is walking involved allow timefor this as well as food breaks and travelling time. Plan the day and fieldwork activities. Don’t attempt too little or too much. Get a number of quotes for the bus costs. Distribute and collect permissions notes and students fees well in advance. Organise field equipment, worksheets and mobile technology. Identify student groups for group work. Brief the students on the purpose including the key inquiry question being investigated,geographical concepts to be explored and geographical tools to be used. Teach thefieldwork techniques to be utilised. Ensure the students know how they are to beassessed during and after the fieldwork. Ensure students wear appropriate clothing, sports uniform is most often the best optionplus sun safety and spray jacket. Check all students for medical conditions and medical requirements. Plan for and enable differentiation whether for students special learning needs, mobilityissues and/or extension. Have an emergency procedure and contacts in case of an accident. Ensure contingencies and communications are in place for all teachers, schooladministration, students and parents in the case of storms.On the day After thefieldwork Commend students for their participation and achievement. Consider strategies for sharing and celebrating students’ fieldwork reports. Use the school’s newsletter, website, Facebook to share the purpose and outcomes of thefieldwork as a structured, relevant and fun aspect of geography and school culture.Check weather forecast http://www.bom.gov.au/places/nsw/wollongong/Make sure you have fieldwork equipment and worksheets.Check all students needing medication have it with them or they don’t go.Take a first kit, mobile phone with relevant contacts.Check student roll throughout the day.Confirm drop off and pick up points / times with the driver.Remind students about working ethically ie caring for the environment.Avoid giving students permission to go to shops. The last thing you need is students takingup valuable time to order and eat hot food.!5
NSW DEPARTMENT OF EDUCATIONILLAWARRA EECIllawarra Environmental Education Centre Fieldwork SnapshotsThe Illawarra Environmental Education Centre understands and supports teachers and studentsin curriculum planning and development for fieldwork Kindergarten to Year 12. The followingpages are a snapshot of our current strategies for fieldwork and other geographical tools.Figure 1: IEEC fieldwork snapshots!6
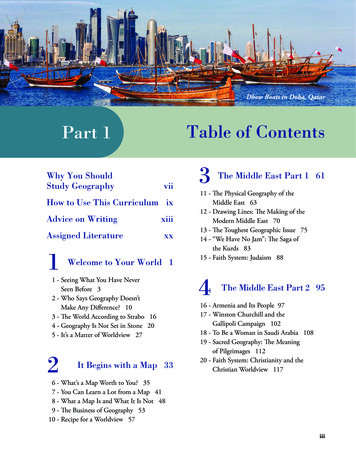
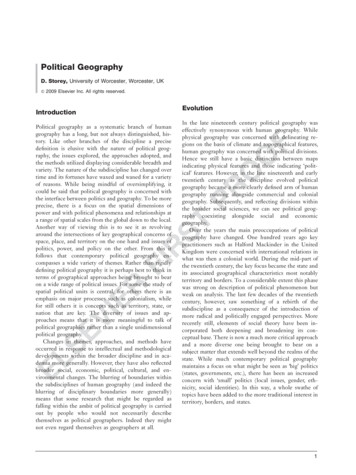
NSW DEPARTMENT OF EDUCATIONILLAWARRA EECGeographical ToolsSpatial Technologies - STSpatial technologies include any software or hardware that interacts with real world locations.Examples include, but are not limited to, virtual maps, satellite images, global positioningsystems (GPS), geographic information systems (GIS), remote sensing and augmented reality.(Reference: BOSTES, 2015 Geography K-10 Syllabus, page 33)Vertical aerial photographs - STThe Illawarra Environmental Education Centre subscribes to nearmap.com.au. Near mapprovides high resolution imagery captured at regular intervals.Students use this spatial technology to: identify locations, indicate north, create a heading,measure distances and areas, capture their own vertical aerial photographs, draw sketch maps,identify and classify cultural and natural assets, label and annotate images of landscapes andlandforms, compare and contrast change over time and transform the vertical aerialphotograph into a map.Shell CoveBass PointNorthThe FarmMystics BeachRangoon IslandMinnamurra Headland0Figure 2 Vertical aerial photograph of Killalea State Park0.5kmScaleHome for Illawarra Environmental Education CentreFrom the location information box students can determine:Latitude / longitude of the IEEC is -34.602376, 150.860782Elevation is 52.3m!7
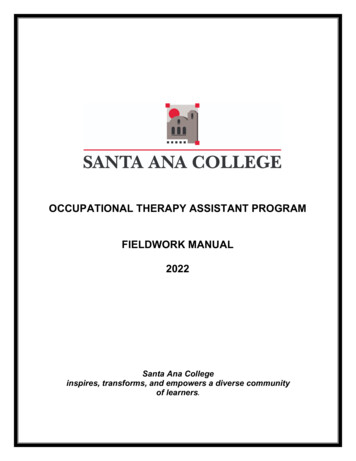
NSW DEPARTMENT OF EDUCATIONILLAWARRA EECSpatial Technology - STVertical aerial photographs of the same landscape taken at different times can be used to compareand contrast change over time.Figure 3: Vertical aerial photograph ofKillalea and Shell Cove takenWed 01 September 2010Figure 4: Vertical aerial photograph ofKillalea and Shell Cove takenMon 18 January 2016Students describe those landforms thatthat have changed.For example: further urban development of thehills adjacent to Killalea earthworks of Shellharbour beach,wetland and shore to enable theconstruction of the marina on-going extraction of blue metalfrom the headland down to sea level(compare the profiles captured bydrawing a line in Nearmap providingdistance, bearing and elevationchanges).!8
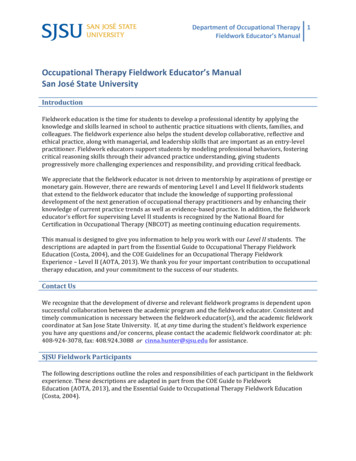
NSW DEPARTMENT OF EDUCATIONILLAWARRA EECGoogle Tour Builder - STGoogle Tour Builder is a new way to show people the places you've visited and the experiencesyou had along the way using Google Earth. It lets you pick the locations right on the map, add inphotos, text, and video, and then share your creation.Points to note when using Google Tour Builder It requires Google Earth Plugin. Browsers which supports Google Earth 3D plugin include Firefox, Safari and Explorer Using other browsers and Google Tour Builder defaults to a 2D version. You need a non mobile browser. Use a laptop or desktop to create and or view tours. Sign in with your DEC gmail account: eg stuart.delandre@nsw.gov.edu.au and your passwordis the same as you use to access DEC portal.Figure 5: Screenshot from a tour created for Stage 2 studentsTo view tours created by the IEEC follow the links below:S1 Wollongong's Blue MileS2 Beneath Our Feet S3 Kangaroo Valley PS ClimateWatch project!9
NSW DEPARTMENT OF EDUCATIONILLAWARRA EECVisual Representations - VRVisual representations take many forms and include digital and non digital mediums. Examplesinclude, but are not limited to, diagrams, images, photographs, paintings, illustrations, symbols,models, posters, collages, cartoons, multimedia, infographics and mind maps. Visualrepresentations are used to display, visualise, analyse and communicate geographical data andinformation. (Reference: BOSTES, 2015 Geography K-10 Syllabus, page 33)Sketch Maps - VRSketch maps can be constructed from vertical aerial photographs of the area studied during fieldwork.Sketch maps should display a border to replicate the same frame as the aerial vertical photograph. Themain natural and cultural features of the landscape should be drawn. Main features should be labelledon the sketch map as well as providing a title, scale, north point and legend.Shell CoveKillaleaBass PointLagoonThe FarmMystics BeachRangoon IslandMinnamurra RiverMinnamurra HeadlandNorth00.5kmScaleFigure 6: Sketch map of Killalea State ParkIllawarra Environmental Education CentreBass Point ReserveKillalea State ParkBeach / dunesOther!1 0
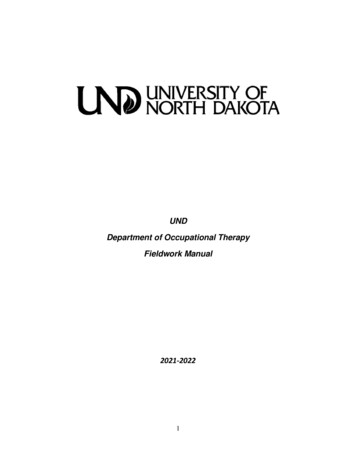
NSW DEPARTMENT OF EDUCATIONILLAWARRA EECOblique aerial - VROblique aerial photographs are taken from an aircraft with the camera at an oblique angle to theground. These images are often easier to interpret because the sides of objects are shown as wellas the tops. However it is difficult to assess the scale of objects as those in the foreground appearlarger than those further away.1. Bass Point Reserve12112. Bass Point quarry33. Rocky headland4. marina site465. Killalea Lagoon56. The Farm beach10797. Illawarra EEC8. Killalea State Pk management89. Dry subtropical rainforest10. Quarry transport route11. Jetty for shipping blue metal1212. Shell Cove urban developmentFigure 7: Oblique labelled photo of Killable State Park and Bass PointHistoric photographsHistoric photos can be used by students to study changes in lands over time.Figure 8: View north east over the piggery and chicken coup toward the Farm Beach35!1 1
NSW DEPARTMENT OF EDUCATIONILLAWARRA EECField Sketching and Photography - VRField sketching and photography are essential geographical tools utilised during fieldwork. Donecorrectly they provide supportive data and improve the quality of the study.Students need to be guided beforehand to identify the purpose of the photograph or field sketchin terms of what they are aiming to show and ensuring these features are clearly depicted.When sketching draw a frame onto the paper. Label the direction, bearing, grid reference and ashort written description of the ‘view’.Mystics BeachMinnamurraRiver entranceRocky headlandand cliffsRangoonIslandFigure 9: Labelled photograph taken at 9:30am 17 December from Westringea Point, KillaleaState Park looking towards Mystics BeachMystics beachformed 7000years ago at theend of the lastice age. Thebeach forms abarrier estuaryseparatingMinnamurraRiver from theocean.Rocky headlandand cliffs volcanic rockformed 270millions yearsago fromcooling lava.The headlandsare moreresistant toerosion.Figure 10: Annotated field sketch from Westringea Point looking SW, bearing 210 degreesNote the difference between labelling and annotation. Labels are used to identify the main features,and annotations to comment on features, areas and/or processes.Both photographs and field sketches used in conjunction with maps enable more effectivecommunication in drawing upon first hand observations in the field to describe features of places.!1 2
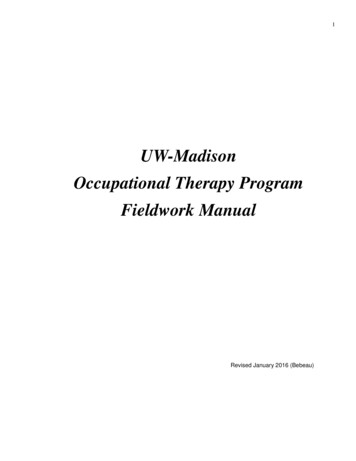
NSW DEPARTMENT OF EDUCATIONILLAWARRA EECGround level photographs - VRGround level photographs are taken from a ground level perspective with the camera horizontalto the ground. Ground level photographs are used to record and describe detail in either physicalor cultural features. However ground level photographs make it difficult to capture andcommunicate scale and spatial relationships.In framing the photographs students need to have identified the feature to be depicted. Studentscan consider classifying the nature of images that they are seeking to portray.Physical featuresCultural featuresLandscapescoastal, desert, mountainSettlementcities, towns, suburbsLandformsheadlands, islands, estuaries Landuseurban, recreation, agricultureVegetation typesrainforest, coastal dunesTransportrail, roads, airport, cyclewaysClimatearid, tropical, temperateServiceshospitals, local council, ambulanceWaterwaysrivers, creeks, lagoonsPopulationnumber, density, age, genderSoiltexture, colour, structureHeritagestate parks, national parksIncipient dune:Foredune:Pioneer species: SeaRocket; SpinifexPrimary species: Spinifex, Penny wort, Pigface,Coast Wattle, Bitou Bush (introduced)Figure 11. Ground level photograph taken 20 February 2016 from north to south looking alongMystics beach toward Rangoon Island to show succession on the fore dunes.!1 3
NSW DEPARTMENT OF EDUCATIONILLAWARRA EECBeach Profiles - FBeach profiles are used by geographers to record the shape (morphology) of a beach. This datacan then be used to compare beaches and examine the effects of seasonal changes and / ordifferent management strategies.Beach profiles are often recorded in conjunction with a transect along which other physicalfactors and vegetation are recorded.MethodEquipment: Tape measure, ranging poles, clinometer, compass and recording sheet.Directions: Select sampling points for beach profiles across the width of the beachAt each sample point in turn, place a ranging pole at the start and finish. Point A should ideallybe the low tide mark.Note the main changes in slope angle up the beach, and use them to divide the profile into‘sections' for the profile.For each change in slope, use the clinometer to take a bearing to record the slope angle (ii). It isimportant to ensure that the bearing is taken from a point on the ranging pole that coincides withthe eye level of the person using the clinometer.Measure the distance along the ground of the section (i), and record this information alongsidethe slope angle.Repeat processes four and five for each break in slope that you have identified.Figure 12: taking a bearing using clinometer!1 4
NSW DEPARTMENT OF EDUCATIONILLAWARRA EECTransects - FA transect is a technique used to gather data across a landform/s by measuring physical factors atregular intervals. Analysis of this data enables inferences to be made to describe patterns ofspecies distribution, the influence of physical factors on the structure and composition ofvegetation communities.Equipment: Ranging poles; tape measure; compass; quadrats; camera; record sheetsMethodDetermine a starting point for example the high tide zone of the beach and then continue atright angles to the shore into and across the dune system towards the climax community.Use the ranging poles, tape measure and clinometers to create a beach profile.At regular intervals place the quadrant on the ground to measure the percentage vegetationcover and the frequency / coverage of different plant species at each sample point.The ACFOR scale for measuring species abundance A ABUNDANT (greater than/equal to 30%) C COMMON (20 to 29%) F FREQUENT (10 to 19%) O OCCASIONAL (five to nine per cent) R RARE (one to four per cent)Other data may also be measured and recorded including: wind speed and direction; soil type;soil moisture; relative humidity; soil pH; soil temperature; air temperature; soil salinity.Photographs emphasising vegetation structure and composition should also be taken atstrategic points along the transect.A precis map (summary) should also be prepared to show the location of the transect relative toother adjacent physical and cultural features.Figure 13: Quadrat sampling!1 5
NSW DEPARTMENT OF EDUCATIONILLAWARRA EECPhysical Factors and tests - FAs within all ecosystems, the physical factors within theenvironment are the limiting factors controlling the growth,abundance and distribution of all organisms. Geographersmeasure physical factors to understand the complexrelationship between organisms and their habitat.Measuring, recording and analysing quantitative data aboutphysical factors by isolating and measuring one factor at atime enables geographers to unpack the complexity ofinterrelationships between lithosphere, atmosphere,biosphere and hydrosphere.TemperatureSoil temperature is critical in the germination of seeds and therate and duration of plant growth. Temperature is measuredwith a thermometer.TemperatureTemperature influencesessential processes in allliving things includingrespiration andphotosynthesis. Everyliving thing has an optimalrange of minimum andmaximum temperatures inwhich they thrive andreproduce. Temperaturesabove or below theoptimum temperaturesplace the organism at riskas a limiting factor on theorganism’s survival.MethodInsert the thermometer probe five centimetres into the soil.Turn on the the thermometer.Measure and record the temperature in degrees Celsius.Repeat this procedure three times and record the average.Air temperature is a limiting factor upon plant and animalspecies. None more so than mangroves. In the coolertemperate southern locations of Australia only two species ofmangroves occur, the grey mangrove and the river mangrove.While in the warmer northern parts of Australia the numberof mangrove species is close to thirty.Procedure for measuring air temperatureTurn on the thermometer.Hold the thermometer one meter above the ground.Measure and record the temperature in degrees Celsius.Repeat this procedure three times and record the average.Questions to consider How much does vegetation cover affect temperature? What is the difference in temperature between sites? Compare temperatures built and natural environments.!1 6
NSW DEPARTMENT OF EDUCATIONILLAWARRA EECHumidity - FEquipment: Wet / dry bulb thermometer or hygrometerMethodUse: To measure the water content of the air as a percentagei.e. relative humidity.Directions: Fill the clear plastic reservoir with water.Suspend the hygrometer from a tree branch 1-1.5 metres fromthe ground. Leave for five minutes.Read the the temperature from the dry bulb thermometer.Read the temperature from the wet bulb thermometer.Calculate the difference in temperature between the two.HumidityHumidity determines theamount of water anorganism loses into the air.In humid environmentsorganisms lose very littlewater. However in hot dryenvironments plants andanimals utilise behavioural,structural and physiologicaladaptations to survive.Read off the scale to determine the relative humidity of the airby:1. Finding the dry bulb temperature in degrees Celsius in thedry column.2. Using the temperature difference between the twothermometers, select the appropriate column and follow itdown to the temperature of the dry bulb thermometer.Reading across you will get a reading of relative humidity.Interpretation of resultsThe humidity scale is a percentage scale. A reading of 100%mean the air is saturated and 20% the air is extremely dry.The amount of water vapour in the air depends on airtemperature. Warmer air can hold hold more water vapour. Ifair holds all of the water vapour it can at a particulartemperature it is said to be saturated.Humidity influences plant growth. Plants may displayadaptations to promote or prevent water loss depending uponthe ecosystem. For example rainforest plants generally havesofter leaves with large surface area covered in stomates thelatter opening to release water through transpiration. Thisincreased transpiration adds to water vapour in the air and ismore conducive to plant growth.In dry environments the leaves are tougher and smaller withless stomates and lower transpiration rates to assist in theretention of water by the plant.Questions to consider Is there a difference in humidity between sites?!1 7
NSW DEPARTMENT OF EDUCATIONILLAWARRA EECSunlight Intensity - FFactor: Light IntensityEquipment: Light MeterUnits: LuxUse: To measure the amount of light presentMethodRemove the cover from the light meter.SunlightSunlight is essential to alllife forms by providing theenergy required by plantsto photosynthesise. Theenergy stored within plantsis then transferred betweenorganisms through foodchains and food webs.Hold the light meter sensor horizontally one meter above theground.Turn on the light meter. Note if reading from the 20000 Luxscale the reading is to be multiplied by 10 and if reading fromthe 50000 scale multiply the reading by 100.Record the measurement in Lux.Repeat the procedure three times and record the averagesunlight intensity.Turn the light meter off when the measurements have beenmade.Interpretation of ResultsLike other plants mangroves convert sunlight energy intoorganic matter through the process of photosynthesis. Sunlightintensity and duration influences the levels of photosyntheticproductivity.Questions to consider Compare and contrast sunlight within and outside a forestedarea. Measure the sunlight at ground level in an area infested withan introduced species such as Bitou Bush. Consider how onespecies can form a mono culture. Discuss strategies for measuring light that ensures valid andreliable data collection.!1 8
NSW DEPARTMENT OF EDUCATIONILLAWARRA EECFactor: Wind Speed - FEquipment: AnemometerUnits: knots per hourUse: To measure the wind speed or intensity of the wind.MethodTurn on the anemometer (wind speed meter) by pressing theblack button within the orange square.Press the SEL (select) button to show knots as the units formeasuring wind speed.Hold the anemometer into the wind with the digital displaytowards you for 60 seconds.Wind speedWind speed can be difficultto measure at very high orlow levels. High winds canhave catastrophic effectsupon ecosystems bothlocalised or widespreaddamage to overhead cover.This sets in place asequence of events orsuccession as forestsrecover.Measure and record the maximum wind gust in this time.Also use a compass to determine the direction the wind iscoming from.Record the wind direction.Interpretation of ResultsWind speed and direction affects the temperature and humidityof an area.Wind affects currents and even creates small waves in theestuarine environment. Wind also contributes to the dispersalof Avicennia marina propagules in water currents and aidspollination.Questions to consider: Describe the amount of shelter from winds north, south, eastand west experienced at this location. Wind promotes transpiration, or water loss from plants.Observe plants in the area for adaptations that enable themto resist or reduce the drying effect of the wind. Observe how the exposure to the wind influences thedistribution of plant species across a sand dune succession. How might wind influence where rainforest occurs? How does wind cause erosion on our beaches?!1 9
NSW DEPARTMENT OF EDUCATIONILLAWARRA EECFactor: Direction - FEquipment: CompassUse: To measure direction, wind direction or aspect.MethodThe marked end of the compass needle points north.DirectionThe exposure of locationsto weather is a directinfluence of aspect.GPS (Global Positioning Satellite) can give an accurate positionon earth usingLatitude and Longitude calibrated in degrees,minutes and seconds.GPS uses include: police, emergency services, pilots, sailors,fishermen, surveyors, miners, farmers, ecologists, geographers,tourists, military, geologists, civil engineers, road builders, pipelaying contractors, car / truck drivers and golfers.The Etrex GPS used at Illawarra EEC is accurate to a tenth of asecond, which is about 3 metres anywhere on the planet.InstructionLocation of buttonWhat screen saysTurn on PowerbuttonRHS 2nd buttonEtrex logo etcReady to NavigatePress page buttonRHS Top buttonArrow (drawn)Press again““Compass (drawn)Press again""trip/speed/time etcPress again""MENU (highlighted)Press Enter buttonLHS 3rd button“Mark Way Point”Man with Flag (drawn)Bottom screenshowsELEVELEVATIONHeight above sea level inmetresSOUTHLATITUDEDegrees, Minutes, Seconds& 1/10 secondsEASTLONGITUDEDegrees, Minutes, Seconds& 1/10 secondsRHS 2nd buttonScreen goes blankTurn OFFPress POWERbutton!2 0
NSW DEPARTMENT OF EDUCATIONILLAWARRA EECSlope - FFactor: Slope or inclineEquipment: ClinometerUse: To measure the angle of a slopeMethodHold the clinometer up to one eye and line up the sights.Stand at the top / base of a slope and point the clinometer at anobject / person that is approximately the same height off theground as your eye.SlopeBeach profiles use acombination of distance andangle measurements toinvestigate the shape of thebeach. They also allow forcalculation of cross-sectionalarea as a measure of theamount of beach materialpresent at a locationPress the button or pull the trigger ( depending on the style ofthe clinometer) to release the pointer. Allow the pointer tostop.Remove your finger from the button or release the trigger andread off the angle from the scale.Interpretation of Results:The smaller the angle the more gradual the slope and viceversa.A gradual slope will not have as much water runoff andtherefore the potential for erosion is much less.The angle of a slope plus the aspect or direction is significant ininfluencing the distribution of vegetation communities andecosystems.
Identify student groups for group work. Brief the students on the purpose including the key inquiry question being investigated, geographical concepts to be explored and geographical tools to be used. Teach the fieldwork techniques to be utilised. Ensure the students know how they are to be assessed during and after the fieldwork.