Transcription
Application Tracing in Adaptive Server Enterprise (ASE) 15Mehul Wagle and Nitin VermaServer Performance Engineering and Development GroupSybase, Inc.Application Tracing in Adaptive Server Enterprise (ASE) 15P-1
Table of contents1.Motivation. 32.Feature Overview . 33.Command Interface . 44.3.1How to enable tracing . 43.2How to disable tracing . 4Scope of the feature. 44.15.How to trace SQL Text . 6Use Cases . 75.1How to trace a specific client session . 75.2How to trace sessions of a specific login. 85.3How to find which sessions are being traced . 105.4How to rebind to an existing trace . 105.5How to create trace output file at various paths . 116.Restrictions/Limitations. 117.Conclusion . 12Application Tracing in Adaptive Server Enterprise (ASE) 15P-2
1. MotivationSybase ASE 15.0.1 already has several tracing options that customers can enable tocollect useful diagnostic information. This information includes query-level detailslike execution plan, i/o cost, etc. For example, the “set showplan on” command willdisplay the plan for a SQL query just before executing it. However customers canonly enable diagnostics if they have access to their SQL client sessions connected tothe server. Hence tracing a running client application will require stopping theapplication, modifying its code to include the relevant diagnostic SQL commands atappropriate places, and finally restarting it. Restarting a client application is notfeasible in production environments, and modifying application code may not evenbe possible if it comes pre-packaged. Often customers face situations where a specificapplication is running significantly slow or not as per expectations. The cause isunknown since database applications behave like a black box. Even someone aspowerful and equipped as a database administrator has little access to server-sidetasks initiated by an application during execution. Keeping this in mind, it would beworthwhile if database users could trace their server-side tasks to monitor the healthof their application or if database administrators could do the same for all runninguser tasks so as to monitor the health of the server.With this in hindsight, the upcoming flagship release of Sybase Adaptive Server Enterprise (ASE) 15.0.2, introduces the “Application Tracing” feature. The primarymotivation behind constructing this server-side framework is to capture executionlevel traces of the server for any given client session in order to help debugperformance bottlenecks. This white paper essentially highlights the significantelements of this new feature set.2. Feature OverviewThe “Application Tracing” feature provides database users, having special privileges,the capability to turn on the commonly used server diagnostic options (refer section4 for list of supported options) for a running client session, and capture the traceoutput into a text file. Just like the server log file helps administrators to debug theserver-wide execution, an application trace file helps individual users to monitorsession-specific execution. All that a user needs to know for using this feature is theSPID (Server Process ID) of the session to be traced. The SPID is a unique numberassigned by the ASE database server to any task running on it, just like PID of aprocess in UNIX. There exists a stored procedure in ASE named “sp who”, whichreports all tasks running on the server at that moment. Once the SPID for the sessionto be traced is determined, the user just needs to issue the command:set tracefile “ file-path ” for spid Thereafter the traceable diagnostic options, when explicitly enabled by the user (e.g.set statistics io on), will take effect only on the target session and thecorresponding output will be redirected to the specified file. The diagnostic outputwill continue to be logged into the trace file as long as tracing is active for thatsession.In addition to being able to trace sessions by their SPID, one can also tracesessions of a particular login. For this the database administrator must create a“login trigger” (simply a SQL stored procedure executed at login time) for the targetuser login and provide the necessary permission to allow that login to trace itself(refer section 5.2 to understand how this is done). Once a login trigger is installed forApplication Tracing in Adaptive Server Enterprise (ASE) 15P-3
the desired login, it will be executed every time a user logs in to the server using thatlogin. Subsequently that entire session will be traced until the user logs out orexplicitly disables tracing.3. Command Interface3.1How to enable tracing for own session:Syntax: set tracefile “ file-path ”Note: Double quotes are compulsory for file path; files with relative path arecreated under SYBASE. for another session:Syntax: set tracefile “ file-path ” for spid Note: Double quotes are compulsory for file path; files with relative path arecreated under SYBASE. for rebinding with tracing already in progress on another session (used incase the tracer session quits):Syntax: set tracefile for spid for target session’s lifetime irrespective of its state of execution:Syntax:set tracefile “ file-path ” [for spid ]set export options onset option-name on/offNote: This interface is needed in ASE because ‘set’ options, enabled for a sessionwhile it is executing a stored procedure, are reset back once the procedure quits.3.2How to disable tracing enabled by the current session (either for itself or for another session):Syntax: set tracefile off enabled by another session (used in case that session quits withoutturning off the tracing):Syntax: set tracefile off for spid 4. Scope of the featureThe ‘set’ commands in ASE 15.0.2 whose output can be traced under applicationtracing context are:1. set show sqltext on/off (refer section 4.1)2. set showplan on/off 3. set statistics io on/off 4. set statistics time on/off 5. set statistics plancost on/off Application Tracing in Adaptive Server Enterprise (ASE) 15P-4
6. All ‘set option’ subcommands. To enumerate a few:o set option show normal/brief/long/on/off show diagnostics from all modules; each module will thus be set inthe off/brief/normal/long level that is coherent both betweenmodules and with the desired global brief/normal/long level ofinformationo set option show lop normal/brief/long/on/off show logical operators usedo set option show managers normal/brief/long/on/off show data structure managers usedo set option show log props normal/brief/long/on/off show logical properties usedo set option show parallel normal/brief/long/on/off show parallel query optimizationo set option show histograms normal/brief/long/on/off show histogram processingo set option show abstract plan normal/brief/long/on/off show abstract plan detailso set option show search engine normal/brief/long/on/off show search engine detailso set option show counters normal/brief/long/on/off show optimization counterso set option show best plan normal/brief/long/on/off show best plan detailso set option show code gen normal/brief/long/on/off show code generation detailso set option show pio costing normal/brief/long/on/off show physical io estimateso set option show lio costing normal/brief/long/on/off show logical io estimateso set option show elimination normal/brief/long/on/off show partition eliminationBelow are some ‘set’ options whose output is not captured by application tracing.These commands impact query results or query plan.1. set rowcount value 2. set forceplan on/off 3. set plan optgoal allrows mix/allrows dss The output of all dbcc traces (dbcc traceon( flag )) goes to the trace file,when enabled under application tracing context.e.g. dbcc traceon(100) will display a parse tree for each command.NOTE: The traced output will always go to the specified trace file and doesnot require traceflags 3604 or 3605 to be ON. In case these traceflags are turned on,they do not affect the trace output format in any way.Application Tracing in Adaptive Server Enterprise (ASE) 15P-5
4.1How to trace SQL TextSybase ASE 15.0.2 introduces a new ‘set’ command that can be used to print SQLText for ad-hoc queries, stored procedures, cursors and dynamic preparedstatements. This command is very helpful in debugging and tracing applications andshould always be used in conjunction with ‘set tracefile’ command.Syntax: set show sqltext on/offIn application tracing context, the presence of SQL Text in the beginning of eachtracing output is much needed, mainly when we trace some other session. WithoutSQL Text, it would be quite hard to correlate the trace output (showplan, statistics io,etc.) with its corresponding SQL or command.Additionally this command also prints a timestamp before each SQL Text that itoutputs. It prints the current date and time up to a granularity of 10 milliseconds.This fingerprint-like information is quite useful when digging into the commandsequence issued by a client application. It especially helps in computing delaysbetween two points of interest during application execution and also allows mappingof application-level events from trace file with server-level events from server log.NOTE: The “set show sqltext” command can also be used outside the ‘settracefile’ context. In that case, this command will only work for the current session.Once enabled, this interface prints the following: In case of an ad-hoc query, prints SQL statement text preceded by timestamp.o For Example:“select count(*) from sysobjects” prints:2007/06/20 22:51:35.46SQL Text: select count(*) from sysobjects In case of a stored procedure, prints the enclosing procedure name and linenumber for SQL statements and the SQL text itself for exec-immediatestatements. The timestamp is printed only once at the beginning.o For Example:“sp who” prints:2007/06/20 22:44:47.67SQL Text: sp whoSproc: sp who, Line: 0Sproc: sp who, Line: 20.Sproc: sp autoformat, Line: 163.Sproc: sp autoformat, Line: 211.SQL Text: UPDATE #colinfo af SET maxlength (SELECTisnull(max(char length(status)),1) FROM #who1result ), autoformat 1,mbyte case when usertype in (24, 25, 34, 35) then 1 else 0 end WHEREcolname 'status'.Sproc: sp who, Line: 67Sproc: sp who, Line: 69Application Tracing in Adaptive Server Enterprise (ASE) 15P-6
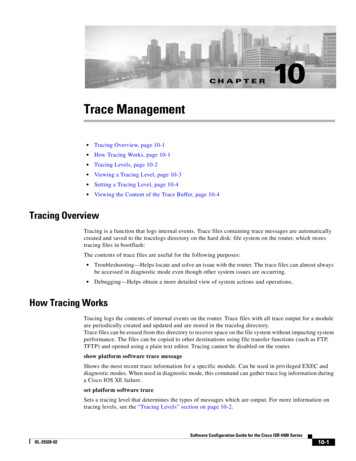
In case of dynamic prepared statements, prints the statement which creates alight weight stored procedure during prepare phase and prints the preparedstatement name with statement text during execution. Timestamp is precededbefore the SQL text in both cases.o For Example:“EXEC SQL PREPARE select statement FROM :m sqlstring;”prints:2007/01/10 05:21:12.39SQL Text: create proc select statement as SELECT title FROM titleswhere title id 'TC4203'“EXEC SQL EXECUTE select statement INTO :m title;”prints:2007/01/10 05:21:22.33Prepared Statement: select statement, SQL Text: SELECT title FROMtitles where title id 'TC4203' In case of cursors, prints timestamp followed by cursor name, operation (andstatement text only for DECLARE and OPEN operations).o For Example:2007/01/10 22:44:54.78Cursor: typelist, OPEN, SQL Text: SELECT DISTINCT type FROM titles2007/01/10 22:45:52.96Cursor: typelist, FETCH2007/01/10 22:46:27.12Cursor: typelist, CLOSE5. Use CasesHere are some of the use cases showcasing the usability of the feature.5.1How to trace a specific client sessionThis is useful for tracing already running applications connected to the server. Allthat one needs to know is the SPID of the client session to trace.spid # 10(tracer session)set tracefile"C:\Trace\trace11" for11goset export options ongoset show sqltext ongospid # 11(traced session)Action takenEnable tracing of session#11.A TPC-E driver toolstarting client sessionsexecuting SQL storedprocedures andqueries.set showplan ongoApplication Tracing in Adaptive Server Enterprise (ASE) 15Any settings made hereonwill be alive for entirelifetime of the tracedsession.Trace SQL text.Trace Query Plan.P-7
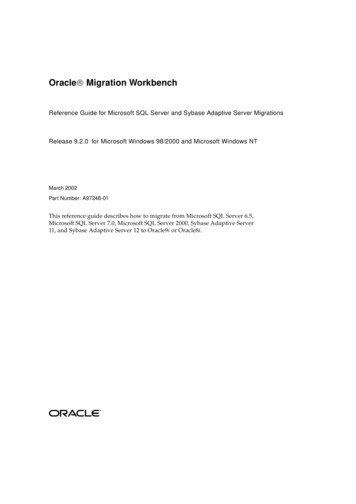
TPC-E 'trade result'transaction in execution.set tracefile offgoTPC-E 'trade result'transaction in execution.5.2The Query Text and Planwill go into the file“C:\Trace\trace11”.Disable tracing of session#11.The o/p will no longer belogged.How to trace sessions of a specific loginThis might be helpful in the following situations:1. A client application connects to the server via several SQL sessions, identical inprocessing, and user is interested in debugging any one session. Tracing by loginwould help in characterizing the behavior of the application in general, since thesessions initiated would have more or less similar workloads (e.g. TPC-C client).2. In an enterprise-wide ASE server installation, the database administrator maynotice that certain logins are causing either stalls or hangs during serverexecution. In such situations, the administrator may want to enable tracing forthe problematic logins to check for unexpected or suspect activity.3. A user may want to trace his client session in its entirety (from start till end).spid # 10Login as 'SA/SSO'.create procedure ltrigg asdeclare @filepath varchar(100)select @filepath "trace for spid" convert(varchar(10),@@spid) " at " convert(varchar(10),getdate(),5) " " convert(varchar(10),getdate(),8) ".txt"setsetsetsetAction takenConnect to the server asadministrator.Define a stored proc toenable tracing whenever asession executes it. Generate unique trace filepath from current spid, date.tracefile @filepathexport options onshow sqltext onshowplan ongocreate role trace rolegrant set tracing to trace rolegrant execute on ltrigg to trace rolegoDefine a special role withperms to do tracing and toexecute the login trigger.declare @login varchar(10)select @login "mwagle"exec sp role "grant", trace role, @loginexec sp modifylogin @login, "add defaultrole", "trace role"exec sp modifylogin @login, "loginscript", ltrigggoGrant the special role to thelogin of interest to be tracedand enable the role bydefault. Finally install thedefined stored proc as logintrigger for the target login.quitQuit the admin session.Application Tracing in Adaptive Server Enterprise (ASE) 15P-8
A TPC-C driver tool starting 50 client sessions ofTPC-C workload with username ‘@login’ above.Each of the 50 clients will fire the typical set andmix of stored procedures and queries inconformance with the TPC Benchmark C (TPC-C)specification.Multiple client sessionscreated with same login.The Query Text and Plan forthe 50 clients automaticallygoes into separate trace filesunder SYBASE.Sample trace output:(trace for spid32 at 25-06-07 22:38:04.txt)2007/06/25 22:38:04.22SQL Text: use tpccSproc: tc startup, Line: 5.Sproc: neworder local, Line: 0QUERY PLAN FOR STATEMENT 1 (at line 0).STEP 1The type of query is DECLARE.Sproc: neworder local, Line: 55QUERY PLAN FOR STATEMENT 3 (at line 55).STEP 1The type of query is UPDATE.2 operator(s) under root ROOT:EMIT Operator UPDATE Operator The update mode is direct. SCAN Operator FROM TABLE district Using Clustered Index. Index : d clu Forward Scan. Positioning by key. Keys are: d w id ASC d id ASC Using I/O Size 4 Kbytes for data pages. With LRU Buffer Replacement Strategy for datapages. TO TABLEdistrictUsing I/O Size 4 Kbytes for data pages.Application Tracing in Adaptive Server Enterprise (ASE) 15P-9
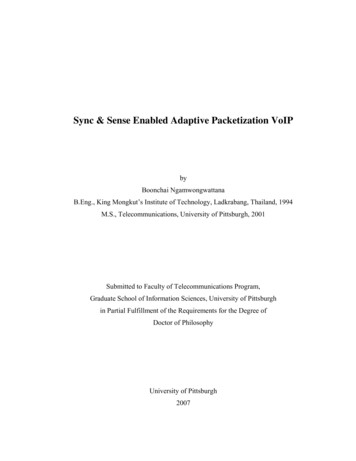
5.3How to find which sessions are being tracedThe stored procedure sp helpapptrace displays server-wide information about allopen tracing sessions. This procedure prints the SPIDs of all sessions being traced,the SPIDs of sessions tracing them and also name of the trace file.Syntax: sp helpapptraceColumns in the output:o traced spid: SPID of the session being traced.o tracer spid: SPID of the session tracing the traced spid . In casethe tracer session has exited, it prints ‘exited’ in place of the SPID.o trace file: The full path of the file capturing the trace output for the traced spid .Only SA/SSO is allowed to run this stored proc. This procedure is quite useful at thetime of trace rebinding method, which is discussed in the next section.5.4How to rebind to an existing traceWhen a session starts tracing another session and quits without disabling the tracing,then a new session is allowed to rebind with the earlier tracing context using therebind facility. This allows users to enable tracing and quit the tracer session. Laterthey can rebind to the traced session and enable/disable ‘set’ options. Only SA/SSOis allowed to use this facility.spid # 10spid # 11spid # 12set tracefile"/tmp/trace11"for 11goAction takenEnable tracing ofsession #11.Trace SQL text.set show sqltextongosp myprocgoquitsp helpapptracegotraced spidtracer spidtrace file----------- ---------- ---------11exited/tmp/trace11Application Tracing in Adaptive Server Enterprise (ASE) 15The sproc textwill go into thefile“/tmp/trace11”.Quit gracefully orabnormally.Session #12 canquery whichsessions are beingtraced.P-10
set tracefile for11goset show sqltextoffgoRebind to tracingof session # 11.set tracefile offgoDisable tracing ofsession #11.The o/p will nolonger be logged.sp myprocgo5.5Stop printing theSQL text.How to create trace output file at various pathsThe location of the trace output depends on the path specified as parameter to the“set tracefile” command.CommandAction takenset tracefile “myfile”goThe file ‘myfile’ will be created in SYBASE/set tracefile “mydir/myfile”goThe file ‘myfile’ will be created in SYBASE/mydir/set tracefile “/tmp/myfile”goThe file ‘myfile’ will be created as/tmp/myfile6. Restrictions/Limitations1. Only ‘SA/SSO’ (a user with administrative privileges) or users with “settracing” permission granted will be allowed to use application tracing. Userswith “set tracing” permission will only be allowed to trace their own sessions.They will therefore not be allowed to even query tracing information (usingsp helpapptrace) unlike ‘SA/SSO’.2. SET TRACEFILE interface doesn’t open an existing file. This protects amalicious user from corrupting the existing critical files like database devicefiles or SYBASE files present on public file systems like the NFS.3. Application tracing is allowed only for user tasks and not for system tasks. Soan attempt to attach with some system process (e.g. housekeeper) via "settracefile file-path for system-spid " will yield an error.4. One cannot trace more than one session at a time from a given session.5. One cannot trace the same session from multiple sessions.6. The file storing the trace output will be closed either when the session beingtraced quits, or when tracing itself is disabled.7. While writing the trace output, in case ASE runs out of file space it will closethe trace file and turn off the tracing.Application Tracing in Adaptive Server Enterprise (ASE) 15P-11
7. ConclusionAs part of Sybase’s commitment to provide features that add real value to itscustomers in mission critical environments, Sybase ASE 15.0.2 provides the“Application Tracing” feature. The new feature enables customers to debug their prepackaged applications and client sessions connected to the ASE database server. Theprimary goal of the feature is to provide, both users and administrators alike, thecapability to x-ray the server execution without interrupting any client-side activities.Users can now attempt to inspect slow or unexpected behavior experienced duringapplication execution. DBAs can do the same across all executing applications.Upgrading from one version to another becomes much easier for DBAs as they cannow easily pinpoint any issues with the help of these tracing options.About Sybase, Inc.Sybase is the largest global enterprise software company exclusively focused on managing andmobilizing information from the data center to the point of action. Sybase provides open, crossplatform solutions that securely deliver information anytime, anywhere, enabling customers tocreate an information edge. The world’s most critical data in commerce, communications,finance, government and healthcare runs on Sybase. For more information, visit the Sybase Website: http://www.sybase.com.Application Tracing in Adaptive Server Enterprise (ASE) 15P-12
In case of dynamic prepared statements , prints the statement which creates a light weight stored procedure during prepare phase and prints the prepared statement name with statement text during execution. Timestamp is preceded before the SQL text in both cases. o For Example: "EXEC SQL PREPARE select_statement FROM :m_sqlstring;" prints: